

Summary
Aging is a dynamic process with trends in health status of older adults varying over time due to a range of factors. We examined reported trends in morbidity and mortality among older adults over the past two decades in order to determine patterns of ageing across the world. We found some evidence for compression of morbidity, i.e., less amount of time spent in worse health, when: a) studies were of a good quality based on evaluation criteria scores; b) a disability- or impairment-related measure of morbidity was used; c) studies were longitudinal or; d) studies were conducted in the United States and some other high income countries. Many studies reported evidence to the contrary, i.e., for an expansion of morbidity but with different methods these are not directly comparable. Expansion of morbidity was more common when trends in chronic disease prevalence were studied. Our secondary analysis of data from longitudinal ageing surveys present a similar picture. However, there are considerable variations across countries in patterns of limitations in functioning and within countries over time with no discernible explanations. Data from low income countries is very sparse and efforts to collect information on the health of older adults in less-developed regions of the world is urgently required. Studies focussing on refining measurement with a core set of domains of functioning and studying the impacts of these evolving patterns on the health care system and their economic implications are needed.
Introduction
Demographic projections indicate that the populations of all countries are ageing, which will have wide-ranging impacts on social, economic and health systems. The world’s population aged 60 years and over is set to increase from 841 million in 2013 to more than 2 billion by 2050 and, indeed, exceed the number of children by the year 2047. By 2050, 21.1% of the world population will be aged 60 years or older, and 80% of this demographic will live in low and middle income countries as compared to about two thirds at present. Over the same period, global life expectancies are predicted to rise, reaching 83 years in more developed regions and 75 years in less-developed regions by 2045–2050; when compared to life expectancy figures for 2010–2015, the gap between life expectancies in more- and less-developed world regions is expected to narrow as less-developed regions achieve accelerated gains(1). The population aged 60 years and older in less developed regions is projected to increase from 554 million in 2013 to nearly 1.6 billion by 2050 given that the annual growth rate of the population of persons 60 years or over in these regions is almost three times that of the more developed regions of the world. This growth in the older population is occurring in parallel with increasing income inequality, disparities in access to health care and social support systems, and widening health gaps as a result of complex disease burden patterns and globalization of health risks. In most developing countries, these issues are compounded by a lifetime of accumulated health risks associated with poverty and inadequate access to health care. The changing epidemiological profiles in low and middle income countries are largely driven by a set of conditions, such as rapid urbanization, changing dietary habits and levels of physical activity, that are different from those that were prevailing when these shifts in profiles occurred in the high income countries. These populations seem to be experiencing an increase in the incidence and prevalence of chronic non-communicable diseases that appear before the onset of old age with a natural history that takes place in conditions of poverty – what has been referred to as ‘post-transitional illnesses in pre-transitional circumstances’.
In light of these trends, there has been much speculation about the health experiences that will accompany this aging cohort: will the years gained be productive and healthy, or will the elderly live longer lives in conditions of ill-health?
Three main hypotheses have been proposed to address this question (2). The compression of morbidity hypothesis posits a situation where the age of onset of morbidity is delayed to a greater extent than life expectancy increases, thereby compressing morbidity into a shorter period at a later age (3). The expansion of morbidity hypothesis maintains the opposite, that increases in life expectancy are matched or exceeded by added periods of morbidity (4). Both compression and the expansion of morbidity could happen in absolute or relative terms: changes in the absolute number of years lived with disability or in terms of healthy life expectancy as a proportion of total life expectancy.
Healthy life expectancy is a measure that combines mortality and morbidity information in a single index, expressing the number of healthy years of life lost due to poor health with a range of severities being incorporated into quantifying poor health based on different weights being assigned to different severity levels of disability resulting from different health conditions. Data from the Global Burden of Disease 2010 show that from 1990 to 2010 as life expectancy increased, healthy life expectancy increased more slowly; relatively little progress was made in reducing the non-fatal health impacts of diseases. For example, over this period, males aged 50 years had a healthy life expectancy increase of 0.75 years for each year of increase in life expectancy. The corresponding increase in healthy life expectance for women at age 50 was 0.77 years. While life expectancy among Japanese women— currently the highest in the world with also some of the lowest disability levels in the world—increased by 3.9 years, healthy life expectancy increased only by 3.2 years over the same period (5).
Evidence for the equilibrium of morbidity theory supports a more multidimensional perspective, whereby lessened progression and severity of morbidity are accompanied by increases in moderate or mild morbidity (6).
Data suggest that though severe disability free life expectancies may have declined in some high income countries over the last four decades, there has been stagnation in disability free life expectancy (7). In fact, among older adults there may have been a relative expansion of morbidity (8). Health interventions that are targeted at lethal diseases may lead to an increase in years spent with disability suggesting that it is critical to improve the dissemination and uptake of lifestyle change interventions that reduce risk across a range of chronic conditions. The co-existence of many diseases in an individual may mean that when mortality due to one disorder is prevented, disability due to another may become increasingly important.
While it is clear that life expectancy is on the rise, the patterns of increase have not been consistent, with variable surges and periods of stagnation (9). There is debate about whether gains in life expectancy will occur at a diminishing rate, or continue indefinitely (6).
Studies of morbidity trends have drawn conflicting conclusions, and are highly subject to a number of study-design and contextual factors, including the definition of morbidity, time period and study population (9;10). A number of review studies from high income country settings have reported declining disability over the past few decades (3;11;12), with concurrent increases in chronic disease prevalence (13–16), noting a lack of evidence from those aged 85 and older (9). This, however, is not uniformly true. In 2007, a review by the OECD, that used disparate data reported by countries, revealed that though there is clear evidence of a decline in disability among elderly people in five of the twelve countries studied, in other countries rates are increasing or stable. Although prevalence in most of these conditions and risk factors has increased, no clear judgment could be made about the linkages between chronic conditions and severe disabilities. The OECD study relied on a proxy operationalisation of ‘severe disability’, namely one that a) was most clearly consistent with the available national, self-report, survey data, and b) was intuitively linked to long-term care needs. The paper concludes that ‘it would not seem prudent for policy-makers to count on future reductions in the prevalence of severe disability among the elderly, but rather to expand national capacity in long-term care and programs to prevent or postpone chronic conditions.’ The situation in low and middle income countries has much less extensively studied with very limited data available.
Delineating the path of health and morbidity in old age has important public health and economic consequences for aspects of medical spending (17), social program planning (18), predicting trends in the workforce (18) and the social patterning of poverty (19).
In this paper we have first performed a systematic literature search to explore trends in morbidity among older adults and life expectancy, and weighed the evidence to determine whether trends presented a pattern of compression, expansion or equilibrium. Specifically, we aimed to answer the questions: Have there been changes in the age of onset and/or severity of late-life morbidity, in relation to life expectancy? Which hypotheses of health and aging trends have been supported by recent literature?
Second, we have also undertaken new analyses of publicly available cross-national data sets that contain harmonised items related to the health status of older adults over multiple periods in time. In these analyses we address the related questions: has the proportion of older adults with disability remained stable, increased or decreased over time? Is this change due to age or cohort effects? What are the factors that influence these longitudinal trends? And, how do these patterns compare across countries? We use data from all years that are currently available for public use. We describe below the approaches undertaken and the resulting findings.
We have focussed our analysis on trends in functioning in older adults as the review by Prince et al in this series address the issue of trends in chronic diseases in far greater detail with an analysis of the Global Burden of Disease data that shows that nearly a quarter of all disease burden globally is being experienced by those 60 years and older with the per capita burden being higher in developing countries driven mainly by cardiovascular diseases, sensory impairments and respiratory diseases.
Trends in morbidity
Conceptualising health for purposes of measurement
The major issues while trying to understand levels and trends in the health of older adults is the lack of a common definition of health, an understanding of its constructs, and the subsequent measurement of health in a way that is comparable over time and across populations. We address these aspects, essential for addressing our questions, below.
Health and social surveys rely heavily on self-reported measures. Self-reported health state has been traditionally measured in the older population using three main strategies. The first approach is to ask respondents a global question on overall health that rates their overall health using a 5-point rating scale that ranges from very good to very bad (or from excellent to poor). Though this overall rating of health has been shown to be correlated with future mortality in cohort studies, it is not clear what dimensions of health this question captures and whether it produces inconsistent patterns in population level studies across all ages. This has led to the second strategy of asking multiple questions across a parsimonious set of multiple domains that is believed to capture most of the variance in health states across population groups as elaborated later. The third strategy, frequently employed in aging studies, is a set of questions that measure functional independence by asking about activities of daily living (ADLs), such as bathing and dressing, and instrumental activities of daily living (IADLs), such as shopping or managing one’s finances. Counts of ADLs and IADLs are then used to quantify health states and measure changes over time.
Comparable measurement of health states is essential in order to examine relationships between current levels of health to other aspects such as future non-fatal health outcomes, risk factor profiles, and causes of death. In order to address this issue, the World Health Organization (WHO) has conceptualised a health state as a multi-dimensional attribute of an individual that reflects his or her levels of the various components or domains of health at a given point in time and differs from pathology, risk factors or etiology, and from health service encounters or interventions. All societies have an intuitive notion of being ‘in a good state of health’ that allows us to make statements such as an individual ‘A’ is in a better state of health than another individual ‘B’. These non-fatal aspects of an individual’s health state have been the focus of an extensive body of literature that has grown steadily in the last three decades, and have been incorporated into national and international health statistics such as the regular reporting by the WHO of Disability-Adjusted Life Years (DALYs) and healthy life expectancy (HALE) which are essentially individual health states aggregated to population levels.
Within the framework of WHO’s International Classification of Functioning, Disability and Health (ICF) (20) an individual’s health state is understood as a vector of capacities to function in a set of domains that range from hearing and seeing to moving around to cognition and affect. An individual’s capacity to function in a domain of health is, thus, an individual’s intrinsic ability irrespective of the environmental barriers or facilitators that may be in place in the person’s real-life situation. This notion of capacity corresponds with the common-sense interpretation of health for health— an attribute of the person and not their environments. The latter will admittedly have a substantial effect on the way the health state plays out in the individual’s actual environment but that is not the individual’s health per se. For the purposes of measurement, these domains of health need to be reduced to a parsimonious set that captures most of the variation and approximates the respondents’ intuitive notion of health. The measurement across these different domains must be combined into a single metric of functioning that ranges from good functioning (health) to difficulties in functioning (disability or poor health) that can then be compared across populations and over time. . This then allows the direct comparison of health states across single and multiple diseases as well (21).
This conceptualisation preserves the spirit of the WHO Constitution definition of health. It does not equate health with diseases or diagnostic categories, it recognizes a causal chain through which risk factors and environmental factors are determinants of diseases, and diseases and environmental factors in turn are determinants of health states. Using a parsimonious but comprehensive set of domains as the basis for descriptions of health states allows detailed data collection on key components of individual health and provides a basis for describing and measuring health states, and for carrying out causal analysis of determinants of those states, including risk factors and environmental factors. The differing choice of domains in studies means that comparisons are often possible across studies only for specific areas of functioning such as cognition or mobility or for a small subset of items such as activities of daily living (ADLs) or instrumental activities of daily living (IADLs). A set of domains that spans physical, cognitive and affective aspects of functioning has been used by the WHO for its population surveys over the past decade (22;23). A similar set has been developed for use in health interview surveys by the Budapest Initiative of the United Nations Economic Commission for Europe and used in European and American surveys (24). While a common set of domains for use across international studies is helpful for comparisons, long running national longitudinal studies also have a need for comparisons of trends over time within their respective survey and therefore maintain existing questions. Hence, adding a subset of common domains to these studies would allow comparability with international efforts by developing a robust domain-based summary measure without losing the important ability to examine changes over time within a given survey.
To date, however, the field continues to suffer from the lack of a single, “gold standard” approach to creating a single metric of health. Different strategies have been used to create a single metric of health combining the capacities in the different domain. These strategies have either used the valuation of different health states by individuals and used this valuation function to create a cardinal scale of health or, alternatively, used different psychometric approaches to combine the information from the different domains using either classical test approaches such as factor analysis or modern psychometric techniques based on Item Response Theory (IRT) (22;25). Attempts have also been made to address problems of comparability surrounding self-reported health in surveys by using anchoring vignettes to detect and correct for systematic biases in reporting (26). Among other issues, this use of different statistical approaches to create a single composite measure of health makes comparison across studies problematic.
Patterns and trends in the health of older adults and their determinants
Currently studies across the world do not offer consistent support for any one of the three hypothesized theories (compression, expansion, or equilibrium of morbidity). Many studies have reported some evidence for compression of morbidity (8;27–32)and several others reported some evidence for expansion of morbidity (27;33–38). Of the studies that have addressed more than one level of severity in decrements in health, five had support for equilibrium of morbidity theory (7;39–42). Several studies reported inconclusive or variable results (27;43–45).
A recent review concluded that the answer to the question of whether increases in life expectancies across the world, and especially among the oldest old, have been accompanied by a postponement of disability is still open (9). While studies in most high income countries have generally tended to conclude that most indices of ADL are improving, there has been some conflicting evidence. A study from Spain reported consistent worsening in an index of ADLs over time, more so for women than for men (31). A study in Sweden has reported increases in ADLs over the last 2 decades (46).
Morbidity Measures
Patterns of morbidity-free life expectancies have varied according to the definition of morbidity used in the different studies. Disability- or impairment-related measures of morbidity, including functional limitation, discomfort and/or activity restriction, have been the most commonly studied. As noted earlier, most often morbidity is self-reported, though increasingly studies on ageing have begun to incorporate performance-based measures as well (42) and have at times reported severe disability determined by a medical expert (30). Of the studies that defined morbidity as a form of disability or impairment, twice as many studies contain evidence to support compression of morbidity (8;27–32;39;41;47) than expansion (27;33;34;48;49). Four of the studies reviewed offered support for equilibrium of morbidity, and five had inconclusive results. Three studies have reported data that span a long time over 20 years (27–29).
Many studies have quantified morbidity-free life expectancy by the absence of major chronic disease(s), with seven of the studies reviewed considering multiple diseases or disease clusters (32;36;41;43–45;47), and two looking at a single major chronic disease (38;48). Three of the seven studies examining multiple diseases reported evidence for expansion of morbidity, and none supported a compression of morbidity depending on how this was defined. Most notably, in the Netherlands (36) between 1989 and 2000 life expectancy without chronic diseases decreased significantly, and this was more so for women with the gap in 1989 being 0.6 years, with women having longer disease free lives, while in 2000 the gap was 2.9 years with males now having longer lives free from chronic diseases. In Denmark (47) an increase in total life expectancy between 1987 and 2000 was accompanied by an absolute decrease in disability-free life expectancy among those 65 years of age and older suggesting improving health status of older adults. However, the life expectancy with chronic illnesses showed little change for older adults with some increase in cardiovascular diseases among men. Two studies looking at a single disease reported patterns of expansion of morbidity for cancer (38), and an increase in stroke prevalence(48), but also noted improvements in stroke recovery and cancer cure rates. Only one study investigated disease severity (limiting vs. non-limiting illness), and reported equilibrium of morbidity (41). Five studies had inconclusive/variable results, including sex-specific (32;43;44) or disease-specific (45) variance.
Studies adopting indirect indicators of morbidity such as age at first hospitalization (35) and patterns in the need for long term care (30), reported a pattern of expansion and compression, respectively.
Geographically, studies of populations within European countries provide conflicting evidence as noted earlier with studies offering support for compression of morbidity and expansion of morbidity being almost equally divided. Studies from Asian countries have failed to report evidence for compression of morbidity (50;51). Two studies have shown some evidence for expansion but most studies from the region show variable results. Evidence for compression of morbidity (as disability) has been reported by many studies from the United States.
A longitudinal study, which explored stroke prevalence in China, suggested expansion of morbidity with regard to disability-free life expectancy (48).
Severity
Twelve studies reviewed included two or more categories of morbidity severity, and could thus test the equilibrium of morbidity hypothesis. All studies reported trends of increasing total life expectancy. Five studies found evidence to support equilibrium of morbidity, defining morbidity according to disability (7;39;42), functional limitation (40) and illness/limiting-illness (41).
Specific domains of functioning
Recent data from the United States and Europe provide further evidence with regard to the questions raised and have addressed specific questions about declines in specific domains of functioning. A recent analysis of data from the United States suggested that risks associated with diseases of older adults such as obesity and inflammation are increasing (52). While survival with cardiovascular disease and cancers may have improved there is no evidence that their incidence is actually on the decline. Musculoskeletal conditions and arthritis have been increasing. Furthermore, this study showed that there has been an expansion of life with disease and with limitations in mobility functioning. Several other recent studies have also suggested that disabilities may be increasing in newer cohorts of older adults. Using newer forecasting methods, a recent study has concluded that the increasing trends in obesity prevalence in the United States are likely to not only threaten life expectancy gains but also considerably increase morbidity and worsen health outcomes in future cohorts due to related complication such as diabetes and cardiovascular disease (52).
A recent study examining cognitive impairment in two cohorts of older adults 70 years and older in 1993 and 2002 respectively showed that the latter cohort had fewer IADLs limitations but higher rates of hypertension, obesity, diabetes and heart disease. The proportion of people with cognitive impairment was lower (8.7%) in the latter cohort as compared to the former cohort (12.2%). Multivariable analyses concluded that increasing levels of education and net worth among the older population explained a large part of this difference lending support to the cognitive reserve hypothesis. This led the authors to conclude that, while the risks had increased over time, early identification and more-effective treatment had perhaps led to a lack of decline in cognitive function. However, assessing trends in cognition using longitudinal data poses a challenge since respondents may learn how to do the tests and the practice effect may compensate for declines in cognitive performance (53). Additionally, missing data on respondents who become severely cognitively impaired (such as due to stroke or dementia), or those lost to follow up due to death or other reasons, poses a challenge.
Analyses of longitudinal studies of ageing
We have undertaken an analysis of multiple longitudinal studies of ageing and of cross sectional analysis of a large dataset from the World Health Surveys as described in the supplementary material. Box 2 describes the basic characteristics of these data sets. We present the results of these analyses below.
Levels of disability by age over time
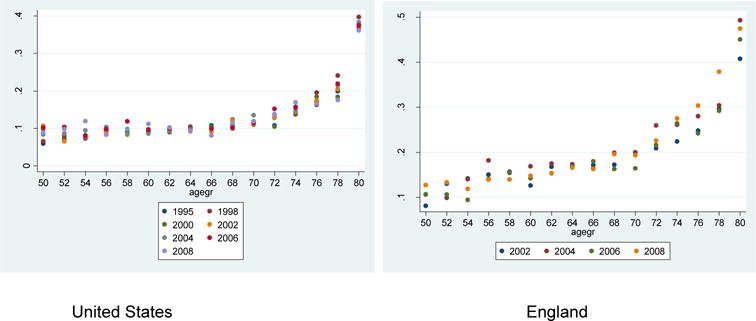
ADLs: Across all countries in the surveys the proportion of respondents with ADL limitations shows a steady increase with age. However, this increase is significant between the ages of 50–70 years in countries like Greece, Spain, and Italy compared to countries such as the Netherlands, Sweden and Switzerland where these increases seem to happen predominantly among those over 70 years of age. The steady gradient is also observed in the United States and England.
Over the two waves of SHARE (54), in the majority of countries, the proportion of respondents with ADL limitations across age groups seems to have stayed fairly constant. In the United States these proportions seem to have increased since 1995 steadily across all age groups. In England, this seems, in contrast, to be declining over the period of the survey across all respondents except the oldest old (see Figure 1).
Figure 1. Levels of ADL limitations by country, age and time.
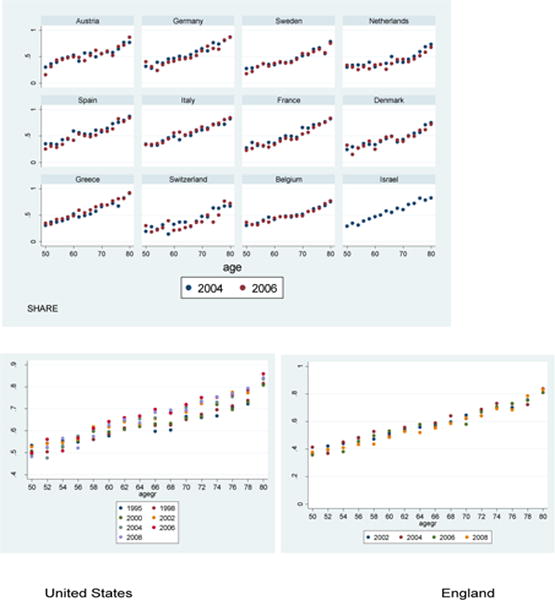
Data taken from SHARE (54).
IADLS: The proportion of respondents with IADL limitations is consistently lower than those with ADL limitations across all the countries. This was not surprising, given the typical hierarchy of ADLs as the most-severe and least-common form of disability, when compared with IADL disabilities, and to a greater extent, physical functional limitations (which are the least severe and most common). The age patterns of IADLs across age groups and across countries are very similar to that of ADL limitations: a steady increase in the proportion with IADL limitations with age in most countries except Netherlands, Sweden and Switzerland with increases predominantly among those over 70 years of age.
As with ADL limitations, a larger proportion of respondents in Italy report limitations in IADLs across all ages in the second wave while this proportion seems to be declining in Spain over the two waves of the study, with all other countries showing little change across the two waves. In the United States the proportion of this population seems to be declining over time especially in the older age groups (75 years and older) while in England the pattern seems to be the reverse with increases in these proportions over time, more so in the oldest age groups (see Figure 2).
Figure 2. Levels of IADL limitations by country, age and time.
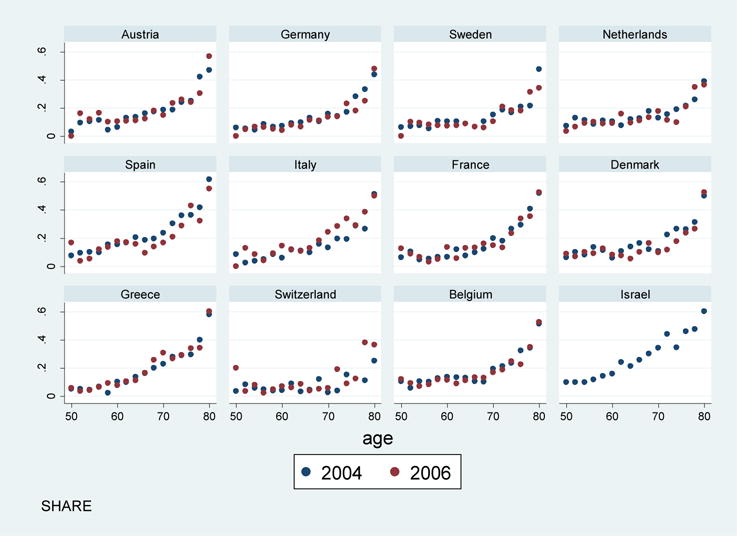
Data taken from SHARE (54).
Longitudinal analysis
Age-Period-Cohort analysis
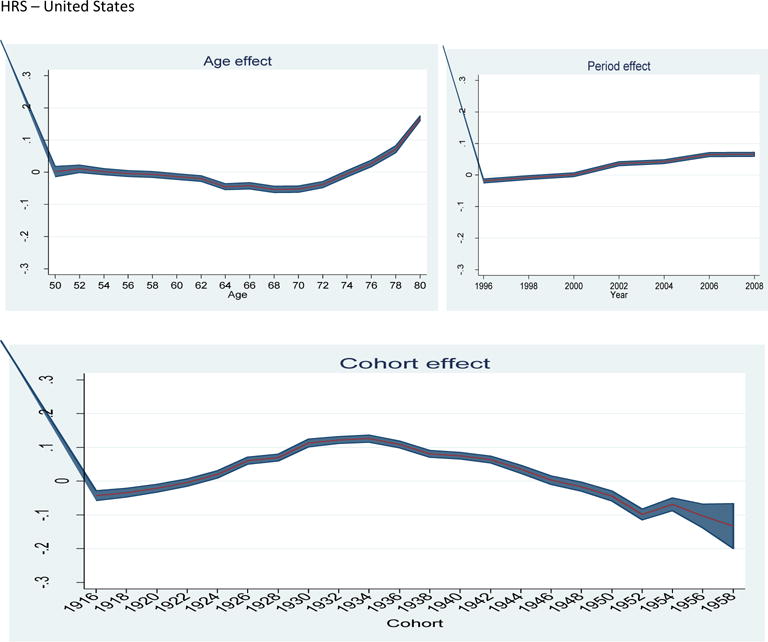
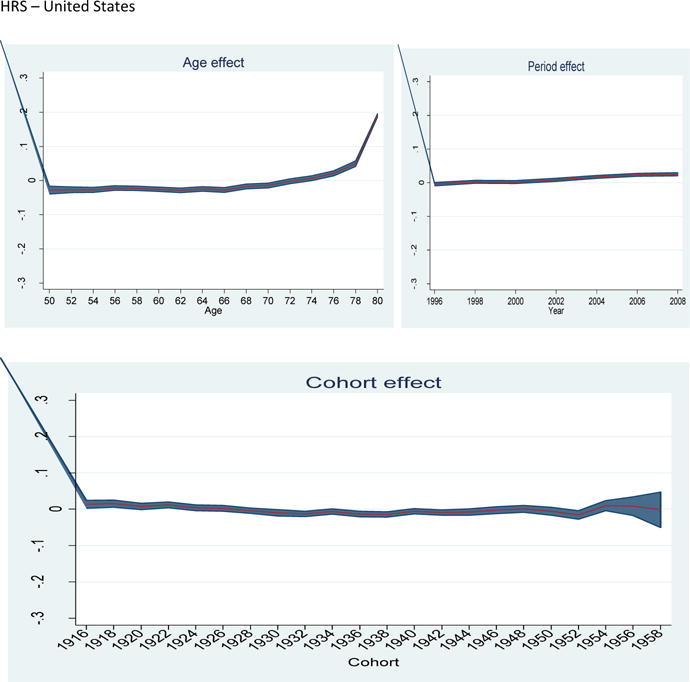
ADLs: Analysis of the age, period and cohort effects across the different studies shows a very clear linear effect with a clear trend of increasing levels of disability with age. However, though this trend is consistently seen throughout the age span over the age of 50 in the SHARE countries and in England, this becomes apparent only in the older age groups, after age 70, in the United States. The cohort effects show that in the SHARE countries levels of ADL limitations have been declining steadily across consecutive cohorts and have continued to do so right up to the most recent cohorts included in the study. In the United States ADL limitations steadily rose up until those born in 1935 and began declining thereafter with a suggestion of a rise again in the cohort born between 1952–1954, though not to the levels comparable to those that were born around 1935. In England, in contrast, the levels of ADL disability seem to have remained more or less constant among cohorts born since the 1920s, with some suggestion of a cohort effect in 1942 and 1946 with increases in ADL limitations in those cohorts.
IADLs: With regard to IADLs, the results are more consistent across studies with an age effect being evident across all countries only in those over the age of 70, with steady increases in IADL limitations thereafter. There are no evident cohort effects in any of the studies.
Generalised estimating equations analysis
We also carried out longitudinal analyses of these data sets using a generalised estimating equation model. In the HRS, ELSA and SHARE studies (54–56) across all age groups, the likelihood of developing disabilities, as measured by ADL and IADL limitations, increased with every wave. Women were also more likely to develop disabilities as compared to men (see supplementary online material).
In order to compare these results with those from low and middle income countries, we analysed data from the 10/66 group of studies (57). The study sample consisted of community residing individuals aged 65+ in Cuba, Dominican Republic, Peru, Mexico, Venezuela, Puerto Rico, China, and India. Two waves of data from 2003 and 2007 are available. We used a score derived from the measure of disability, the WHO Disability Assessment Schedule, version 2.0, used in this study to compare changes in disability over time. Our analysis shows that in these countries, consistent with our analysis of other surveys, the health of women declined more significantly than men, as did the health of those with poorer education and increasing age. This was consistent across all the sites.
Finally, our cross-sectional analysis using the data from the World Health Surveys shows that health status declines as the population grows older with a marked decline in the oldest old. This decline in health is greater in lower-income than higher-income countries. Further examination of declines in health by socioeconomic status reveals that the magnitude of age-related decline is the same across wealth quintiles in lower-income countries while in high-income countries health declined far more rapidly in the poorest quintiles as compared to the richest section of the population. The health status of older adults in the poorest quintiles was at least decade behind that of those in the richest quintile. Of interest is our finding that the health of the poorest quintile of the population in higher-income countries was comparable to the health of the upper income population from lower-income countries.
Analysis of this data set also showed that those with the least education or wealth had the worst health. Further examination showed that this difference in health was significant in the domains of mobility, self-care, pain, cognition, interpersonal activity and vision. Relative inequalities in the different domains in health were higher in the higher-income countries than the lower-income countries.
Implications for the future and possible interventions
Our systematic examination of the literature revealed that support for morbidity pattern hypotheses varied primarily according to the type of health indicator. Disability- or impairment-related measures of morbidity tended to support compression of morbidity, whereas chronic disease morbidity tended to support expansion of morbidity hypothesis. Similar patterns were previously reported in a review by Parker & Thorslund (58).
A simplified view of population health change progresses through the following stages: risk factors → diseases/conditions → loss of function → disability → death (10). Our findings suggest that loss of functioning and disability over the life course may be improving. This might be attributed to advances in the field of rehabilitative medicine, modifications to physical living environments, or education and early-life experiences (59). Contrarily, morbidity as chronic disease, at the other end of the spectrum, could be worsening (although fewer studies reported data on this dimension of morbidity). The extent to which this phenomenon is a product of heightened awareness of diseases versus actual disease increase is likely disease- and setting-dependent. Our study did not encompass trends in risk factors, which may be worsening (in the case of obesity and sedentary lifestyles) or improving (in the case of tobacco use) (3). Equilibrium of morbidity may also be roughly placed within this spectrum, with more-severe disability positioned to the right, and less-severe disability, leftward. Among studies that assessed morbidity severity, we did not find predominating evidence for any one health and aging hypothesis.
Possible trends according to geography and study design were detected, although these may be somewhat attributed to differing morbidity definitions. Cambois et al., for example, aptly demonstrated the importance of consistently defining the morbidity constructs, as four different health surveys in France had comparable findings for a range of morbidity indicators as long as consistent definitions were used across the different data sources (27). Geographically, studies from the United States indicated compression of morbidity, but all studies reported morbidity as disability and thus it is unclear whether the United States experienced similar patterns for other measures of morbidity. Data from Asian countries, on the other hand, demonstrated expansion of morbidity more often than compression (using disability measures), but results were largely inconclusive or variable. Regrettably, the studies included in our review did not adequately represent developing countries. The strengthening of data collection and epidemiological research capacity within these settings is fundamental to better understanding health and aging trends, as data from more developed countries may not be relevant. A shifting disease burden from infectious to chronic diseases, for example, implies changing patterns of illness and disability within populations (60).
The use of prevalence-based life tables (primarily by cross-sectional studies) enabled the detection of shifting health patterns over the long term. Prevalence-based life tables are less sensitive to dynamic health states with multiple morbidity-related transitions (61;62). Nearly 70% of the reviewed studies were cross-sectional, reporting mixed support for the three hypotheses according to various health indicators. This was not surprising, as specific diseases or conditions may demonstrate characteristic progression patterns (60). Multistate life tables, which can be employed with longitudinal data, have the advantage of detecting transitions between stages of morbidity (61). Longitudinal study designs tended to report compression of morbidity as disability, although there was limited longitudinal data on other dimensions of morbidity. As more longitudinal data becomes available, the development of advanced methods of analysis, such as multivariate stochastic process models, will help to more accurately delineate trends in dimensions of morbidity and mortality (63). Studies that analyzed administrative data aligned closely with the trends reported by morbidity definition, finding compression of disability, and expansion of chronic disease.
Preventative measures initiated early in life may be fundamental to negating expansion of morbidity later in life, or sustaining situations of morbidity compression. Reviewed studies suggested a possible expansion of chronic disease, with some support for expansion of disability- or impairment-related morbidity. Previously, health problems later in life have been linked to earlier life experiences, such as possession of risk factors (64;65). Because the direction of health and aging trends in future years may be different from the current situation, ongoing research through population surveys is justified to anticipate and meet changing needs.
The paucity of studies from less-developed countries highlights the need for population research in such regions. Less-developed countries are predicted to experience the greatest gains in life expectancy over the coming years (1); epidemiological patterning of health trends will enable the ability to foresee and plan for changes in population health. In addition, research that explores relationships between various dimensions of morbidity is also warranted. As longitudinal data becomes more available, sophisticated methods of multivariate analysis can help to delineate disease- and population-specific health trajectories. Furthermore, detailed analyses of data that includes life histories (including reproductive histories) will also be required to understand the reasons why gender differences exist in these health trajectories. A recent decomposition analysis that addressed differences in disability between older men and women revealed that a large part of these differences arise from the social determinants such as education, employment, economic and marital status (66).
Our search strategy included two major databases and was limited to English language results, thus relevant studies may have been missed. Decreasing the sensitivity of the search keywords would have expanded the pool of results, but we found that key articles were retrieved by the employed strategy, and generalizing search terms did not appear to be advantageous over hand searching of relevant publications and reviews. We adopted a broad definition of morbidity to include studies with multiple dimensions of morbidity and assess their relationship with mortality. Diversifying the morbidity construct allowed us to assess broader patterns, although varying outcome measurements and study designs decreased the degree of comparability between reviewed studies (67). Because we aimed to review studies from diverse geographical regions, we did not include studies that assessed trends in general, self-rated health. General self-rated health is a useful indicator of overall physical health, but has limited comparability across cultures and gender (68). Lastly, certain morbidity measures, geographical regions and study designs were more heavily represented than others within the 25 datasets that we reviewed, and not all studies reported morbidity by severity level. Thus, we cannot conclude with certainty about the trends of various dimensions of morbidity.
Secondary analysis of data
Our analysis of three large longitudinal surveys of older adults with a harmonized assessment of disability with regard to ADL and IADL limitations, shows varying patterns. All countries do not seem to provide consistent evidence for a compression of morbidity. Countries like Italy, Spain and Greece seem to have much larger proportions of persons who are disabled across all ages irrespective of the measure used. However, problems with IADLs seem to become more apparent among the older of the respondents across all these countries. While consecutive cohorts seem to be steadily in better health with regard to declines in ADL limitations, this is not true for limitations in IADLs. Also, in the United States and England, the apparent increase in ADL disability in more recent cohorts (1955 and 1944 respectively) needs to be watched over time.
We have chosen not to undertake a meta-analysis given the very disparate outcomes used in the studies in the literature as well as the different approaches to conceptualise and construct a single measure of health status.
Issues of conceptualisation and measurement
In order to track the health of older adults over time and across populations it is imperative to have a common conceptual framework and approach to measurement. Current longitudinal studies of ageing are increasingly working towards an effort at harmonisation of these studies such that a common set of measures are used in these disparate studies. A minimum sub-set of measures with standardised approaches to implementation will go a long way in increasing the robustness of these comparisons. Continuous measures of functioning capacity coupled with measures of more severe levels of disability such as ADLs will perhaps be complementary in this regard. In addition, incorporating performance measures of functioning such as tests of cognition, gait speed and grip strength, along with measures of physiological risk such as raised body-mass index, increased waist hip ratios, hypertension, hyperglycemia, hyperlipidemia and increased inflammatory markers such as C reactive protein will further the efforts at comparing health outcomes in these populations. Thus, rather than focussing on trends in the prevalence of chronic diseases alone, functioning based assessments of health status (comprised of a core set of domains) need to become an integral part of national data collection efforts to monitor trends in healthy life expectancies especially for older adults.
Implications for the future
The expectations are that with early detection and intervention for a range of risk factors and chronic health conditions, an increasing number of individuals globally will live into older ages. Recent studies from the United States and Denmark suggest that about 30–40% of the oldest old may live independently without marked disability. This levelling off of disability in the very old suggests that interventions aimed at promoting health in older adults are likely to pay dividends.
However, many of the causes of disability in later life are the result of accumulated lifestyle and other risks much earlier in life, interventions must be directed at reversing trends in smoking and obesity at younger ages for payoffs in the future as also suggested by the review by Prince et al in this series. Increased physical activity, greater mental stimulation, participation in leisure activities, coupled with early detection may help preserve cognitive function into older ages. Additionally though, as noted by Beard and Bloom in their Viewpoint in this series, these risks continue into older ages warranting ongoing surveillance and interventions in older adults as well.
Training strategies that may alter cognitive-behavioural styles of older adults to adapt to changing life circumstances may also help in keeping older adults in better health in later life by preserving cognitive function in later ages.
The key question remains that as populations worldwide continue to live longer will they remain in in good health for those added years. As we have pointed out, an individual’s health, irrespective of having a chronic illness, is defined by being able to execute series of day to day actions and tasks. The capacity to do this with as little difficulty as possible defines good health. As noted by Beard and Bloom, comprehensive assessments of functioning are needed since this conceptualisation of an individual’s health is not only particularly relevant for older adults who may have multiple chronic illnesses, they are also far better predictors of survival than merely the presence of single or multiple diseases. Health interventions can then focus on improving the functioning of older adults within an integrated people centred care strategy across the entire continuum of care (69). As noted in the comments by Fried and Rodriguez-Manas and Banerjee in this series, drawing attention to the identification and management of the health of older adults as they grow frail with multiple chronic conditions is particularly urgent.
Moreover, as Steptoe et al point out in their review, the relationship between health and subjective well-being (SWB) is bidirectional. Older adults with chronic illnesses are likely to have decreased well-being. SWB is predictive of longer survival. As Bloom et al point out in their review in this series the right economic, social and health system policies coupled with individual behaviour changes can ensure the future health and well-being of older adults. While we keep adding increasing years to life we must ensure that these years are spent in good health as far as possible, thereby keeping this burgeoning section of the population healthier and with preserved well-being.
Supplementary Material
Figure 3.

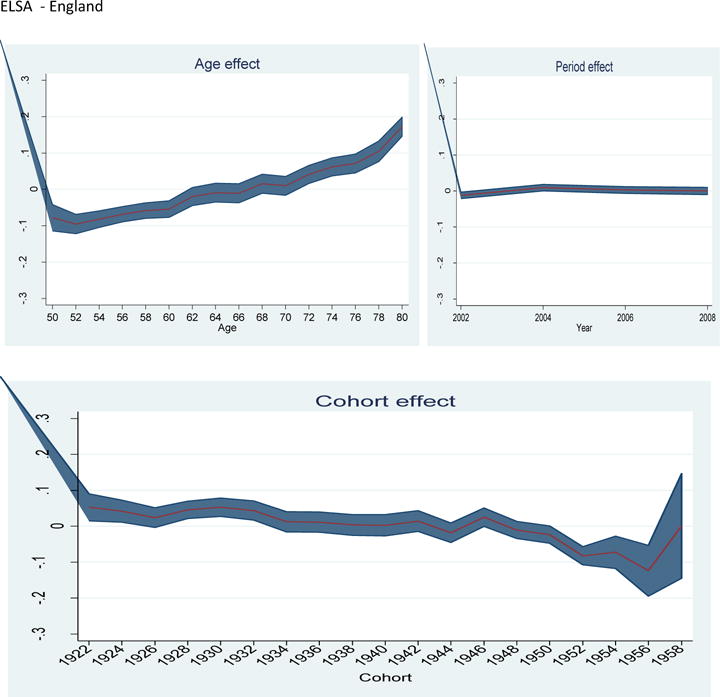
Age-period-cohort effects for ADL limitations by survey (54–56)
Figure 4.

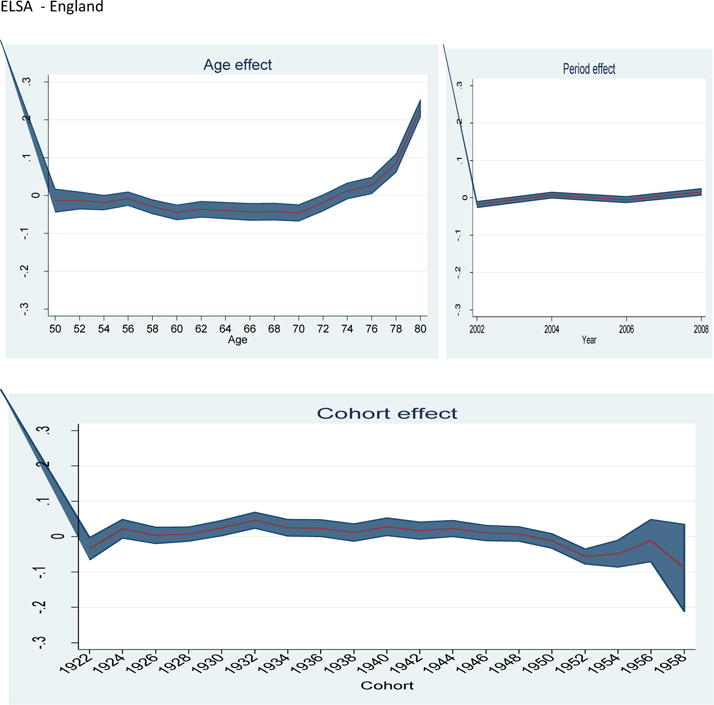
Age-period-cohort effects for IADL limitations by survey (54–56)
Key Messages.
Populations are rapidly ageing worldwide with major implications for health systems. This is more so in low and middle countries
A key question, is will older generations be healthier than those that have preceded them. In other words will we be adding life to years as populations age by ensuring maintained functioning and well-being.
In high income countries there is some evidence that a compression of morbidity is taking place as seen from trends of functioning and disability status. However, uncertainty remains about the health of future older generations given different risk factor exposures in different cohorts and trends in increases in the prevalence of chronic diseases.
In low and middle countries there is currently no reliable evidence of compression and there may even be an expansion of morbidity happening driven by lifestyle risk factors and increasing chronic diseases.
Given the paucity of data, robust evidence needs to be generated on these trends to ensure an appropriate response from health and social systems.
Acknowledgments
The authors would like to thank Linda Martin for valuable comments on an earlier version of this manuscript and Nicole Bergen for research assistance. The authors would also like to thank Ties Boerma for valuable comments on drafts of this manuscript.
Funding sources
This study was supported by the United States National Institute on Aging’s Division of Behavioral and Social Research through Interagency Agreements (OGHA 04034785; YA1323-08-CN-0020; Y1-AG-1005-01) and through research grants (R01-AG034479 and R21-AG034263). The views expressed by Chatterji and Verdes are those of the authors alone and not necessarily those of the World Health Organization.
Reference List
- 1.United Nations Department of Economic and Social Affairs Population Division. World Population Ageing 2013. New York: 2013. [Google Scholar]
- 2.Crimmins EM, Beltran-Sanchez H. Mortality and morbidity trends: is there compression of morbidity? J Gerontol B Psychol Sci Soc Sci. 2011 Jan;66(1):75–86. doi: 10.1093/geronb/gbq088. [DOI] [PMC free article] [PubMed] [Google Scholar]
- 3.Fries JF. Measuring and monitoring success in compressing morbidity. Ann Intern Med. 2003 Sep 2;139(5 Pt 2):455–9. doi: 10.7326/0003-4819-139-5_part_2-200309021-00015. [DOI] [PubMed] [Google Scholar]
- 4.Gruenberg EM. The failures of success. Milbank Mem Fund Q Health Soc. 1977;55(1):3–24. [PubMed] [Google Scholar]
- 5.Salomon JA, Wang H, Freeman MK, Vos T, Flaxman AD, Lopez AD, et al. Healthy life expectancy for 187 countries, 1990–2010: a systematic analysis for the Global Burden Disease Study 2010. Lancet. 2012 Dec 15;380(9859):2144–62. doi: 10.1016/S0140-6736(12)61690-0. [DOI] [PubMed] [Google Scholar]
- 6.Manton KG. Changing concepts of morbidity and mortality in the elderly population. Milbank Mem Fund Q Health Soc. 1982;60(2):183–244. [PubMed] [Google Scholar]
- 7.Perenboom RJ, van Herten LM, Boshuizen HC, van den Bos GA. Trends in disability-free life expectancy. Disabil Rehabil. 2004 Apr 8;26(7):377–86. doi: 10.1080/0963828032000174098. [DOI] [PubMed] [Google Scholar]
- 8.Crimmins EM, Hayward MD, Hagedorn A, Saito Y, Brouard N. Change in disability-free life expectancy for Americans 70-years-old and older. Demography. 2009 Aug;46(3):627–46. doi: 10.1353/dem.0.0070. [DOI] [PMC free article] [PubMed] [Google Scholar]
- 9.Christensen K, Doblhammer G, Rau R, Vaupel JW. Ageing populations: the challenges ahead. Lancet. 2009 Oct 3;374(9696):1196–208. doi: 10.1016/S0140-6736(09)61460-4. [DOI] [PMC free article] [PubMed] [Google Scholar]
- 10.Crimmins EM. Trends in the health of the elderly. Annu Rev Public Health. 2004;25:79–98. doi: 10.1146/annurev.publhealth.25.102802.124401. [DOI] [PubMed] [Google Scholar]
- 11.Schoeni RF, Freedman VA, Wallace RB. Persistent, consistent, widespread, and robust? Another look at recent trends in old-age disability. J Gerontol B Psychol Sci Soc Sci. 2001 Jul;56(4):S206–S218. doi: 10.1093/geronb/56.4.s206. [DOI] [PubMed] [Google Scholar]
- 12.Jacobzone S. Coping with aging: international challenges. Health Aff (Millwood) 2000 May;19(3):213–25. doi: 10.1377/hlthaff.19.3.213. [DOI] [PubMed] [Google Scholar]
- 13.Payne G, Laporte A, Deber R, Coyte PC. Counting backward to health care’s future: using time-to-death modeling to identify changes in end-of-life morbidity and the impact of aging on health care expenditures. Milbank Q. 2007 Jun;85(2):213–57. doi: 10.1111/j.1468-0009.2007.00485.x. [DOI] [PMC free article] [PubMed] [Google Scholar]
- 14.Crimmins EM, Saito Y. Change in the Prevalence of Diseases among Older Americans: 1984–1994. Demographic Research. 2000;3(9) [Google Scholar]
- 15.Freedman VA, Martin LG. Contribution of chronic conditions to aggregate changes in old-age functioning. Am J Public Health. 2000 Nov;90(11):1755–60. doi: 10.2105/ajph.90.11.1755. [DOI] [PMC free article] [PubMed] [Google Scholar]
- 16.Freedman VA, Schoeni RF, Martin LG, Cornman JC. Chronic conditions and the decline in late-life disability. Demography. 2007 Aug;44(3):459–77. doi: 10.1353/dem.2007.0026. [DOI] [PubMed] [Google Scholar]
- 17.Cutler DM. Declining disability among the elderly. Health Aff (Millwood) 2001 Nov;20(6):11–27. doi: 10.1377/hlthaff.20.6.11. [DOI] [PubMed] [Google Scholar]
- 18.Crimmins EM, Reynolds SL, Saito Y. Trends in health and ability to work among the older working-age population. J Gerontol B Psychol Sci Soc Sci. 1999 Jan;54(1):S31–S40. doi: 10.1093/geronb/54b.1.s31. [DOI] [PubMed] [Google Scholar]
- 19.Diczfalusy E. The third age, the Third World and the third millennium. Contraception. 1996 Jan;53(1):1–7. doi: 10.1016/0010-7824(95)00258-8. [DOI] [PubMed] [Google Scholar]
- 20.World Health Organization. International classification of functioning, disability, and health. Geneva: World Health Organization; 2006. [Google Scholar]
- 21.Moussavi S, Chatterji S, Verdes E, Tandon A, Patel V, Ustun B. Depression, chronic diseases, and decrements in health: results from the World Health Surveys. Lancet. 2007 Sep 8;370(9590):851–8. doi: 10.1016/S0140-6736(07)61415-9. [DOI] [PubMed] [Google Scholar]
- 22.Salomon JA, Murray CJ, Ustun T, Chatterji S. Health state valuations in summary measures of population health. In: Murray CJ, Evans D, editors. Health System Performance Assessment: Debates, Methods and Empiricism. Geneva: World Health Organization; 2003. [Google Scholar]
- 23.Salomon JA, Mathers CD, Chatterji S, Sadana R, Ustun T, Murray CJ. Quantifying individual levels of health: definitions, concepts and measurement issues. In: Murray CJ, Evans D, editors. Health Systems Performance Assessment: Debates, Methods and Empiricism. Geneva: World Health Organization; 2003. [Google Scholar]
- 24.United Nations Economic Commission for Europe. Survey module for measuring health state. New York and Geneva: United Nations; 2012. [Google Scholar]
- 25.Wilson M, Allen DD, Li JC. Improving measurement in health education and health behavior research using item response modeling: introducing item response modeling. Health Educ Res. 2006 Dec 21;(Suppl 1):i4–18. doi: 10.1093/her/cyl108. [DOI] [PubMed] [Google Scholar]
- 26.Murray CJ, Ozaltin E, Tandon A, Salomon JA, Sadana R, Chatterji S. Empirical evaluation of the anchoring vignette approach in health surveys. In: Murray CJ, Evans D, editors. Health System Performance Assessment: Debates, Methods and Empiricism. Geneva: World Health Organization; 2003. [Google Scholar]
- 27.Cambois E, Clavel A, Romieu I, Robine JM. Trends in disability-free life expectancy at age 65 in France: consistent and diverging patterns according to the underlying disability measure. European Journal of Ageing. 2008;5(4):287–98. doi: 10.1007/s10433-008-0097-1. [DOI] [PMC free article] [PubMed] [Google Scholar]
- 28.Manton KG, Gu X, Lowrimore GR. Cohort changes in active life expectancy in the U.S. elderly population: experience from the 1982–2004 National Long-Term Care Survey. J Gerontol B Psychol Sci Soc Sci. 2008 Sep;63(5):S269–S281. doi: 10.1093/geronb/63.5.s269. [DOI] [PubMed] [Google Scholar]
- 29.Moe JO, Hagen TP. Trends and variation in mild disability and functional limitations among older adults in Norway, 1986–2008. Eur J Ageing. 2011 Mar;8(1):49–61. doi: 10.1007/s10433-011-0179-3. [DOI] [PMC free article] [PubMed] [Google Scholar]
- 30.Pinheiro P, Kramer A. Calculation of health expectancies with administrative data for North Rhine-Westphalia, a Federal State of Germany, 1999–2005. Popul Health Metr. 2009;7:4. doi: 10.1186/1478-7954-7-4. [DOI] [PMC free article] [PubMed] [Google Scholar]
- 31.Sagardui-Villamor J, Guallar-Castillon P, Garcia-Ferruelo M, Banegas JR, Rodriguez-Artalejo F. Trends in disability and disability-free life expectancy among elderly people in Spain: 1986–1999. Journals of Gerontology Series A, Biological Sciences and Medical Sciences. 2005;60(8):1028–34. doi: 10.1093/gerona/60.8.1028. [DOI] [PubMed] [Google Scholar]
- 32.Van Oyen H, Cox B, Demarest S, Deboosere P, Lorant V. Trends in health expectancy indicators in the older adult population in Belgium between 1997 and 2004. European Journal of Ageing. 2008;5:137–46. doi: 10.1007/s10433-008-0082-8. [DOI] [PMC free article] [PubMed] [Google Scholar]
- 33.Hashimoto S, Kawado M, Seko R, Murakami Y, Hayashi M, Kato M, et al. Trends in disability-free life expectancy in Japan, 1995–2004. J Epidemiol. 2010;20(4):308–12. doi: 10.2188/jea.JE20090190. [DOI] [PMC free article] [PubMed] [Google Scholar]
- 34.Kelly S, Baker A. Healthy life expectancy in Great Britain 1980–96 and its use as an indicator in United Kingdom government strategies. Health Statistics Quarterly. 2000:32–7. [Google Scholar]
- 35.Lynch C, Holman CD, Moorin RE. Use of Western Australian linked hospital morbidity and mortality data to explore theories of compression, expansion and dynamic equilibrium. Aust Health Rev. 2007 Nov;31(4):571–81. doi: 10.1071/ah070571. [DOI] [PubMed] [Google Scholar]
- 36.Perenboom RJ, van Herten LM, Boshuizen HC, van den Bos GA. Life expectancy without chronic morbidity: trends in gender and socioeconomic disparities. Public Health Rep. 2005 Jan;120(1):46–54. doi: 10.1177/003335490512000109. [DOI] [PMC free article] [PubMed] [Google Scholar]
- 37.Breakwell C, Bajekal M. Health expectancies in the UK and its constituent countries, 2001. Health Stat Q. 2005;(29):18–25. [PubMed] [Google Scholar]
- 38.Verdecchia A, Mariotto A, Capocaccia R, Gatta G, Micheli A, Sant M, et al. Incidence and prevalence of all cancerous diseases in Italy: trends and implications. European Journal of Cancer. 2001;37(9):1149–57. doi: 10.1016/s0959-8049(01)00094-6. [DOI] [PubMed] [Google Scholar]
- 39.Cai L, Lubitz J. Was there compression of disability for older Americans from 1992 to 2003? Demography. 2007 Aug;44(3):479–95. doi: 10.1353/dem.2007.0022. [DOI] [PubMed] [Google Scholar]
- 40.Graham P, Blakely T, Davis P, Sporle A, Pearce N. Compression, expansion, or dynamic equilibrium? The evolution of health expectancy in New Zealand. J Epidemiol Community Health. 2004 Aug;58(8):659–66. doi: 10.1136/jech.2003.014910. [DOI] [PMC free article] [PubMed] [Google Scholar]
- 41.Jeune B, Bronnum-Hansen H. Trends in health expectancy at age 65 for various health indicators, 1987–2005, Denmark. European Journal of Ageing. 2008;5:279–85. doi: 10.1007/s10433-008-0100-x. [DOI] [PMC free article] [PubMed] [Google Scholar]
- 42.Liu J, Chen G, Song X, Chi I, Zheng X. Trends in disability-free life expectancy among Chinese older adults. J Aging Health. 2009 Mar;21(2):266–85. doi: 10.1177/0898264308328978. [DOI] [PubMed] [Google Scholar]
- 43.Bronnum-Hansen H. Trends in health expectancy in Denmark, 1987–1994. DMB, Danish Medical Bulletin. 1998;45(2):217–21. [PubMed] [Google Scholar]
- 44.Gu DN, Dupre ME, Warner DF, Zeng Y. Changing health status and health expectancies among older adults in China: gender differences from 1992 to 2002. Social Science & Medicine. 2009;68(12):2170–9. doi: 10.1016/j.socscimed.2009.03.031. [DOI] [PMC free article] [PubMed] [Google Scholar]
- 45.Jang SN, Kim DH. Trends in the health status of older Koreans. J Am Geriatr Soc. 2010 Mar;58(3):592–8. doi: 10.1111/j.1532-5415.2010.02744.x. [DOI] [PubMed] [Google Scholar]
- 46.Parker MG, Schön P, Lagergren M, Thorslund M. Functional ability in the elderly Swedish population from 1980 to 2005. European Journal of Ageing. 2008;5:299–309. doi: 10.1007/s10433-008-0096-2. [DOI] [PMC free article] [PubMed] [Google Scholar]
- 47.Bronnum-Hansen H. Health expectancy in Denmark, 1987–2000. European Journal of Public Health. 2005;15(1):20–5. doi: 10.1093/eurpub/cki106. [DOI] [PubMed] [Google Scholar]
- 48.Fang XH, Zimmer Z, Kaneda T, Tang Z, Xiang MJ. Stroke and active life expectancy among older adults in Beijing, China. Disabil Rehabil. 2009;31(9):701–11. doi: 10.1080/09638280802305945. [DOI] [PubMed] [Google Scholar]
- 49.Report: Health expectancies in the UK, 2002. Health Stat Q. 2006;(29):59–62. [PubMed] [Google Scholar]
- 50.Schoeni RF, Liang J, Bennett J, Sugisawa H, Fukaya T, Kobayashi E. Trends in old-age functioning and disability in Japan, 1993–2002. Popul Stud (Camb) 2006 Mar;60(1):39–53. doi: 10.1080/00324720500462280. [DOI] [PubMed] [Google Scholar]
- 51.Martin LG, Zimmer Z, Hurng BS. Trends in late-life disability in Taiwan, 1989–2007: the roles of education, environment, and technology. Popul Stud (Camb) 2011 Nov;65(3):289–304. doi: 10.1080/00324728.2011.604730. [DOI] [PMC free article] [PubMed] [Google Scholar]
- 52.Reither EN, Olshansky SJ, Yang Y. New forecasting methodology indicates more disease and earlier mortality ahead for today’s younger Americans. Health Aff (Millwood) 2011 Aug;30(8):1562–8. doi: 10.1377/hlthaff.2011.0092. [DOI] [PMC free article] [PubMed] [Google Scholar]
- 53.Langa KM, Larson EB, Karlawish JH, Cutler DM, Kabeto MU, Kim SY, et al. Trends in the prevalence and mortality of cognitive impairment in the United States: is there evidence of a compression of cognitive morbidity? Alzheimers Dement. 2008 Mar;4(2):134–44. doi: 10.1016/j.jalz.2008.01.001. [DOI] [PMC free article] [PubMed] [Google Scholar]
- 54.SHARE-Survey of Health, Ageing and Retirement in Europe. 2014 http://www.share-project.org/ Ref Type: Online Source.
- 55.HRS-Health and Retirement Study. 2014 www.hrsonline.isr.umich.edu. Ref Type: Online Source.
- 56.ELSA- English Longitudinal Study of Ageing. 2014 http://www.elsa-project.ac.uk/ Ref Type: Online Source.
- 57.Prince M, Ferri CP, Acosta D, Albanese E, Arizaga R, Dewey M, et al. The protocols for the 10/66 dementia research group population-based research programme. BMC Public Health. 2007;7:165. doi: 10.1186/1471-2458-7-165. [DOI] [PMC free article] [PubMed] [Google Scholar]
- 58.Parker MG, Thorslund M. Health trends in the elderly population: getting better and getting worse. Gerontologist. 2007 Apr;47(2):150–8. doi: 10.1093/geront/47.2.150. [DOI] [PubMed] [Google Scholar]
- 59.Freedman VA, Martin LG, Schoeni RF. Recent trends in disability and functioning among older adults in the United States: a systematic review. JAMA. 2002 Dec 25;288(24):3137–46. doi: 10.1001/jama.288.24.3137. [DOI] [PubMed] [Google Scholar]
- 60.Crimmins EM, Saito Y. Trends in healthy life expectancy in the United States, 1970–1990: gender, racial, and educational differences. Soc Sci Med. 2001 Jun;52(11):1629–41. doi: 10.1016/s0277-9536(00)00273-2. [DOI] [PubMed] [Google Scholar]
- 61.Barendregt JJ, Bonneux L, van der Maas PJ. Health expectancy: an indicator for change? Technology Assessment Methods Project Team. J Epidemiol Community Health. 1994 Oct;48(5):482–7. doi: 10.1136/jech.48.5.482. [DOI] [PMC free article] [PubMed] [Google Scholar]
- 62.Mathers CD, Robine JM. How good is Sullivan’s method for monitoring changes in population health expectancies? J Epidemiol Community Health. 1997 Feb;51(1):80–6. doi: 10.1136/jech.51.1.80. [DOI] [PMC free article] [PubMed] [Google Scholar]
- 63.Manton KG. Dynamic paradigms for human mortality and aging. J Gerontol A Biol Sci Med Sci. 1999 Jun;54(6):B247–B254. doi: 10.1093/gerona/54.6.b247. [DOI] [PubMed] [Google Scholar]
- 64.Hubert HB, Bloch DA, Oehlert JW, Fries JF. Lifestyle habits and compression of morbidity. J Gerontol A Biol Sci Med Sci. 2002 Jun;57(6):M347–M351. doi: 10.1093/gerona/57.6.m347. [DOI] [PubMed] [Google Scholar]
- 65.Vita AJ, Terry RB, Hubert HB, Fries JF. Aging, health risks, and cumulative disability. N Engl J Med. 1998 Apr 9;338(15):1035–41. doi: 10.1056/NEJM199804093381506. [DOI] [PubMed] [Google Scholar]
- 66.Hosseinpoor AR, Williams JS, Jann B, Kowal P, Officer A, Posarac A, et al. Social determinants of sex differences in disability among older adults: a multi-country decomposition analysis using the World Health Survey. Int J Equity Health. 2012;11:52. doi: 10.1186/1475-9276-11-52. [DOI] [PMC free article] [PubMed] [Google Scholar]
- 67.Freedman VA, Soldo BJ, editors. Trends in disability at older ages: summary of a workshop. Washington DC: National Academy Press; 1994. Trends in Disability; pp. 2–19. [PubMed] [Google Scholar]
- 68.Jylha M, Guralnik JM, Ferrucci L, Jokela J, Heikkinen E. Is self-rated health comparable across cultures and genders? J Gerontol B Psychol Sci Soc Sci. 1998 May;53(3):S144–S152. doi: 10.1093/geronb/53b.3.s144. [DOI] [PubMed] [Google Scholar]
- 69.World Health Organization. WHO strategy on people-centred and integrated health services Draft for Consultation. Geneva: World Health Organization; 2014. [Google Scholar]
Associated Data
This section collects any data citations, data availability statements, or supplementary materials included in this article.