

Abstract
Objective
Obesity is a state of chronic inflammation that is associated with insulin resistance and type 2 diabetes mellitus (DM), as well as an increased risk of osteoarthritis (OA). This study was undertaken to define the links between obesity‐associated inflammation, insulin resistance, and OA, by testing the hypotheses that 1) tumor necrosis factor (TNF) is critical in mediating these pathologic changes in OA, and 2) insulin has direct effects on the synovial joint that are compromised by insulin resistance.
Methods
The effects of TNF and insulin on catabolic gene expression were determined in fibroblast‐like synoviocytes (FLS) isolated from human OA synovium. Synovial TNF expression and OA progression were examined in 2 mouse models, high‐fat (HF) diet–fed obese mice with type 2 DM and TNF‐knockout mice. Insulin resistance was investigated in synovium from patients with type 2 DM.
Results
Insulin receptors (IRs) were abundant in both mouse and human synovial membranes. Human OA FLS were insulin responsive, as indicated by the dose‐dependent phosphorylation of IRs and Akt. In cultures of human OA FLS with exogenous TNF, the expression and release of MMP1, MMP13, and ADAMTS4 by FLS were markedly increased, whereas after treatment with insulin, these effects were selectively inhibited by >50%. The expression of TNF and its abundance in the synovium were elevated in samples from obese mice with type 2 DM. In TNF‐knockout mice, increases in osteophyte formation and synovial hyperplasia associated with the HF diet were blunted. The synovium from OA patients with type 2 DM contained markedly more macrophages and showed elevated TNF levels as compared to the synovium from OA patients without diabetes. Moreover, insulin‐dependent phosphorylation of IRs and Akt was blunted in cultures of OA FLS from patients with type 2 DM.
Conclusion
TNF appears to be involved in mediating the advanced progression of OA seen in type 2 DM. While insulin plays a protective, antiinflammatory role in the synovium, insulin resistance in patients with type 2 DM may impair this protective effect and promote the progression of OA.
Osteoarthritis (OA), the most common form of arthritis, is projected to affect more than 67 million Americans by 2030 1 and is one of the leading causes of physical disability 2. Among various risk factors, obesity is recognized as a major risk factor for OA. Historically, it has been proposed that increased joint loading associated with obesity will cause cartilage damage, leading to OA 3, 4. However, the association between obesity and OA in the non–load‐bearing joints suggests that systemic factors associated with obesity, such as chronic systemic inflammation or insulin resistance related to the metabolic syndrome, may contribute considerably to the initiation and progression of OA 5, 6.
Correlations between common parameters of diabetes (hyperglycemia, hyperinsulinemia) and OA have been observed 5, 6, 7, 8. Analysis of the data from the US Third National Health and Nutrition Examination Survey demonstrated that each component of the metabolic syndrome was more prevalent in the OA population 9. Similar results were derived from the Japanese Research on Osteoarthritis Against Disability study 10. Karvonen‐Gutierrez et al 11, in a study using the NHANES data, reported that insulin resistance was a strong risk factor for osteophyte‐defined knee OA, regardless of body mass. Interestingly, this association was found only in men, supporting a sex‐specific difference in the association between metabolic syndrome factors and OA. Similarly, Eymard et al 12 found that type 2 diabetes mellitus (DM) was a predictor of joint space narrowing only in men with knee OA. The Netherlands Epidemiology of Obesity study demonstrated that several parameters of obesity were associated with hand OA, but visceral adipose tissue was associated with OA in men only 13. Although the cause of these between‐sex differences is currently unknown, it has been suggested that the contributing factors may include an increased prevalence of distal neuropathy and greater visceral adiposity in men. Moreover, being overweight in childhood may predispose men to knee pain in adulthood 14. Interestingly, a 10% decrease in body weight is associated with a 50% decrease in the risk of symptomatic OA 15. It may not be unrelated that a 10% weight loss also markedly improves insulin sensitivity in obese, insulin‐resistant patients 16. Despite the scope of the clinical problem, the mechanism by which metabolic dysfunction in obesity impacts the initiation and progression of OA is under‐investigated and as yet unknown.
Using a classic mouse model of obesity‐associated type 2 DM, we recently observed an accelerated progression of posttraumatic OA in association with high‐fat (HF) diet–induced obesity, glucose intolerance, and insulin resistance in mice 17. This effect was not linked to increased body weight, but rather was associated with the altered metabolic state resulting from the HF diet and the development of type 2 DM 17. HF diet–fed mice displayed loss of cartilage thickness, larger osteophytes, and hyperplastic synovium, and therefore these findings could establish a critical link between metabolic dysfunction and OA initiation and progression following joint trauma.
Equally important, HF diet–fed mice presented early OA changes in the uninjured knee joint, including formation of osteophytes adjacent and proximal to the hyperplastic synovium. These changes in the uninjured knees of obese mice with type 2 DM are a possible tissue response to the systemic factors associated with the metabolic dysfunction. Recently, Gierman et al 18 reported that an increase in OA progression in mice being fed an HF diet showed no correlation with increased body weight. Griffin et al 19 also recently reported that increased joint loading could not explain the observed increase in incidence of OA in mice receiving an HF diet. Brunner et al 20 suggested that high dietary fat, independent of weight and associated mechanical stress, appeared to be a risk factor for the development of OA in a rabbit model. These studies support the hypothesis that metabolic dysfunction and inflammation both make a critical contribution to increased OA progression in HF diet–associated obesity and type 2 DM.
Although the pathogenesis of OA is not fully understood, some aspects of the molecular mechanism of cartilage breakdown are generally accepted. Degradation of type II collagen and proteoglycan, the main components of the cartilage extracellular matrix, is mediated by collagenases and aggrecanases secreted by both synoviocytes and chondrocytes 2. The expression of these proteinases is up‐regulated by proinflammatory cytokines such as interleukin‐1β (IL‐1β) and tumor necrosis factor (TNF) 21, 22. Importantly, it is established that obesity/type 2 DM is a state of chronic inflammation, with the metabolic dysfunction of this condition being caused, in part, by the presence of inflammation, and with TNF playing a major role 23, 24. Thus, in the present study, we tested the hypothesis that obesity/type 2 DM is an inducer of OA via the effects of TNF‐associated inflammation on fibroblast‐like synoviocytes (FLS). The findings indicated that TNF contributes to HF diet–associated OA progression in mice, and that human OA FLS are target cells of insulin, with insulin playing a protective role in the joint by, at least in part, suppressing the TNF‐induced expression of OA‐associated cartilage catabolic genes. Consistent with this, we discovered insulin resistance in the synovium from OA patients with type 2 DM, providing the first evidence of a clinical connection between synovial insulin resistance and joint degeneration. These results support the novel concept that the development of OA in individuals with obesity/type 2 DM is a distinct pathophysiologic process that is driven by TNF and synovial insulin resistance.
MATERIALS AND METHODS
Clinical samples
All human tissue samples were obtained following each subject's provision of written informed consent, and all experimental studies with human tissue were performed using a protocol approved by the Institutional Review Board of the University of Rochester. For isolation of human FLS, synovial tissue samples were obtained from 4 OA patients without diabetes (2 men and 2 women, ages 56–87 years) who had been diagnosed as having OA and had undergone total knee arthroplasty. The mean ± SD body mass index (BMI) of these subjects was 31.8 ± 4.1 kg/m2 (range 27.8–37.7), and the fasting glucose level was 87.8 ± 11.0 mg/dl (range 72–97).
For analyses of insulin signaling, synovial biopsy tissue was obtained at the time of arthroplasty from 7 OA patients with type 2 DM (3 men and 4 women; mean ± SD age 63.3 ± 5.8 years, range 52–76 years) and 6 OA patients without diabetes (1 man and 5 women; mean ± SD age 62.3 ± 7.7 years, range 49–84 years). In OA patients with type 2 DM, the mean ± SD glycosylated hemoglobin (HbA1c) level was 6.6 ± 0.4% (range 5.8–7.0%) and the mean ± SD BMI was 33.6 ± 4.5 kg/m2. In OA patients without diabetes, the HbA1c level was 5.1 ± 0.3% (range 4.5–5.5%) and the BMI was 32.7 ± 4.9 kg/m2. Four of the 7 patients with type 2 DM were receiving treatment with metformin at the time of surgery, with 1 of these patients taking more than one drug (liraglutide and glimepiride).
Animals
Diet
All handling of the mice and associated experimental animal procedures were reviewed and approved by the Committee on Animal Resources of the University of Rochester. Male C57BL/6J mice and TNF‐knockout mice (B6;129S‐Tnf tm1Gkl/J), all purchased from The Jackson Laboratory, were housed (5 mice per micro‐isolator cage) in a room on a 12‐hour light/dark cycle. The mice, at age 5 weeks, were placed on either an HF diet (60% kcal, D12492) or a low‐fat diet as control (10% kcal, D12450B) (Open Source Diets; Research Diets Inc.). Knee OA phenotypes were evaluated in the mice after administration of the diet for 24 weeks.
Metabolic characterization
Mice were placed on a fasting regimen for 6 hours and then anesthetized with 5% isoflurane, and the body weight was measured. To obtain baseline glucose levels, tail‐vein blood was sampled using a commercially available glucometer (One Touch Ultra; Lifescan). Following administration of a glucose bolus (300 mg/kg intraperitoneally), glucose levels were measured immediately postinjection and at 15, 30, 60, 90, and 120 minutes postinjection, with isoflurane used at each time point to provide anesthesia for each blood sampling. To quantify the metabolic status, the net area under the curve was calculated using GraphPad Prism software (version 4), based on the curve of glucose levels on the glucose tolerance test in each mouse.
Immunohistochemistry
For immunohistochemical analyses of human and mouse synovial tissue, an avidin–biotin–peroxidase system (Vector) was used, as described previously 22, to detect 2 primary antibodies: an anti–insulin receptor (anti‐IR) rabbit polyclonal antibody and anti‐TNF goat polyclonal antibody (sc‐711 and sc‐13550, respectively; Santa Cruz Biotechnology). Reactions were visualized using diaminobenzidine (Vector) as substrate. Tissue sections were counterstained with hematoxylin.
Immunofluorescence analysis
Two primary antibodies, an anti‐CD14 rabbit monoclonal antibody (ab183322; Abcam) and anti‐CD68 mouse monoclonal antibody (GTX73723; GeneTex), were used to detect monocytes and macrophages in human synovial tissue. Fluorescent Cy3‐conjugated AffiniPure donkey anti‐rabbit IgG (heavy and light chains) and fluorescein isothiocyanate–conjugated AffiniPure donkey anti‐mouse IgG (heavy and light chains) (711‐165‐152 and 715‐095‐150, respectively; Jackson ImmunoResearch) were used to detect the primary antibodies. Sections were then mounted with ProLong Gold antifade reagent with DAPI (P3691; Life Technologies) for detection of monocytes and macrophages by fluorescence microscopy.
Immunoprecipitation and Western blot analysis
Cell protein lysates were harvested from synovial tissue samples, and IRs were immunoprecipitated with anti‐IRβ (sc‐711; Santa Cruz Biotechnology) as previously described 25. Phosphorylation of the immunoprecipitated IRs was assessed by Western blotting using an antibody against IRβ phosphotyrosine (05‐321; EMD Millipore). In addition, direct tissue lysates were assessed by Western blotting for phosphorylation of IRβ (3024; Cell Signaling Technology), IRβ subunit (sc‐711; Santa Cruz Biotechnology), the Ser473‐phosphorylated form of Akt (4060; Cell Signaling Technology), and total Akt (9272; Cell Signaling Technology).
Harvesting of mouse tissue and histologic analysis of OA progression
The isolation and processing of mouse knees for histologic analysis were performed as described previously 17. Each diet group contained 5–8 mice per group. For histomorphometric analyses, 3 sagittal sections from the knee joints of mice in each diet group were stained with Alcian blue and hematoxylin. Osteophytes were measured using OsteoMeasure software (OsteoMetrics). Histologic scores of the synovial tissue from each section were also obtained, with the score representing the degree of synovial hyperplasia (i.e., thickness and cellularity of the synovial membrane). A subjective scoring system of 0–2 was used, in which 0 = a synovial lining that is several (2–3) cell layers thick or <10 μm thick (normal), 1 = synovial thickening with a lining cell layer between 5 and 10 cells thick or between 10 μm and 20 μm thick, and 2 = severe thickening of the synovial lining with a lining cell layer >10 cells thick and/or >20 μm thick. Results were normalized to the values in low‐fat diet–fed lean control mice (set at 1.0). Synovial histologic scoring was performed in a blinded manner by 4 independent observers (ES, JHS, MJZ, and RAM).
Isolation and culture of human OA FLS
Human synovium was minced and incubated with 1 mg/ml of type II collagenase (Worthington Biochemical) in serum‐free, standard Dulbecco's modified Eagle's medium (DMEM; Gibco) containing 1 gm/liter glucose, for 2 hours at 37°C. Isolated cells were filtered through a 70‐μm filter, extensively washed, and cultured in DMEM supplemented with 10% fetal bovine serum (Sigma‐Aldrich). Adherent FLS were passaged (at a 1:3 split) at 80–90% confluency, with cells between passages 4 and 7 used in the experiments. Cells at passage 4 were analyzed by flow cytometry, with the results showing that the cell population contained <1% CD14+ or CD123+ monocytes or macrophages, and <1% CD45+ leukocytes.
Treatment of human OA FLS with proinflammatory cytokines and insulin
FLS were serum‐starved overnight prior to proinflammatory cytokine and insulin treatments. For the study of insulin signaling, cells were treated with doses of insulin between 1 nM and 100 nM (Sigma‐Aldrich) for 5 minutes. Cells were lysed and proteins were isolated by sodium dodecyl sulfate–polyacrylamide gel electrophoresis for Western blotting. For the assessment of MMP1 and MMP13 released into the medium, aliquots of medium for sodium dodecyl sulfate–polyacrylamide gel electrophoresis were normalized to cell numbers in the dishes from which the medium was recovered. For analyses of gene expression following cytokine treatment, the cells were treated for 24 hours with different concentrations of TNF (0, 1, 3, 10, or 30 ng/ml) and insulin (0, 1, or 100 nM). At all time points, cell viability was >90%.
Quantitative reverse transcription–polymerase chain reaction (qRT‐PCR)
Total RNA was extracted from human OA FLS using an RNeasy Plus Mini kit (Qiagen). Synovial capsule RNA was isolated according to the method described by Van Meurs et al 26. Briefly, skeletal muscle was dissected away from the knee joint of the mouse. The patellar ligament was cut close to the tibia. This incision was extended both medially and laterally to join at the posterior of the knee. The incision was then extended both medially and laterally to join at the top of the patellar plate. The triangular wedge of the synovial capsule was recovered. The patellar plate, patella, and patellar ligament were dissected and removed, yielding medial and lateral segments of the synovial capsule. This tissue was homogenized, total RNA was extracted, and qRT‐PCR was performed as described previously 27. The housekeeping gene used for the mouse studies was Gapdh, and that used for the human FLS studies was YWHAZ (encoding 14‐3‐3 protein ζ/δ).
Analysis of insulin signaling in human synovial biopsy tissue
Human synovium was harvested from OA patients during total knee arthroplasty, from the suprapatellar pouch of the knee joint adjacent to the femoral articular surface, and the samples were placed in saline on ice. After fat and scar tissue were removed, a scalpel was used to scrape and recover the synovial lining from the surgical sample. This isolated tissue was then washed in saline and placed in serum‐free DMEM at 37°C. Insulin was added (1 or 10 nM) for 5 minutes. Samples were recovered, washed in saline, and added to lysis buffer (50 mM Tris, 140 mM NaCl, 50 mM NaF, 1% Triton X‐100, 10% glycerol, protease inhibitor cocktail [Roche], and 2.0 mM Na3VO4). Protein content was measured using the Bradford method (ThermoScience).
Assessment of IR signaling was performed using Western blotting, as described above. Quantitation was performed using chemiluminescence imaging (ThermoScience) and a ChemiDoc XRS+ System with Image Lab software (version 5.1; Bio‐Rad).
Statistical analysis
All experiments with human FLS were performed using cell lines generated from 3 different patient samples, each line being used in 3 separate experiments and with samples from each experiment assayed in triplicate. In the mouse experiments and analyses of human synovial tissue explants, the number of animals or samples used per group varied, and different statistical tests were used (either one‐way or two‐way analysis of variance with applicable post hoc tests or t‐tests). For differences between groups and between condition effects, P values less than 0.05 were considered significant.
RESULTS
Expression of IRs in the synovial membrane
It is not known whether insulin has a direct and physiologically important effect on the synovial joint. Results from immunohistochemical analysis of the synovial membrane of mice indicated that IRs were strongly expressed in the synovium, with detectable expression in mouse articular chondrocytes as well (Figures 1A and B). Human synovium obtained from OA patients undergoing total knee arthroplasty also displayed strong expression of IRs (Figure 1C).
Figure 1.
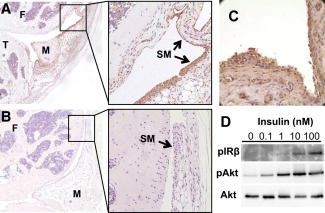
Insulin receptors (IRs) are expressed in mouse and human synovium and are functional in human fibroblast‐like synoviocytes (FLS). A and B, Immunohistochemical staining demonstrates abundance of IRs in a representative knee joint section from a C57BL/6 mouse (A), in contrast to a representative knee joint section used as negative control (no primary antibody) (B). Boxed areas in left panels are displayed at higher magnification in right panels. Original magnification × 50 in left panels; × 200 in right panels. C, Immunohistochemical staining demonstrates abundant expression of IRs in human synovium obtained from a patient with osteoarthritis (OA) undergoing total knee arthroplasty. Original magnification × 200. D, Isolated human OA FLS were treated without or with insulin at various concentrations for 5 minutes. IRβ autophosphorylation and phosphorylation of Akt (Ser473) were assessed by Western blotting in immunoprecipitates and lysates, respectively. F = femur; T = tibia; M = meniscus; SM = synovial membrane.
Treatment of human OA FLS with insulin induced a dose‐dependent increase in IR autophosphorylation, as well as an increase in the phosphorylation of the central signaling mediator of insulin action, the serine kinase Akt (Figure 1D). Importantly, phosphorylation of Akt was observed following the administration of physiologically relevant levels of insulin, in doses ranging from 0.1 nM to 1.0 nM.
Regulation of synovial expression of cartilage‐degrading enzymes by insulin
During active OA, FLS are known to secrete proteases into the synovial fluid that contribute to the degradation of articular cartilage matrix. In the case of ADAMTS4, MMP1, and MMP13, their expression by human OA FLS was relatively low until the FLS were exposed to the proinflammatory cytokine TNF (Figure 2). Exogenous TNF at concentrations of 1.0–30 ng/ml markedly increased the expression of these 3 catabolic enzymes (Figures 2A–C). It should be noted that we investigated ADAMTS4, as opposed to ADAMTS5, because, as reported by others, ADAMTS5 expression in human OA FLS is not induced by inflammatory cytokines and is the important homolog in mice, not humans.
Figure 2.
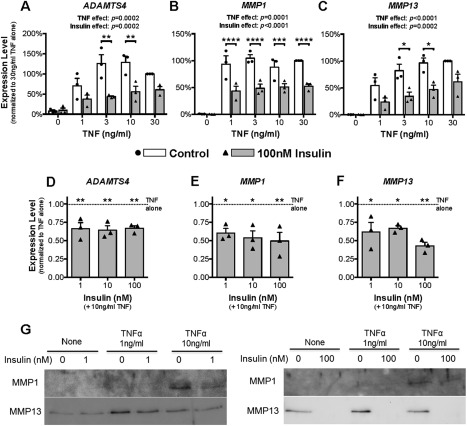
Insulin inhibits tumor necrosis factor (TNF)–dependent expression and release of catabolic enzymes in human fibroblast‐like synoviocytes (FLS) from patients with osteoarthritis (OA). A–F, Human OA FLS were treated without or with TNF at doses of 1–30 ng/ml and insulin at 100 nM (A–C) or with TNF at 10 ng/ml and insulin at doses of 0–100 nM (D–F) for 24 hours. Cells were harvested, RNA was isolated, and the expression of ADAMTS4 (A and D), MMP1 (B and E), and MMP13 (C and F) was determined by quantitative reverse transcription–polymerase chain reaction. Results are the mean ± SEM of 3 human FLS cell lines in 3 experiments, each assayed in triplicate. Symbols represent gene expression levels in FLS from individual patients. Data were analyzed by two‐way repeated‐measures analysis of variance (ANOVA) with Sidak's post‐test for multiple comparisons (A–C) or by ordinary one‐way ANOVA with Dunnett's post hoc test for multiple comparisons (D–F). G, The culture medium was recovered from FLS previously treated for 24 hours without or with TNF (1 or 10 ng/ml) and without or with insulin (1.0 or 100 nM). Release of MMP1 and MMP13 into the culture medium was assessed by Western blotting. ∗ = P < 0.05; ∗∗ = P < 0.01; ∗∗∗ = P < 0.001; ∗∗∗∗ = P < 0.0001.
When human OA FLS were exposed to 100 nM insulin, the induction of ADAMTS4, MMP1, and MMP13 expression by TNF was suppressed by ∼50% in cells cultured with the lower TNF concentrations (Figures 2A–C). Insulin had an equally suppressive effect at doses between 1.0 nM and 100 nM (Figures 2D–F). Overall, these data establish a regulatory role for insulin in modulating the expression of these critical OA‐related catabolic genes in FLS. Thus, insulin may play a physiologic role in protecting the articular cartilage by suppressing proinflammatory cytokine–dependent expression of these cartilage‐degrading enzymes.
Consistent with the gene expression data, TNF treatment increased the release of MMP1 and MMP13 by human OA FLS into the culture medium (Figure 2G). Importantly, insulin suppressed both the basal and the cytokine‐dependent enzyme levels in the culture medium, with the higher concentration of insulin (100 nM) being the most effective. The lower efficacy of the 1 nM dose of insulin may reflect a decrease in functional insulin levels in the medium, due to insulin degradation, over the course of the 24‐hour incubation.
Regulation of cytokine and growth factor expression by insulin
Expression of growth factors, including bone morphogenetic protein 2 (BMP‐2), and proinflammatory cytokines, such as TNF, IL‐6, and IL‐1β, by cells in the synovial membrane is associated with OA pathologic changes 28, 29. Consistent with this, treatment of human OA FLS with TNF markedly increased the expression of BMP2 (Figure 3A), IL6 (Figure 3B), IL1B (Figure 3C), and TNF (Figure 3D). Of note, TNF induction of its own transcript was >50‐fold (Figure 3D), while induction of IL1B was less robust (∼5‐fold) (Figure 3C). The addition of insulin into these cultures was not effective at inhibiting the TNF induction of IL1B and TNF (Figures 3C and D), but it did significantly inhibit the TNF induction of both BMP2 (Figures 3A and E) and IL6 (Figures 3B and F).
Figure 3.
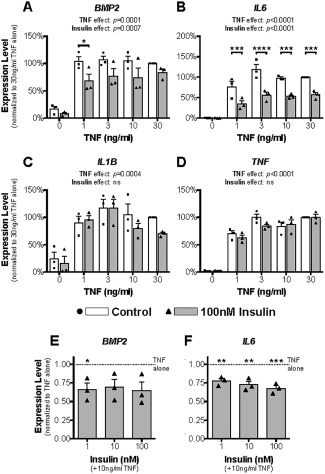
Insulin has selective inhibitory effects on inflammatory cytokine expression in human OA FLS. Human OA FLS were treated without or with TNF at doses of 1–30 ng/ml and insulin at 100 nM (A–D) or with TNF at 10 ng/ml and insulin at doses of 1–100 nM (E and F) for 24 hours. Expression of BMP2 (A and E), IL6 (B and F), IL1B (C), and TNFA (D) was determined by quantitative reverse transcription–polymerase chain reaction. Results are the mean ± SEM of 3 human FLS cell lines in 3 experiments, each assayed in triplicate. Symbols represent gene expression levels in FLS from individual patients. Data were analyzed using two‐way repeated‐measures ANOVA with Sidak's post‐test for multiple comparisons (A–D) or by ordinary one‐way ANOVA with Dunnett's post hoc test for multiple comparisons (E and F). ∗ = P < 0.05; ∗∗ = P < 0.01; ∗∗∗ = P < 0.001; ∗∗∗∗ = P < 0.0001. NS = not significant (see Figure 2 for other definitions).
Elevated expression of TNF in the synovium of HF diet–fed obese mice
Inflammatory cytokines play an important role in the pathogenesis of rheumatoid arthritis 30, and their role in OA has been primarily implicated in the early inflammatory phase that occurs acutely following injury in posttraumatic OA 31, 32. TNF plays an important role in both obesity and arthritis, and is a potent promoter of chondrocyte hypertrophy 33. In our experiments with obese mice, we found that the expression of Tnfa in synovial capsules from HF diet–fed obese mice was elevated 6‐fold after 20 weeks on the HF diet, as compared to that in lean control mice after 20 weeks on the low‐fat diet, whereas expression of Il1b was more modestly elevated in the HF diet–fed obese mice compared to lean controls (Figures 4A and B). Interestingly, Adamts5 expression was also elevated in the synovium from HF diet–fed mice (Figure 4C).
Figure 4.
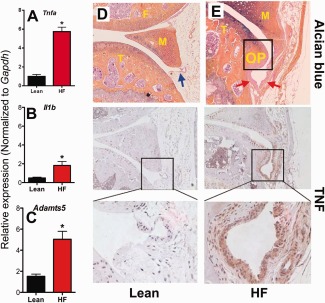
Tumor necrosis factor (TNF) expression is amplified in synovium from obese diabetic mice and is associated with increased osteophyte formation and synovial hyperplasia. A–C, Synovial capsules from the knees of C57BL/6 mice fed either a low‐fat (lean) diet or a high‐fat (HF) diet for 5 months were removed, and RNA was isolated. Expression of Tnfa (A), Il1b (B), and Adamts5 (C) was measured by quantitative reverse transcription–polymerase chain reaction. Results are the mean ± SEM of 6 mice per diet group, assayed in triplicate, with groups compared by 2‐tailed t‐test. ∗ = P < 0.05. D and E, Representative total knee joints from mice in the lean diet group (D) or the HF diet group (E) were fixed, embedded, and sectioned, and expression of TNF was determined by immunohistochemistry. Matching serial synovial tissue sections were stained with Alcian blue and hematoxylin. Top, Blue arrow indicates normal synovium, and red arrows indicate hyperplastic synovium. Boxed areas in middle panels are displayed at higher magnification in the bottom panels. Original magnification × 100 in top and middle panels; × 400 in bottom panels. OP = osteophyte; F = femur; T = tibia; M = meniscus.
Immunostaining of the mouse synovial membranes revealed amplified TNF expression in the synovium from HF diet–fed mice, with the strongest staining for TNF adjacent to developing osteophytes (Figure 4E). Conversely, samples from lean mice showed little immunostaining of the synovial membranes for TNF (Figure 4D).
Mediation of both metabolic dysfunction and OA pathologic changes by TNF in obese mice
To establish a cause‐and‐effect relationship between TNF and the pathologic changes observed in the knee joints of obese mice, a loss‐of‐function approach was taken, in which TNF‐knockout mice were compared to wild‐type mice in groups receiving either a low‐fat diet (lean controls) or an HF diet. As previously reported 34, 35, TNF‐knockout mice were partially resistant to the weight gain associated with the HF diet (Figure 5A). Similarly, the TNF‐knockout mice on the HF diet displayed less glucose intolerance than did the wild‐type mice on the HF diet (Figures 5B and C). TNF‐knockout lean control mice fed the low‐fat diet had a body weight and glucose tolerance test results that were comparable to those of wild‐type control mice on the same diet.
Figure 5.
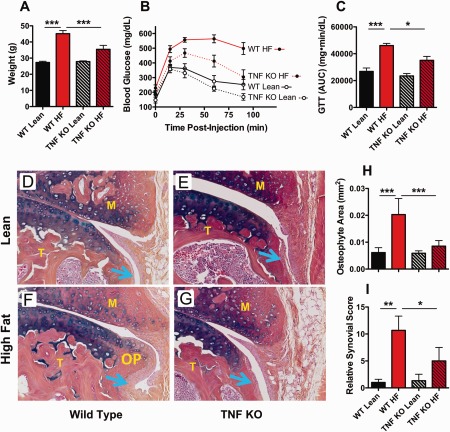
Ablation of tumor necrosis factor (TNF) blunts high‐fat (HF) diet–dependent metabolic dysfunction, osteophyte formation, and synovial hyperplasia in mice. TNF‐knockout (KO) mice and wild‐type (WT) control mice were placed on either an HF diet or a low‐fat (lean) diet for 3 months. A–C, Body weight (A), glucose levels as determined by the glucose tolerance test (GTT) (B), and area under the GTT curve (AUC) (C) were assessed at the time of tissue harvesting from mice in each diet group. D–G, Knee joint sections from WT and TNF‐knockout mice on either a lean diet (D and E) or an HF diet (F and G) were assessed for osteophytes by immunostaining with Alcian blue and hematoxylin. Blue arrows denote synovium. OP = osteophyte; F = femur; T = tibia; M = meniscus. Original magnification × 200. H and I, Osteophyte area (H) and relative synovial histologic score (I) were quantitated in the synovium from mice in each diet group. Results are the mean ± SEM of 5 mice per group, with groups compared by two‐way analysis of variance with Bonferroni‐Dunn test for multiple comparisons. ∗ = P < 0.05; ∗∗ = P < 0.01; ∗∗∗ = P < 0.001.
Similar to the findings in our previous report 17, wild‐type mice on the HF diet formed osteophytes that were larger than those in low‐fat diet–fed lean control mice (Figures D and F), and the joints of HF diet–fed obese wild‐type mice were found to display more synovial hyperplasia (Figures 5H and I). Importantly, TNF‐knockout mice on the HF diet were rescued from the formation of large osteophytes (Figures 5F and G) and showed significantly less synovial membrane hyperplasia when compared to HF diet–fed wild‐type mice (Figures 5H and I). These results indicate a critical role for TNF in mediating the OA‐related changes seen in obese mice.
Impaired insulin signaling in the synovium of patients with type 2 DM
Similar to previous findings in the adipose tissue of obese, insulin‐resistant patients and in animal models, the synovium from obese OA patients with type 2 DM contained markedly increased numbers of macrophages compared to the synovium from OA patients without diabetes, as visualized by fluorescence immunohistochemistry (Figures 6A and B). Consistent with the findings in obese diabetic mice (shown in Figure 4), human synovium from patients with type 2 DM also had higher expression levels of TNF compared to synovium from patients without diabetes (Figures 6C and D).
Figure 6.
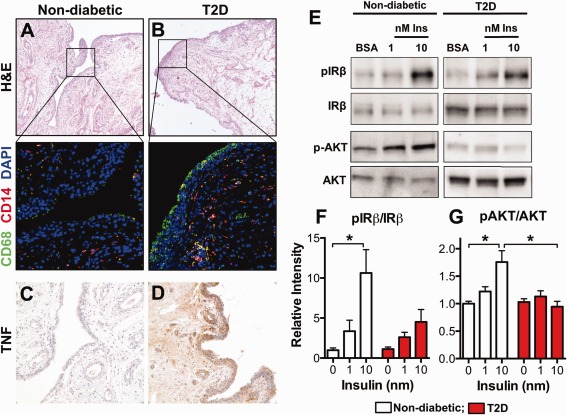
Human synovium from OA patients with type 2 diabetes mellitus (DM) has more abundant macrophages, expresses increased levels of TNF, and displays blunted insulin responsiveness. A and B, Comparable synovial tissue sections from OA patients without diabetes (A) and OA patients with type 2 DM (T2D) (B) were assessed by fluorescence immunohistochemistry to identify macrophages (CD68+ cells) and monocytes (CD14+ cells). Boxed areas in top panels are displayed at higher magnification in bottom panels. Original magnification × 50 in top panels; × 400 in bottom panels. Stained with hematoxylin and eosin (H&E); counterstained with DAPI. C and D, Synovium from OA patients without diabetes (C) and OA patients with type 2 DM (D) was assessed by immunohistochemistry for TNF expression. Original magnification × 200. E–G, Additional synovial tissue samples from OA patients with type 2 DM and those without diabetes were incubated in cell culture medium without or with insulin (Ins) (1 or 10 nM) for 10 minutes, or in bovine serum albumin (BSA) alone as control. Western blotting was performed to assess the levels of insulin receptor (IR) autophosphorylation and serine phosphorylation of Akt (Ser473) (representative blots shown) (E). Densitometric scanning was performed to quantify the levels of IRβ phosphorylation (F) and Akt phosphorylation (G). Results are the mean ± SEM of 7 patients with type 2 DM and 6 patients without diabetes. Groups were compared by ordinary one‐way ANOVA with Dunnett's post hoc test for multiple comparisons. ∗ = P < 0.05. See Figure 2 for other definitions.
To examine insulin responsiveness in the human synovium, synovial biopsy tissue samples from patients with type 2 DM and patients without diabetes were exposed to insulin, and IR signaling was examined. Not only was IR autophosphorylation blunted in samples from patients with type 2 DM (Figures 6E and F), but also the insulin‐induced phosphorylation of Akt (Ser473) was completely absent in the synovium from patients with type 2 DM compared to that from patients without diabetes (Figures 6E and G). This is the first study to show impaired synovial insulin responsiveness in patients with type 2 DM, a finding that is consistent with the insulin resistance in this tissue.
DISCUSSION
We recently reported that progression of posttraumatic OA was accelerated in a mouse model of obesity and type 2 DM 17. Obesity is recognized as a chronic, systemic proinflammatory state involving the same cytokines that have been implicated in OA 36. Adipose tissue in obese individuals and in animal models contains increased numbers of activated macrophages that release proinflammatory cytokines such as IL‐1β, TNF, and IL‐6 37. These elevated cytokine levels promote proinflammatory changes in adipocytes that, in turn, release additional proinflammatory mediators and adipokines to amplify the inflammatory response and act both locally on adipocytes and systemically to impair insulin action in insulin target tissues 23, 24.
The critical role of TNF in this inflammatory and dysregulated metabolic state of obesity in mouse models is well established. In fact, the TNF‐knockout mouse is known to be resistant to HF diet–induced insulin resistance and obesity 34, 35, a systemic phenotype that was further confirmed herein (Figure 5). Similar conclusions were drawn from investigations using TNF receptor type I–knockout mice 38 and antibody blockade of TNF in mouse models 39, 40, as well as in a few clinical studies 41, 42, 43.
In this study, we show, for the first time, that the number of macrophages is markedly increased in the synovium of OA patients with type 2 DM as compared to OA patients without diabetes (Figure 6). Furthermore, the levels of TNF are also elevated in the synovium of OA patients with type 2 DM. The findings from our mouse experiments provided evidence of a link between the elevated TNF levels in obesity and accelerated OA. Not only were the levels of TNF chronically elevated in the synovium of obese mice, but also the obesity‐dependent amplification of TNF expression was greater than that of IL‐1β, the other major proinflammatory cytokine implicated in OA.
The impact of TNF expression in the human synovium was demonstrated by its enhancing effect on the expression of inflammatory cytokines (IL6) and growth factors (BMP2) as well as the expression of catabolic enzymes (MMP1, MMP13, and ADAMTS4) in human OA FLS. All of these gene products are well‐known inducers of chondrocyte hypertrophic change, cartilage degeneration, and/or osteophyte formation 2. In response to exogenous TNF, we observed a >50‐fold increase in Tnfa expression, and found that this was not inhibited by insulin. Nonetheless, this indicates a robust mechanism of feed‐forward amplification in the synovium. This raises the possibility that a modest increase in synovial TNF levels, originating from the systemic circulation or the increased population of macrophages in the synovial membrane, can result in a marked increase in cytokine expression in synoviocytes.
The hyperglycemia previously observed in HF diet–fed mice may be one mechanism by which TNF expression is induced in resident synovial macrophages 17. Although we have already established the link between systemic loss of TNF and suppression of OA changes in obese mice, further investigations are ongoing to determine the specific impact of cartilage‐ and synovium‐specific loss of TNF on OA progression in obesity.
The blunting of HF diet–induced early osteophyte formation and its close spatial relationship to hyperplastic synovium in the absence of joint trauma in the TNF‐knockout mouse are direct evidence of the critical contribution of this cytokine to the enhanced OA phenotype seen in obesity. The relationship of synovial hyperplasia to OA‐related chondropathy has been noted previously 22, 44, with activated synovial macrophages playing a key role in the inflammatory process 21, leading to expansion of the lining cell layer with occasional infiltration by lymphocytes and monocytes 45. These synovial events had not been previously characterized in the context of diabetes and/or obesity.
Interestingly, anti‐TNF therapy has been proposed as a candidate treatment strategy for OA 22, 46. A recent study demonstrated that adalimumab, a human anti‐TNF antibody inhibitor, was effective in human knee OA 47. Nonetheless, the results of multiple clinical studies with anti‐TNF therapies have been conflicting and inconsistent 48, 49. Whether these inconsistencies reflect differences in study design or patient selection is unclear. A future investigation of anti‐TNF therapy restricted to an obese/type 2 DM patient population with OA would be interesting.
In the present study, we also demonstrated the expression of IRs in the synovial membrane and a functional IR signaling pathway in human OA FLS. Rosa and colleagues recently reported that chondrocytes also express functional IRs that respond to physiologic insulin concentrations 50. Note that our immunohistochemical analysis of IR expression in the knee joints of mice confirmed the expression of IRs in mouse chondrocytes (Figures 1A and B). Moreover, we found that insulin inhibited TNF‐dependent expression of ADAMTS4 (Figures 2A and D), MMP1 (Figures 2B and E), MMP13 (Figures 2C and F), and IL6 (Figures 3B and F) by ∼50% in human OA FLS. Importantly, insulin also markedly inhibited the release of MMP1 and MMP13 into the cell culture medium (Figure 2G). These results suggest that insulin may be cartilage protective by dampening the potentially cartilage‐damaging response to TNF. Thus, it follows that the classic insulin resistance associated with obesity and type 2 DM would impair this role of insulin if the synovium develops insulin resistance, similar to that found in other insulin target tissues.
Notably, our findings revealed that insulin signaling in human OA synovium from patients with type 2 DM was impaired (Figure 6). These analyses of synovial biopsy tissue, rather than isolated FLS, more closely mimic the microenvironment of the synovium in vivo, and the findings are likely a reflection of the crosstalk between FLS and mononuclear cells. Taken together, these results suggest a mechanism by which patients with type 2 DM could develop increased susceptibility to the initiation and progression of OA.
In this study, we document the key tissue and molecular phenotypes that occur in OA in conjunction with obesity and type 2 DM. We show that human OA FLS are insulin responsive, and that insulin down‐regulates the expression of IL6, possibly the expression of BMP2, and the expression of cartilage‐degrading catabolic enzymes (aggrecanases and MMPs) in these cells. Moreover, catabolic responses of FLS to TNF are blocked by insulin, thereby suggesting the mechanism through which activation of insulin signaling may prevent a pathologic cascade of catabolic change in the joint whenever systemic or local TNF levels are transiently raised. Furthermore, we demonstrate that in obesity/type 2 DM, there is increased macrophage infiltration into the synovium that coincides with the increase in synovial TNF expression and the development of synovial insulin resistance.
Overall, based on the results reported herein, we propose the novel idea that the development and progression of OA in conjunction with obesity/type 2 DM is a unique pathologic process. We provide evidence that this process may involve elevated numbers of macrophages in the synovium, increased synovial TNF expression, development of synovial insulin resistance, and the loss of the protective role of insulin in the synovium and in the joint.
AUTHOR CONTRIBUTIONS
All authors were involved in drafting the article or revising it critically for important intellectual content, and all authors approved the final version to be published. Dr. Mooney had full access to all of the data in the study and takes responsibility for the integrity of the data and the accuracy of the data analysis.
Study conception and design
Hamada, Hilton, Zuscik, Mooney.
Acquisition of data
Hamada, Maynard, Schott, Drinkwater, Ketz, Kates, Jonason, Hilton, Zuscik, Mooney.
Analysis and interpretation of data
Hamada, Maynard, Schott, Jonason, Zuscik, Mooney.
ACKNOWLEDGMENTS
We thank Andrea Lee, Sarah Catheline, and Brittanie Kilchoer for their very capable technical skills, and Amy Battisti, Carin Erbland, Allison McIntyre, Kaili Pecorella, and Kelly Romantini for facilitating the Institutional Review Board–approved procurement of human samples. We also greatly appreciate the support of the Histology, Biochemistry, and Molecular Imaging Core in the Center for Musculoskeletal Research at the University of Rochester.
Supported by AOTrauma Research (grant to Drs. Kates and Mooney) and the NIH (grant R01‐AR‐063071 to Dr. Hilton, grant 5P50‐AR‐054041‐5471 to Dr. Zuscik, National Center for Advancing Translational Sciences Clinical and Translational Science Award UL1‐TR‐000042 to Drs. Zuscik and Mooney, and grant P30‐AR‐061307).
Dr. Hamada and Mr. Maynard contributed equally to this work. Drs. Zuscik and Mooney contributed equally to this work.
REFERENCES
- 1. Hootman JM, Helmick CG. Projections of US prevalence of arthritis and associated activity limitations. Arthritis Rheum 2006;54:226–9. [DOI] [PubMed] [Google Scholar]
- 2. Buckwalter JA, Mankin HJ, Grodzinsky AJ. Articular cartilage and osteoarthritis. Instr Course Lect 2005;54:465–80. [PubMed] [Google Scholar]
- 3. Lohmander LS, Gerhardsson de Verdier M, Rollof J, Nilsson PM, Engstrom G. Incidence of severe knee and hip osteoarthritis in relation to different measures of body mass: a population‐based prospective cohort study. Ann Rheum Dis 2009;68:490–6. [DOI] [PubMed] [Google Scholar]
- 4. Oliveria SA, Felson DT, Cirillo PA, Reed JI, Walker AM. Body weight, body mass index, and incident symptomatic osteoarthritis of the hand, hip, and knee. Epidemiology 1999;10:161–6. [PubMed] [Google Scholar]
- 5. Dahaghin S, Bierma‐Zeinstra SM, Koes BW, Hazes JM, Pols HA. Do metabolic factors add to the effect of overweight on hand osteoarthritis? The Rotterdam Study. Ann Rheum Dis 2007;66:916–20. [DOI] [PMC free article] [PubMed] [Google Scholar]
- 6. Douloumpakas I, Pyrpasopoulou A, Triantafyllou A, Sampanis C, Aslanidis S. Prevalence of musculoskeletal disorders in patients with type 2 diabetes mellitus: a pilot study. Hippokratia 2007;11:216–8. [PMC free article] [PubMed] [Google Scholar]
- 7. Silveri F, Brecciaroli D, Argentati F, Cervini C. Serum levels of insulin in overweight patients with osteoarthritis of the knee. J Rheumatol 1994;21:1899–902. [PubMed] [Google Scholar]
- 8. Hart DJ, Doyle DV, Spector TD. Association between metabolic factors and knee osteoarthritis in women: the Chingford Study. J Rheumatol 1995;22:1118–23. [PubMed] [Google Scholar]
- 9. Puenpatom RA, Victor TW. Increased prevalence of metabolic syndrome in individuals with osteoarthritis: an analysis of NHANES III data. Postgrad Med 2009;121:9–20. [DOI] [PubMed] [Google Scholar]
- 10. Yoshimura N, Muraki S, Oka H, Kawaguchi H, Nakamura K, Akune T. Association of knee osteoarthritis with the accumulation of metabolic risk factors such as overweight, hypertension, dyslipidemia, and impaired glucose tolerance in Japanese men and women: the ROAD study. J Rheumatol 2011;38:921–30. [DOI] [PubMed] [Google Scholar]
- 11. Karvonen‐Gutierrez CA, Sowers MR, Heeringa SG. Sex dimorphism in the association of cardiometabolic characteristics and osteophytes‐defined radiographic knee osteoarthritis among obese and non‐obese adults: NHANES III. Osteoarthritis Cartilage 2012;20:614–21. [DOI] [PMC free article] [PubMed] [Google Scholar]
- 12. Eymard F, Parsons C, Edwards MH, Petit‐Dop F, Reginster JY, Bruyere O, et al. Diabetes is a risk factor for knee osteoarthritis progression. Osteoarthritis Cartilage 2015;23:851–9. [DOI] [PubMed] [Google Scholar]
- 13. Visser AW, Ioan‐Facsinay A, de Mutsert R, Widya RL, Loef M, de Roos A, et al. Adiposity and hand osteoarthritis: the Netherlands Epidemiology of Obesity study. Arthritis Res Ther 2014;16:R19. [DOI] [PMC free article] [PubMed] [Google Scholar]
- 14. Antony B, Jones G, Venn A, Cicuttini F, March L, Blizzard L, et al. Association between childhood overweight measures and adulthood knee pain, stiffness and dysfunction: a 25‐year cohort study. Ann Rheum Dis 2015;74:711–7. [DOI] [PubMed] [Google Scholar]
- 15. Felson DT, Zhang Y. An update on the epidemiology of knee and hip osteoarthritis with a view to prevention [review]. Arthritis Rheum 1998;41:1343–55. [DOI] [PubMed] [Google Scholar]
- 16. Knowler WC, Barrett‐Connor E, Fowler SE, Hamman RF, Lachin JM, Walker EA, et al. Reduction in the incidence of type 2 diabetes with lifestyle intervention or metformin. N Engl J Med 2002;346:393–403. [DOI] [PMC free article] [PubMed] [Google Scholar]
- 17. Mooney RA, Sampson ER, Lerea J, Rosier RN, Zuscik MJ. High‐fat diet accelerates progression of osteoarthritis after meniscal/ligamentous injury. Arthritis Res Ther 2011;13:R198. [DOI] [PMC free article] [PubMed] [Google Scholar]
- 18. Gierman LM, van der Ham F, Koudijs A, Wielinga PY, Kleemann R, Kooistra T, et al. Metabolic stress–induced inflammation plays a major role in the development of osteoarthritis in mice. Arthritis Rheum 2012;64:1172–81. [DOI] [PubMed] [Google Scholar]
- 19. Griffin TM, Huebner JL, Kraus VB, Yan Z, Guilak F. Induction of osteoarthritis and metabolic inflammation by a very high‐fat diet in mice: effects of short‐term exercise. Arthritis Rheum 2012;64:443–53. [DOI] [PMC free article] [PubMed] [Google Scholar]
- 20. Brunner AM, Henn CM, Drewniak EI, Lesieur‐Brooks A, Machan J, Crisco JJ, et al. High dietary fat and the development of osteoarthritis in a rabbit model. Osteoarthritis Cartilage 2012;20:584–92. [DOI] [PubMed] [Google Scholar]
- 21. Bondeson J, Blom AB, Wainwright S, Hughes C, Caterson B, van den Berg WB. The role of synovial macrophages and macrophage‐produced mediators in driving inflammatory and destructive responses in osteoarthritis [review]. Arthritis Rheum 2010;62:647–57. [DOI] [PubMed] [Google Scholar]
- 22. Pelletier JP, Martel‐Pelletier J, Abramson SB. Osteoarthritis, an inflammatory disease: potential implication for the selection of new therapeutic targets [review]. Arthritis Rheum 2001;44:1237–47. [DOI] [PubMed] [Google Scholar]
- 23. Xu H, Barnes GT, Yang Q, Tan G, Yang D, Chou CJ, et al. Chronic inflammation in fat plays a crucial role in the development of obesity‐related insulin resistance. J Clin Invest 2003;112:1821–30. [DOI] [PMC free article] [PubMed] [Google Scholar]
- 24. Hotamisligil GS, Shargill NS, Spiegelman BM. Adipose expression of tumor necrosis factor‐α: direct role in obesity‐linked insulin resistance. Science 1993;259:87–91. [DOI] [PubMed] [Google Scholar]
- 25. Senn JJ, Klover PJ, Nowak IA, Mooney RA. Interleukin‐6 induces cellular insulin resistance in hepatocytes. Diabetes 2002;51:3391–9. [DOI] [PubMed] [Google Scholar]
- 26. Van Meurs JB, Van Lent PL, Joosten LA, Van der Kraan PM, Van den Berg WB. Quantification of mRNA levels in joint capsule and articular cartilage of the murine knee joint by RT‐PCR: kinetics of stromelysin and IL‐1 mRNA levels during arthritis. Rheumatol Int 1997;16:197–205. [DOI] [PubMed] [Google Scholar]
- 27. Sampson ER, Hilton MJ, Tian Y, Chen D, Schwarz EM, Mooney RA, et al. Teriparatide as a chondroregenerative therapy for injury‐induced osteoarthritis. Sci Transl Med 2011;3:101ra93. [DOI] [PMC free article] [PubMed] [Google Scholar]
- 28. De Lange‐Brokaar BJ, Ioan‐Facsinay A, van Osch GJ, Zuurmond AM, Schoones J, Toes RE, et al. Synovial inflammation, immune cells and their cytokines in osteoarthritis: a review. Osteoarthritis Cartilage 2012;20:1484–99. [DOI] [PubMed] [Google Scholar]
- 29. Scharstuhl A, Vitters EL, van der Kraan PM, van den Berg WB. Reduction of osteophyte formation and synovial thickening by adenoviral overexpression of transforming growth factor β/bone morphogenetic protein inhibitors during experimental osteoarthritis. Arthritis Rheum 2003;48:3442–51. [DOI] [PubMed] [Google Scholar]
- 30. Feldmann M, Maini SR. Role of cytokines in rheumatoid arthritis: an education in pathophysiology and therapeutics. Immunol Rev 2008;223:7–19. [DOI] [PubMed] [Google Scholar]
- 31. Benito MJ, Veale DJ, FitzGerald O, van den Berg WB, Bresnihan B. Synovial tissue inflammation in early and late osteoarthritis. Ann Rheum Dis 2005;64:1263–7. [DOI] [PMC free article] [PubMed] [Google Scholar]
- 32. Smith MD, Triantafillou S, Parker A, Youssef PP, Coleman M. Synovial membrane inflammation and cytokine production in patients with early osteoarthritis. J Rheumatol 1997;24:365–71. [PubMed] [Google Scholar]
- 33. Aizawa T, Kon T, Einhorn TA, Gerstenfeld LC. Induction of apoptosis in chondrocytes by tumor necrosis factor‐α. J Orthop Res 2001;19:785–96. [DOI] [PubMed] [Google Scholar]
- 34. Uysal KT, Wiesbrock SM, Marino MW, Hotamisligil GS. Protection from obesity‐induced insulin resistance in mice lacking TNF‐α function. Nature 1997;389:610–4. [DOI] [PubMed] [Google Scholar]
- 35. Ventre J, Doebber T, Wu M, MacNaul K, Stevens K, Pasparakis M, et al. Targeted disruption of the tumor necrosis factor‐α gene: metabolic consequences in obese and nonobese mice. Diabetes 1997;46:1526–31. [DOI] [PubMed] [Google Scholar]
- 36. Hotamisligil GS. Inflammation and metabolic disorders. Nature 2006;444:860–7. [DOI] [PubMed] [Google Scholar]
- 37. Weisberg SP, McCann D, Desai M, Rosenbaum M, Leibel RL, Ferrante AW Jr. Obesity is associated with macrophage accumulation in adipose tissue. J Clin Invest 2003;112:1796–808. [DOI] [PMC free article] [PubMed] [Google Scholar]
- 38. Uysal KT, Wiesbrock SM, Hotamisligil GS. Functional analysis of tumor necrosis factor (TNF) receptors in TNF‐α‐mediated insulin resistance in genetic obesity. Endocrinology 1998;139:4832–8. [DOI] [PubMed] [Google Scholar]
- 39. Araujo EP, De Souza CT, Ueno M, Cintra DE, Bertolo MB, Carvalheira JB, et al. Infliximab restores glucose homeostasis in an animal model of diet‐induced obesity and diabetes. Endocrinology 2007;148:5991–7. [DOI] [PubMed] [Google Scholar]
- 40. Barbuio R, Milanski M, Bertolo MB, Saad MJ, Velloso LA. Infliximab reverses steatosis and improves insulin signal transduction in liver of rats fed a high‐fat diet. J Endocrinol 2007;194:539–50. [DOI] [PubMed] [Google Scholar]
- 41. Yazdani‐Biuki B, Stelzl H, Brezinschek HP, Hermann J, Mueller T, Krippl P, et al. Improvement of insulin sensitivity in insulin resistant subjects during prolonged treatment with the anti‐TNF‐α antibody infliximab. Eur J Clin Invest 2004;34:641–2. [DOI] [PubMed] [Google Scholar]
- 42. Gonzalez‐Gay MA, De Matias JM, Gonzalez‐Juanatey C, Garcia‐Porrua C, Sanchez‐Andrade A, Martin J, et al. Anti‐tumor necrosis factor‐α blockade improves insulin resistance in patients with rheumatoid arthritis. Clin Exp Rheumatol 2006;24:83–6. [PubMed] [Google Scholar]
- 43. Yazdani‐Biuki B, Mueller T, Brezinschek HP, Hermann J, Graninger W, Wascher TC. Relapse of diabetes after interruption of chronic administration of anti‐tumor necrosis factor‐α antibody infliximab: a case observation. Diabetes Care 2006;29:1712–3. [DOI] [PubMed] [Google Scholar]
- 44. Ayral X, Pickering EH, Woodworth TG, Mackillop N, Dougados M. Synovitis: a potential predictive factor of structural progression of medial tibiofemoral knee osteoarthritis: results of a 1 year longitudinal arthroscopic study in 422 patients. Osteoarthritis Cartilage 2005;13:361–7. [DOI] [PubMed] [Google Scholar]
- 45. Aigner T, Sachse A, Gebhard PM, Roach HI. Osteoarthritis: pathobiology‐targets and ways for therapeutic intervention. Adv Drug Deliv Rev 2006;58:128–49. [DOI] [PubMed] [Google Scholar]
- 46. Abramson SB, Yazici Y. Biologics in development for rheumatoid arthritis: relevance to osteoarthritis. Adv Drug Deliv Rev 2006;58:212–25. [DOI] [PubMed] [Google Scholar]
- 47. Maksymowych WP, Russell AS, Chiu P, Yan A, Jones N, Clare T, et al. Targeting tumor necrosis factor alleviates signs and symptoms of inflammatory osteoarthritis of the knee. Arthritis Res Ther 2012;14:R206. [DOI] [PMC free article] [PubMed] [Google Scholar]
- 48. Chevalier X, Ravaud P, Maheu E, Baron G, Rialland A, Vergnaud P, et al on behalf of the French Section of Osteoarthritis. Adalimumab in patients with hand osteoarthritis refractory to analgesics and NSAIDs: a randomised, multicentre, double‐blind, placebo‐controlled trial. Ann Rheum Dis 2015;74:1697–705. [DOI] [PubMed] [Google Scholar]
- 49. Verbruggen G, Wittoek R, Vander Cruyssen B, Elewaut D. Tumour necrosis factor blockade for the treatment of erosive osteoarthritis of the interphalangeal finger joints: a double blind, randomised trial on structure modification. Ann Rheum Dis 2012;71:891–8. [DOI] [PMC free article] [PubMed] [Google Scholar]
- 50. Rosa SC, Rufino AT, Judas F, Tenreiro C, Lopes MC, Mendes AF. Expression and function of the insulin receptor in normal and osteoarthritic human chondrocytes: modulation of anabolic gene expression, glucose transport and GLUT‐1 content by insulin. Osteoarthritis Cartilage 2011;19:719–27. [DOI] [PubMed] [Google Scholar]