

Abstract
Background
Current definitions of acute kidney injury (AKI) are not sufficiently sensitive to identify all newborns with AKI during the first week of life.
Methods
To determine whether the rate of decline of serum creatinine (SCr) during the first week of life can be used to identify newborns with AKI, we reviewed the medical records of 106 term neonates at risk of AKI who were treated with hypothermia for hypoxic ischemic encephalopathy (HIE).
Results
Of the newborns enrolled in the study, 69 % showed a normal rate of decline of SCr to ≥50 % and/or reached SCr levels of ≤0.6 mg/dl before the 7th day of life, and therefore had an excellent clinical outcome (control group). Thirteen newborns with HIE (12 %) developed AKI according to an established neonatal definition (AKI–KIDGO group), and an additional 20 newborns (19 %) showed a rate of decline of SCr of <33, <40, and <46 % from birth to days 3, 5, or 7 of life, respectively (delayed rise in estimated SCr clearance group). Compared to the control group, newborns in the other two groups required more days of mechanical ventilation and vasopressor drugs and had higher gentamicin levels, more fluid overload, lower urinary epidermal growth factor levels, and a prolonged length of stay.
Conclusions
The rate of decline of SCr provides a sensitive approach to identify term newborns with AKI during the first week of life.
Keywords: Neonate, Acute kidney injury, Biomarkers, Serum creatinine, Epidermal growth factor
Introduction
Critically ill neonates can suffer systemic hypoxemia and/or reduced cerebral blood flow episodes that lead to hypoxic–ischemic encephalopathy (HIE) [1]. While these patients can be treated with therapeutic hypothermia to minimize brain injury [2, 3], they are also at high risk of developing acute kidney injury (AKI) [4, 5]. Therefore, it is important to identify all newborns with HIE during the early stages of AKI to initiate rapid renal supportive therapy. Early diagnosis of AKI during the first week of life can be problematic as the standard clinical criteria used in older patients [6], such as an elevated serum creatinine (SCr) level and decreased urine output, lack sensitivity in the neonatal population [7–9]. Similarly, oliguria is not a very sensitive marker of renal function in neonates, as AKI can be seen in the absence of oliguria [9]. These limitations highlight the need to develop a more sensitive definition of AKI and to discover new biomarkers of AKI during the first week of life.
Most studies in children use definitions of AKI adapted from the Acute Kidney Injury Network (AKIN) [10] or pRIFLE [11] criteria that are recommended by the Kidney Disease Improved Global Outcome (KDIGO) Clinical Practice Guideline for AKI [12]. These definitions are based on the stratification of changes in SCr levels and urine output, use the Schwartz formula to estimate the creatinine clearance (eCrCl) [13–15], or require an increase of SCr increase by >0.3 mg/dl over the baseline values within a 48-h period [16, 17]. However, the Schwartz formula has not been validated in infants younger than 30 days of life [14], and a significant renal injury event during the first days of life may not necessarily increase the SCr level to >0.3 mg/dl over the high baseline levels often seen immediately after birth. In addition, the well-recognized limitations of SCr to assess the renal function in children and adults [18] are largely based on the observation that at higher glomerular filtration rate (GFR) values (>60 ml/min/1.73 m2) the SCr will not change fast enough in response to the fall in GFR. However, given the low GFR values of newborns (10–25 ml/min/1.73 m2) [19–25], the SCr could change in an exponential fashion following a small change in GFR (Fig. 1a). Moreover, changes in SCr that occur in newborns shortly after birth also reflect the effective clearance of transferred maternal creatinine. Based on these observations, we carried out this study to test the hypothesis that the rate of decline of SCr during the first week of life provides a more sensitive approach to assess the renal status of term newborns with HIE. Because the rate of SCr decline has to be interpreted knowing the normal SCr levels, we first generated cutoff values to define normal SCr levels at each specific time point and then assessed the normal rate of SCr decline during the first week of life.
Fig. 1.
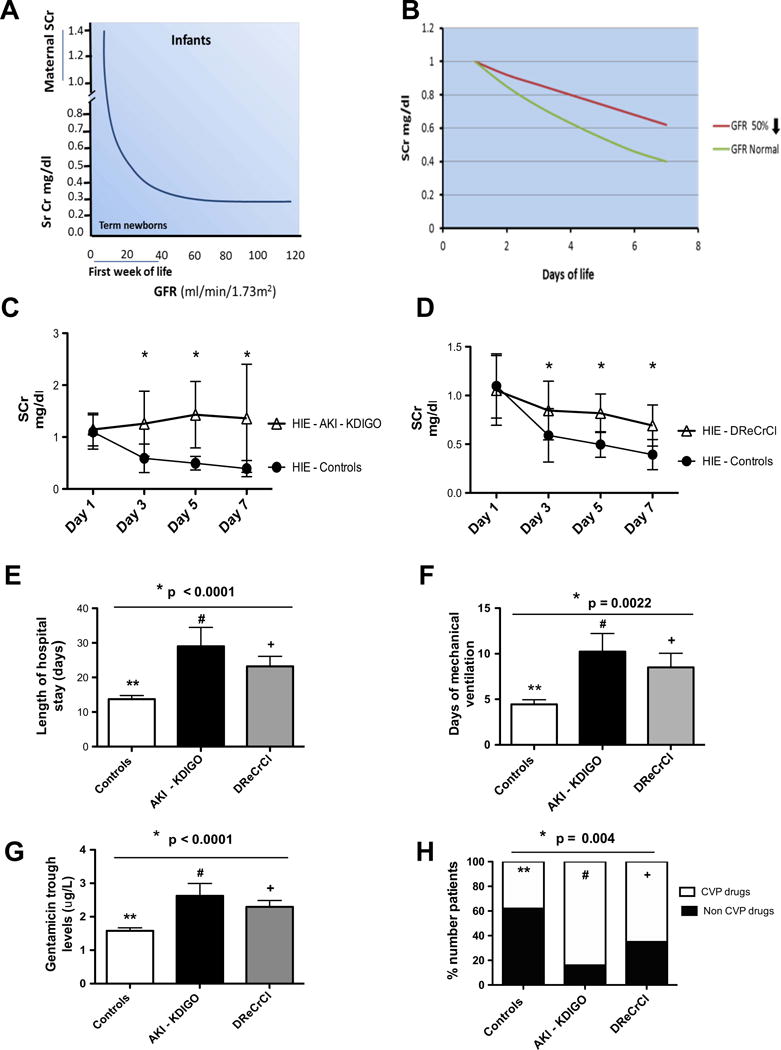
Relationship between serum creatinine (Sr Cr or SCr) level, glomerular filtration rate (GFR), and clinical outcome of newborns with hypoxic ischemic encephalopathy (HIE). a Model supporting the hypothesis that the rate of SCr decline can be used as a biomarker to estimate the renal function of term newborns during the first week of life. b Predicted SCr decline in term newborns with a normal or 50 % reduction in GFR. The models shown in a and b were generated based on data reported in previous studies by Schwartz et al. [13–15]. c SCr decline in the control group (HIE–Controls) and in the Acute Kidney Injury–Kidney Disease Improved Global Outcome (HIE–AKI–KIDGO) group. d SCr level declines in the control group, while there is a delayed decline in SCr in the newborns with HIE in the delayed rise estimated creatinine clearance (HIE–DReCrCl) group. *p < 0.0001 for all time points (Mann–Whitney test). e–h Compared to the Control group, newborns with HIE in the AKI–KDIGO group and DReCrCl group showed a more prolonged length of hospital stay (e), required more days of mechanical ventilation (f), had higher gentamicin trough levels (g), and required more continuous vasopressor (CVP) drugs (h). *p values for e–g were estimated by analysis of variance (ANOVA) followed by multiple post hoc comparisons whenever appropriate. **p < 0.05 for controls vs. AKI–KDIGO group; +p < 0.05 for DReCrCl group vs. controls; #p > 0.05 for AKI–KDIGO group vs. DReCrCl group. *p values for h were estimated by chi-square analysis followed by Bonferroni’s correction whenever appropriate. ** p = 0.0067 for controls vs. AKI–KDIGO group; #p = 0.24; for AKI–KDIGO group vs. DReCrCl group; +p = 0.054 for DReCrCl group vs. controls
Materials and methods
Study population
We conducted a retrospective review of the medical records of 106 term neonates treated with hypothermia for HIE who were admitted to Children’s National Medical Center’s level 4 neonatal intensive care unit (NICU) between 2008 and 2013. Entry criteria included all newborns who met institutional criteria for therapeutic hypothermia for HIE (i.e., >35 weeks gestation, >1800 g at birth, with metabolic acidosis and/or need for prolonged resusCitation, and moderate to severe encephalopathy) and survived the first week of life. Neonates with suspected chromosomal abnormalities or major congenital anomalies were excluded from the study. Patients with HIE were treated according to the Human Development Neonatal Research Network protocol [2]. According to this protocol, the gentamicin dose (4 mg/kg 24 h) and monitoring were similar in all patients. The trough levels of gentamicin were measured in samples drawn 30 min before the daily doses of gentamicin were given. In a separate prospective study involving a subset (n = 25) of patients enrolled in the current study and 27 healthy controls, urinary biomarkers were assessed during the first week of life as described previously [26].
Definition of the study groups, selection of control HIE newborns without AKI, and standard definition of AKI
The control group included newborns with HIE who showed an improvement of their eCrCl from birth to the 7th day of life of ≥50 % with normalization of SCr values, or who reached normal SCr levels on days 5 or 7 of life as described in previous studies [14, 15, 24, 25]. The eCrCl and its predicted rate of improvement were assessed as reported in healthy term newborns by Schwartz et al. [14, 15]. A SCr of >2 standard deviation (SD) above the mean levels reported in healthy term newborns on day 7 of life (0.5 ± 0.10 mg/dl; mean ± SD) [15] was considered to be abnormal. The AKI–KIDGO group included newborns with HIE who developed AKI according to a modified KDIGO definition for neonates based on a rise in SCr of >0.3 mg/dl within any 48-h period [16, 27]. The third group, named the delayed rise in eCrCl (DReCrCl) group, included the remaining newborns who failed to increase their eCrCl by >50 % from birth to the 7th day of life and/or showed elevated SCr values at this time point. This eCrCl cutoff point was associated with changes in urinary biomarkers of AKI in newborns with HIE [26] and may be analogous to the pRIFLE injury criteria, which require an eCrCl decrease of 50 %, and correlates with a worse clinical outcome of critically ill children [11].
Data and sample collection
All relevant demographic and clinical data were assessed during the first week of life. Urine output was measured according to the NICU standard protocol of care [26]. SCr was measured using the kinetic Jaffe method performed on the Siemens Dimension RXL Chemistry Analyzer (Siemens Healthcare, Erlangen, Germany) at the Children’s Hospital central laboratory. Calibration for every new reagent cartridge lot was performed using standards following the manufacturer’s recommendations. The SCr measurements done in control samples from healthy newborns were within the normal range. The urinary levels of neutrophil associated gelatinase lipocalin (NGAL) and epidermal growth factor (EGF) were measured using enzyme-linked-immunoabsorbent assay as described in detailed in our previous studies [26, 28].
Statistical analysis
Demographic and clinical data are reported as the mean ± SD for continuous variables and as proportions for continuous variables. All data sets were tested for normality with the D’Agostino and Pearson omnibus normality test. The median with interquartile range (IQR) was used for non-normally distributed variables. Differences between two groups were analyzed by the Student t test or Mann–Whitney U tests where appropriate. Proportional differences were tested with the Fisher exact test or the Chi-square test with Bonferroni’s correction whenever indicated. Intergroup comparisons were tested with analyses of variance (ANOVA). Post-test comparisons for significance were performed by the Kruskal–Wallis test for nonparametric data or Bonferroni’s test for parametric data. Receiver-operating curves (ROC) were used to determine cutoff values for optimal sensitivity and specificity using samples corresponding to the following groups: (1) control + AKI–DIGO (n = 86); (2) control + DReCrCl (n = 93); (3) control + AKI–KDIGO and DReCrCl groups combined (n = 106). Logistic regression analysis was done to develop ROC combining the absolute levels of SCr with the SCr decline, or SCr with EGF, as described previously [26, 29, 30]. Briefly, we fit a binary logistic regression model treating the selected biomarkers as “predicted probabilities” and used the predicted probabilities scores as the test variable to perform the ROC analysis using the MedCal software. Taking into consideration the area under the curves (AUCs) of all biomarkers, alone or combined, we then performed additional ROC analyses, first filtering the cases using the cutoff value of the single best biomarker and then adding a second biomarker with a known cutoff value to determine whether the sensitivity and specificity of the combined biomarkers improved. These tests were done using the Prism 4 software program (GraphPad Software Inc., La Jolla, CA), MedCalc software (Oostend, Belgium), or SPSS version 18.0 software (IBM Corp., Armonk, NY).
Results
Demographic and clinical characteristics
The baseline birth weight, gender, race, and Apgar scores were not significantly different between groups (Table 1). Approximately 12 % of the newborns were less than 37 weeks of gestational age, and patients in the AKI–KDIGO group had a lower GA (37 ± 2 weeks; p = 0.006) than the control and DReCrCl groups (Table 1).
Table 1.
Demographic characteristics of 106 newborns with hypoxic ischemic encephalopathy
| Parameter | Study groups of newborns with HIE based on changes in eCrCl from birth to the 7th day of lifea | p values | ||
|---|---|---|---|---|
|
|
||||
| Control group (n=73) | AKI–KDIGO group (n=13) | DReCrCl group (n=20) | ||
| Birth weight (kg) (mean ± SD) | 3.36 ± 0.65 | 2.98 ± 0.76 | 3.32 ± 0.52 | 0.41 |
| Male gender, n (%) | 42 (57 %) | 10 (76 %) | 11 (55 %) | 0.06 |
| Gestational age (weeks) (mean ± SD) | 39 ± 1.4 | 37.2 2.0a | 38.5 ± 1.8 | 0.006* |
| Median Apgar scores (range) | ||||
| 1 min | 1.00 (0–5) | 1.00 (0–4) | 2.5 (0–6)*b | 0.023* |
| 5 min | 3.00 (0–7) | 4.00 (0–8) | 5.0 (0–9) | 0.165 |
| Number of newborns with median (%) Apgar score of: | ||||
| <7 at 1 min | 73 (100 %) | 13 (100 %) | 20 (100 %) | ND |
| <7 at 5 min | 73 (100 %) | 12 (92.4 %) | 19 (95 %) | >0.05 |
| Race, n (%) | ||||
| White | 30 (41.1 %) | 5 (38.46 %) | 10 (50 %) | 0.745 |
| Black | 37 (50.7 %) | 8 (61.53 %) | 10 (50 %) | 0.558 |
| Others | 6 (8.2 %) | 0 (0 %) | 0 (0 %) | ND |
P ≤ 0.05 for comparison of all groups, according to analysis of variance (ANOVA) or chi-square tests comparing all groups HIE, Hypoxic ischemic encephalopathy; eCrCl, estimated creatine clearance; AKI-KDIGO, Acute Kidney Injury–Kidney Disease Improved Global Outcome; DReCrCl, Delayed rise in estimated creatinine clearance; ND, not done
For details on the study groups of newborns with HIE, see Definition of the study groups, selection of control HIE newborns without AKI, and standard definition of AKI section
Bonferroni’s multiple comparisons: gestational age (GA): AKI-KDIGO vs. controls = P < 0.05; AKI-KDIGO vs. DReCrCl = P< 0.05; Apgar score: DReCrCl vs. controls = P < 0.05.
Renal status and clinical outcome
The SCr levels on day 1 of life were not different between groups, but they decreased to normal values by the 7th day of life only in the control group [Fig. 1c, d; Electronic Supplementary Material (ESM) Table S1]. Many of the control neonates with HIE were born with SCr values of <1 mg/dl and reached SCr levels of ≤0.5 mg/dl by the 5th day of life. Two patients in the control group (approx. 3 %) died on days 8 and 16 of life without renal complications when their treatment was withdrawn due to severe neurological damage. The remaining patients in the control group showed a rapid clinical recovery. No patients died in the AKI–KDIGO and DReCrCl groups. In comparison to control patients, the patients in these latter two groups required more days of mechanical ventilation and continuous vasopressor therapy, showed higher gentamicin levels, and had a longer hospital stay (Fig. 1e, h). During the first 3 days of life, the average fluid balance was higher in the DReCrCl and AKI–KDIGO groups [median (IQR): 21.3 (1.49–46) and 37.6 (10.31–77.11) ml/kg/day, respectively) compared to the control group [12.79 (IQR 0.2–30.66) ml/kg/day]. However, due to the variability between patients, the difference was statistically significant only between the control and AKI–KDIGO groups (ANOVA, Kruskal–Wallis test, p < 0.003; Dunn’s multiple comparison test, :controls vs. AKI–KDIGO, p < 0.05). As expected, the changes in blood urea nitrogen (BUN) or urine output were less reliable indicators of the renal status (Fig. 2). Finally, no significant differences in total bilirubin levels were found between groups, and the total bilirubin levels were <5.5 ± 3.4 mg/dl (mean ± SD).
Fig. 2.
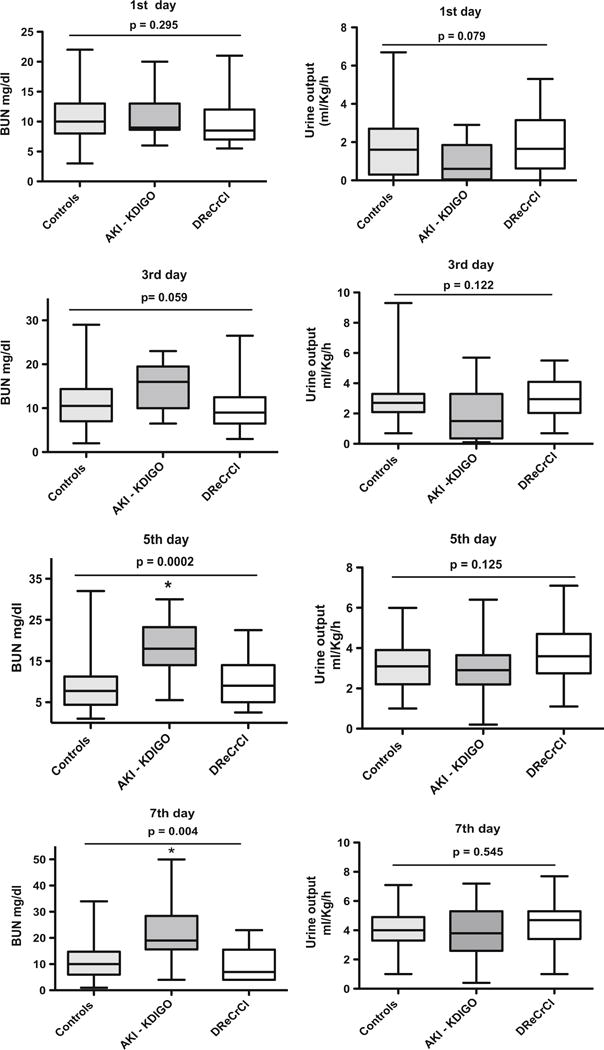
Boxplots of changes in blood urea nitrogen (BUN) and urine output in newborns with hypoxic–ischemic encephalopathy (HIE) during the first week of life. The panels show the changes in BUN and urine output (UOP) in control newborns with HIE (Controls), in the acute kidney injury (AKI)–Kidney Disease Improved Global Outcome group (AKI–KDIGO), and in the delayed rise in estimated creatinine clearance group (DReCrCl). The groups were defined as described in detail in the Definition of the study groups, selection of control HIE newborns without AKI, and standard definition of AKI section. p values were estimated by ANOVAwith multiple post hoc comparisons as described in the Statistical analysis section. *p values on 5th day: p < 0.01 for comparisons of both the AKI–KDIGO group vs. controls, and the AKI–KDIGO group vs. DReCrCl group. *p values on 7th day: p < 0.01 for AKI–KDIGO group vs. controls; p < 0.05 for AKI–KDIGO group vs. DReCrCl group
Rate of decline of SCr on days 3, 5, and 7 of life
Since the rate of decline of SCr has to be interpreted knowing the normal SCr levels, we first performed ROC analysis to define cutoff points for normal SCr levels, and then we assessed the SCr decline on days 3, 5, and 7 of life, respectively (Fig. 3a–d; Table 2). Based on the Youden’s index and ROC analysis, the selected SCr decline cutoff values were ≤33, ≤40 %, and ≤46 % on days 3, 5, and 7 of life, respectively (Fig. 3c, d; Table 3). In addition, we performed logistic regression analysis and ROC curves combining SCr and its rate of decline, which showed higher sensitivity and specificity (Fig. 3e; ESM Table S2).
Fig. 3.
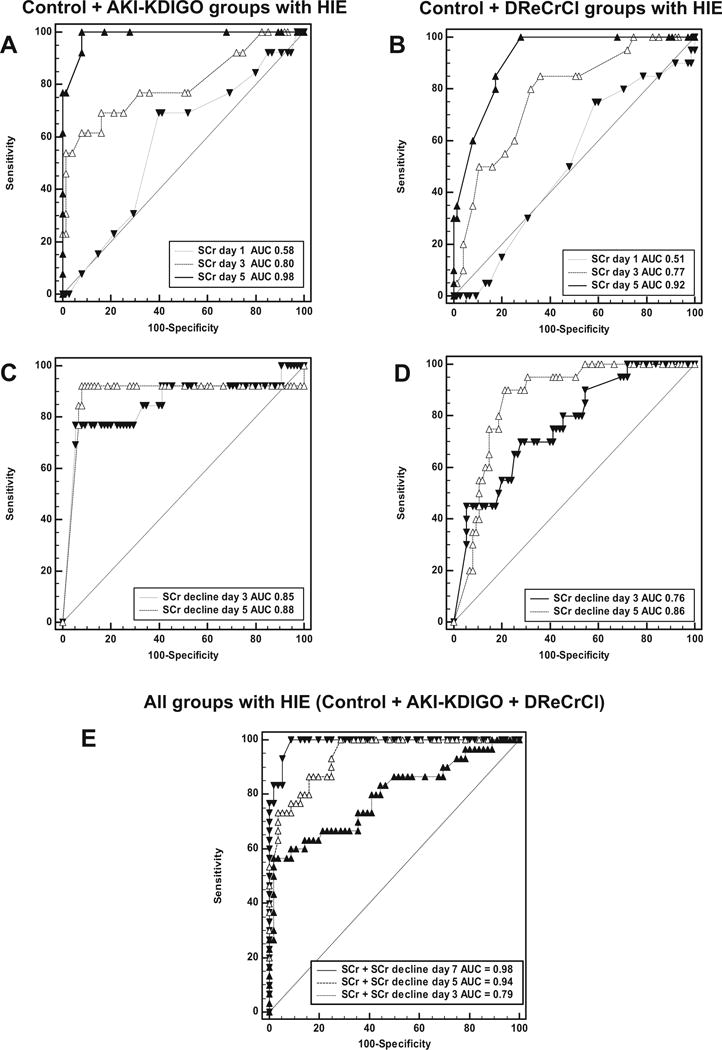
Receiving operational characteristic (ROC) curves for serum creatinine (SCr), rate of SCr decline, and both SCr + SCr decline combined in newborns with hypoxic–ischemic encephalopathy (HIE). a, b ROC curves generated for SCr levels using samples corresponding to the control group (Control) and acute kidney injury (AKI)–Kidney Disease Improved Global Outcome (AKI-KDIGO) group with HIE (a) or the control group and the delayed rise in estimated creatinine clearance (DReCrCl) group with HIE (b). Pairwise comparisons of ROC curves: a Day 1 vs. day 3, p = 0.0147; day 1 vs. day 5, p = 0.0001; day 3 vs. day 5, p = 0.0125; b Day 1 vs. day 3, p = 0.0116; day 1 vs. day 5, p = 0.0001; day 3 vs. day 5, p = 0.0015. c, d ROC curves generated for SCr decline using samples corresponding to the control group and AKI–KDIGO group with HIE (c) or the control group and DReCrCl group with HIE (d). Pairwise comparisons of ROC curves: c Day 3 vs. day 5, p > 0.05; d Day 3 vs. day 5, p = 0.0441. e Logistic regression analysis was performed to develop ROC curves combining the SCr levels with the rate of SCr decline on days of life 3, 5, and 7, as described in the Methods section. Pairwise comparisons of ROC curves: Day 7 vs. day 3, p = 0.0004; day 7 vs. day 5, p = 0.0350; day 5 vs. day 3, p = 0.0011. Dashed line Reference ROC curve for a test with not discriminatory ability. AUC Area under the curve. The cutoff values, sensitivity, specificity, positive and negative likelihood ratios are reported in Tables 2 and 3. and Electronic Supplementary Material (ESM) Table S2
Table 2.
Cutoff points for normal serum creatinine levels in newborns with hypoxic ischemic encephalopathy
| Days | AUC | 95 % CI | p values | SCr cutoff (mg/dl) | Sensitivity | 95 % CI | Specificity | 95 % CI | + LR | − LR |
|---|---|---|---|---|---|---|---|---|---|---|
| Samples from Control group and from AKI–KDIGO group (n = 86) | ||||||||||
| 1 | 0.58 | 0.46–0.64 | 0.354 | >1.15 | 69.23 | 38–90 | 60.00 | 48–71 | 1.73 | 0.51 |
| 3 | 0.80 | 0.70–0.87 | 0.0002 | >0.95 | 61.54 | 31–86 | 92.00 | 83– 97 | 7.69 | 0.42 |
| 5 | 0.98 | 0.93–0.99 | <0.0001 | >0.70 | 100.00 | 75–100. | 92.00 | 83–97 | 12.50 | 0.00 |
| 7 | 0.99 | 0.93–1.00 | <0.0001 | ≥0.70 | 92.32 | 64–99. | 100.00 | 93–100 | 1.00 | |
| Samples from Control group and from DReCrC group (n = 93) | ||||||||||
| 1 | 0.51 | 0.41–0.62 | 0.848 | >1.1 | 75.00 | 51–91 | 41.33 | 3–16 | 0.98 | 1.25 |
| 3 | 0.77 | 00.68–0.85 | <0.0001 | >0.6 | 85.00 | 62–97 | 64.00 | 52–74 | 2.36 | 0.23 |
| 5 | 0.92 | 0.84–0.96 | <0.0001 | >0.5 | 100.00 | 83–100 | 72.00 | 60–82 | 3.57 | 0.00 |
| 7 | 0.95 | 0.88–0.99 | <0.0001 | >0.5 | 100.00 | 80–100 | 80.70 | 68–90 | 5.18 | 0.00 |
| Samples from Control group and from AKI–KDIGO + DReCrCl groups combined (n = 106) | ||||||||||
| 1 | 0.52 | 0.42–0.62 | 0.696 | >0.76 | 93.94 | 79–99 | 14.67 | 8–25 | 1.10 | 0.41 |
| 3 | 0.78 | 0.69–0.86 | <0.0001 | >0.65 | 78.79 | 61–91 | 68.00 | 56–78 | 1.10 | 0.31 |
| 5 | 0.94 | 0.88–0.98 | <0.0001 | >0.60 | 90.91 | 75–98 | 82.67 | 72–90 | 5.24 | 0.11 |
| 7 | 0.96 | 0.88–0.99 | <0.0001 | >0.50 | 100.00 | 88–100 | 80.70 | 68–90 | 5.18 | 0.00 |
Table 2 shows data complementing the results of Fig. 3a–d
AUC, Area under the curve; CI, confidence interval; SCr, serum creatinine; LR, likelihood ratio; AKI-KDIGO, acute kidney injury-kidney disease improved global outcome
Table 3.
Cutoff points for normal serum creatinine decline in newborns with hypoxic ischemic encephalopathy
| Days | AUC | 95 % CI | P values | Cutoff for decline in SCr (%) | Sensitivity | 95 % CI | Specificity | 95 % CI | + LR | − LR |
|---|---|---|---|---|---|---|---|---|---|---|
| Samples from Control group and AIK–KDIGO) group (n = 86) | ||||||||||
| 3 | 0.85 | 0.76–0.91 | <0.0001 | ≤4.44 | 76.92 | 46 – 95 | 94.67 | 87 – 98 | 14.42 | 0.24 |
| 5 | 0.88 | 0.80–0.94 | <0.0001 | ≤9.09 | 92.31 | 64 – 99 | 92.00 | 83 – 97 | 11.54 | 0.084 |
| 7 | 0.96 | 0.88–0.99 | <0.0001 | ≤42.85 | 92.31 | 64 – 99 | 87.50 | 76 – 95 | 7.38 | 0.088 |
| Samples from Control group and DReCrCL group (n = 93) | ||||||||||
| 3 | 0.76 | 0.66–0.84 | <0.0001 | ≤33.33 | 70.00 | 46 – 88 | 72.00 | 60 – 82 | 2.50 | 0.42 |
| 5 | 0.86 | 0.77–0.92 | <0.0001 | ≤40 | 90.00 | 68 – 99 | 78.67 | 67 – 87 | 4.22 | 0.13 |
| 7 | 0.90 | 0.81–0.96 | <0.0001 | ≤45.45 | 88.24 | 63 – 98 | 80.36 | 67 – 89. | 4.49 | 0.15 |
| Samples from Control group and KDIGO + DReCrCl groups combined (n = 106) | ||||||||||
| 3 | 0.78 | 0.70–0.86 | <0.0001 | ≤9.09 | 57.58 | 39 – 74 | 94.67 | 87 – 98 | 10.8 | 0.45 |
| 5 | 0.87 | 0.79–0.92 | <0.0001 | ≤40.00 | 90.91 | 76 – 98 | 78.67 | 68 – 87 | 4.26 | 0.12 |
| 7 | 0.93 | 0.85–0.97 | <0.0001 | ≤46.66 | 93.33 | 78 – 99 | 78.57 | 66 – 88 | 4.36 | 0.08 |
Table 3 shows data complementing the results of Fig. 3a–d
Changes in urinary NGAL and EGF levels
As reported previously [26], the urinary NGAL levels were higher in newborns with HIE than in healthy controls (Fig. 4a). However, within a subset of newborns with HIE, no significant differences in urinary NGAL levels were noted between neonates with and without AKI (defined based on the KDIGO and DReCrCl criteria combined), and the AUC for NGAL was not statistically significant (0.62; p = 0.31). In contrast, newborns with HIE + AKI showed lower urinary EGF levels when compared to both healthy and HIE control newborns (Fig. 4b). Moreover, ROC analysis for EGF [AUC 0.75, 95 % confidence interval (CI) 0.53–0.91; p ≤ 0.014] showed that a cutoff value of ≤1.750 pg/ml during the first day of life provided 70 % sensitivity (95 % CI 34.8–93.3) and 75 % specificity (95 % CI 42.8–94.5) to diagnose or predict AKI at this time point (Fig. 4c; Table 4).
Fig. 4.
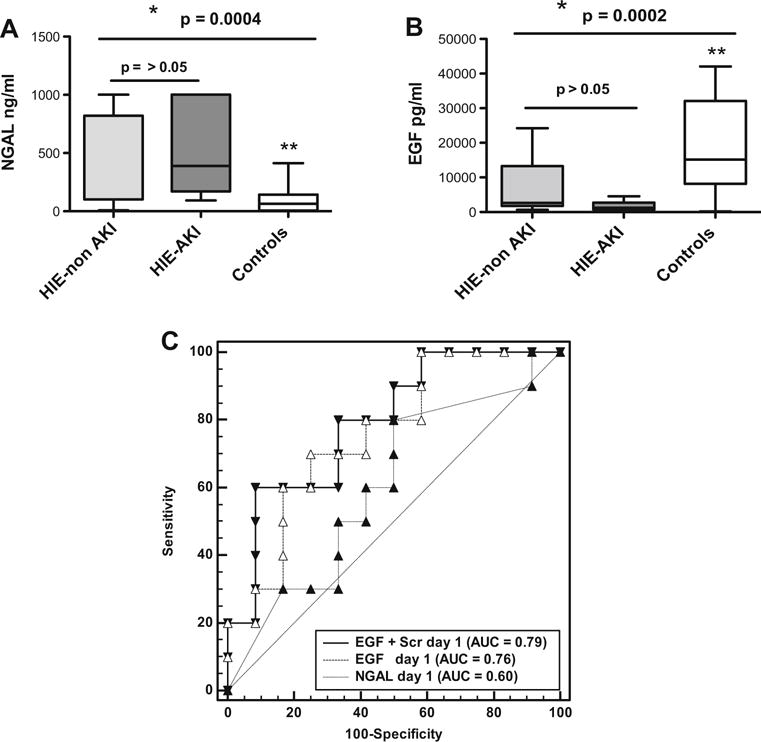
Predictive ability of urinary neutrophil associated gelatinase lipocalin (NGAL) and epidermal growth factor (EGF) to diagnose acute kidney injury (AKI) in term newborns with hypoxic–ischemic encephalopathy (HIE) during the first week of life. AKI was defined using the KDIGO + DReCrCl criteria combined, as described in the Methods section. a, b Boxplots of urinary levels of NGAL (a) and EGF (b) measured during the first day of life in newborns with HIE +AKI (HIE–AKI; n = 10), with HIE but without AKI (HIE–non AKI; n =15), and healthy term newborns (Controls; n = 27). *p values were estimated by ANOVA according to the Kruskal–Wallis test, followed by Dunn’s multiple comparisons test. a Significance: **Control group vs. HIE-non AKI group, p < 005; Control group vs. HIE–AKI group, p < 0.05; *HIE–non AKI group vs. HIE–AKI group, p > 0.05. b Significance **Control group vs. HIE–AKI group, p < 0.05; control group vs. HIE–non AKI group, p > 0.05; *HIE–non AKI group vs. HIE–AKI group, p > 0.05. c ROC curves generated for EGF, NGAL, and EGF + sCr combined, in HIE newborns with and without AKI (n = 25). The AUC for NGAL, EGF, and EGF + SCr is also shown in c. p values for all pairwise AUCs comparisons were > 0.05. The dashed reference line represents a ROC curve for a test with not discriminatory ability. EGF cutoff values and their sensitivity/specificity are given in Table 4.
Table 4.
Cutoff points to assess the renal status of newborns with hypoxic ischemic encephalopathy (1st week of life)
| Days of life | Serum Cr (mg/dl) | Rate of decline SCr since birth | Urinary EGF (pg/ml) |
|---|---|---|---|
| High-risk cutoff | |||
| 1st to 2nd | ≥1.3 (18–79 %) | ≤ 0 % (ND) | ≤2,650 (80–42 %) |
| 3rd | ≥0.8 (57–84 %) | ≤ 40 % (76–59 %) | ≤1,515 (33–79 %) |
| 5th | ≥0.7 (76–92 %) | ≤ 46 % (91–71 %) | ND |
| 7th | ≥0.6 (77–96 %) | ≤ 55 % (100–64 %) | ≤8,767 (100–50 %) |
| Injury cutoff | |||
| 1st to 2nd | ≥1.5 (9–90 %) | ≤ 0 % (ND) | ≤1750 (70–75 %) |
| 3rd | ≥0.9 (54–89 %) | ≤ 33 % (73–72 %) | ≤1,283 (22–85 %) |
| 5th | ≥0.8 (76–92 %) | ≤ 40 % (91–79 %) | ND |
| 7th | ≥0.7 (63–100 %) | ≤ 46 % (93–79 %) | ≤1,088 (14–100 %) |
| Failure cutoff | |||
| 1st to 2nd | ≥1.6 (6–97 %) | ≥ 0.3 since birth | ≤1,750 (70–75 %) |
| 3rd | ≥1.0 (33–96 %) | ≥ 0.3 within last 48 ha | ≤1,283 (22–85 %) |
| 5th | ≥0.9 (51–98 %) | ≥ 0.3 within last 48 ha | ND |
| 7th | ≥0.8 (63–100 %) | ≥ 0.3 within last 48 ha | ≤1,088 (14–100 %) |
Values in parenthesis are sensitivity–specificity
Scr, Serum creatinine; EGF, epidermal growth factor; ND, not determined
Based on a modified KDIGO–AKI) definition for neonates [16]
New approach to define AKI in term-newborns with HIE during the first week of life
Based on the clinical data and the ROC analysis reported above, we tabulated cutoff points for SCr, rate of SCr decline, and urinary EGF (Table 4) that identify newborns with HIE at higher risk of AKI, and those undergoing AKI according to the KDIGO or DReCRCl definitions used alone or combined.
Discussion
We found that the rate of decline of SCr during the first week of life constitutes a sensitive biomarker tool to assess the renal status of term newborns with HIE. Moreover, our data suggest that KDIGO definitions of neonatal AKI are not sensitive enough to identify all newborns undergoing clinical complications consistent with the early stages of AKI during the first week of life. Therefore, we propose that a new definition of AKI based on the rate of decline of the SCr will improve our ability to identify all newborns with AKI and/or facilitate the discovery and validation of more sensitive biomarkers of AKI during this time.
AKI is defined by an abrupt decrease in kidney function and is best evaluated by measuring the GFR. However, given the difficulties involved in measuring the GFR in clinical practice, the diagnosis of AKI is commonly made by assessing changes in urine output (UOP), eCrCl, and/or SCr levels. For example, a small rise in SCr has been associated with an increased risk of death and length of hospital stay in adults [31], as well as a longer duration of mechanical ventilation and intensive care stay in children undergoing cardiac surgery [32]. Studies in newborns have used several definitions of AKI, ranging from a SCr value of >1.5 mg/dl, BUN level of >20 mg/dl on one or two occasions, and UOP of <1 ml/kg/h [7], However, a SCr value of >1.5 mg/dl may represent a later stage of the AKI process, and oliguria may be absent in neonates with AKI [9]. Alternatively, two definitions of AKI for adults (AKIN and pRIFLE) [10, 11] have been adapted for young children, and a modified KDIGO definition based on changes in SCr alone has been used in newborns [16, 17]. However, these definitions have not been truly tested in newborns during the first week of life, and the evaluation of renal function in newborns continues to be a matter of extensive research [7, 13, 16]. The GFR during the first few hours of life reflects the functional renal status in utero [22], when the fetal excretory function is performed by the placenta with minimal contribution of the kidney. Thus, the high plasma creatinine levels observed during the first days of life are primarily the result of an immature renal function plus the load of maternal creatinine [14]. Subsequently, there is a rapid increase in renal function during the first 3 days of life [22], and this is the critical period of time where we need a more sensitive definition of AKI and more reliable biomarkers.
Therefore, considering the low GFR and the rapid improvement in renal function expected during the first days of life, we hypothesized that the failure to decrease the SCr levels at the expected rate during the first week of life indicates that the GFR is impaired, even if the SCr levels do not increase. In agreement with this notion, we found that approximately 19 % of the newborns in our cohort showed a rate of decline of the SCr level of <50 % during the first week of life and developed similar clinical complications as newborns diagnosed with AKI according to the modified KDIGO neonatal definition. Both groups of patients required more days of mechanical ventilation and an increased length of stay, developed more fluid overload, required more continuous vasopressor drugs, and had higher gentamicin levels when compared to the control group. In particular, considering that gentamcin was given on a milligram per kilogram body weight basis, then higher levels indicate poorer function at all levels of SCr.
An interesting finding of our study is that the rate of decline of SCr in control newborns with HIE was similar to that reported in healthy term newborns [14, 24, 25]. Moreover, the SCr values were within the range of SCr levels reported on day 7 of life using enzymatic assays (0.38–0.45 mg/dl) [16, 27]. As expected, the SCr levels during the first day of life were elevated, reflecting the maternal SCr values. Previous studies showed that the SCr rise on day 1 after birth [33] and the SCr levels on day 1 of life are higher than those measured in paired samples of cord blood [14]. The authors speculate that the difference (approx. 0.1 mg/dl) may reflect hemoconcentration, resulting from early fluid loss in the postnatal period. Unfortunately, the maternal or cord blood creatinine levels were not available for analysis in our study. Nonetheless, our data suggest that SCr levels of >0.3 mg/dl above the expected maternal or umbilical cord creatinine levels (approx. 0.9 mg/dl), in combination with low urinary EGF values (Table 4), may facilitate the identification of patients at higher risk of AKI. We also found that a rate of SCr decline of <30, <40, and <46 % on days 3, 5 and 7 of life, respectively, can identify HIE newborns undergoing impaired renal function.
In the kidney, NGAL is synthesized mainly by distal tubular epithelial cells [34] and is considered to be a sensitive biomarker of AKI in critically ill children and infants [28, 35–38]. However, we found that the urinary levels of NGAL did not offer early sensitivity and/or improved specificity for the identification of AKI in term newborns with HIE during the first days of life. Thus, as reported previously in critically ill newborns [38, 39], NGAL appears to be a marker of systemic illness, as opposed to a specific marker of AKI, at least in newborns with HIE during the first days of life. In contrast, as reported in other studies [26, 40], low urinary EGF levels appear to be a more specific biomarker of AKI in critically ill newborns. Nonetheless, a larger sample size is needed to validate these findings.
Our study has several limitations, including its retrospective nature, lack of normal controls without exposure to gentamicin and HIE, lack of maternal SCr measurements at birth, renal imaging studies, direct GFR measurements, and long-term clinical follow-up. While some of the selected clinical outcomes reflect the integrity of renal function (e.g., fluid balance, gentamicin clearance), others arguably may be more non-specific indicators of systemic illness. However, that patients in the DReCrCl group showed similar clinical complications to the AKI–KDIGO group, as well as an abnormal rate of SCr decline when compared to healthy and hospitalized newborns [15, 20] support the notion that the KDIGO definition is not sensitive enough to identify all newborns with AKI during the first week of life. The laboratory at Children’s Hospital uses the kinetic Jaffé method to measure SCr, and several factors, including high serum bilirubin levels, can interfere with the SCr measurements [25]. However, we found no significant differences in total bilirubin levels between groups, and the SCr values measured on day 7 were within the range of the values reported with enzymatic assays [33, 41]. Finally, the small sample size used to explore the clinical value of urinary NGAL and EGF limited our ability to reach a definitive conclusion regarding the role of these biomarkers in newborns with HIE.
In summary, we have shown that the rate of decline of SCr measured on days 3, 5, and 7 of life provides reliable information to assess the renal status of term newborns with HIE during the first week of life, and have generated cutoff values to follow the normal rate of SCr decline in these neonates (Table 4). We propose that a more sensitive definition of AKI based on the rate of decline of SCr during the first week of life may facilitate the identification of all newborns undergoing renal injury, as well as the early initiation of renal protective medical therapies. This new definition could also facilitate the discovery and validation of more sensitive biomarkers of AKI during this time. Further prospective studies with longitudinal follow-up and renal outcome assessment in this population are warranted to validate our findings and to determine whether a similar approach could be used in newborns with other critically illnesses.
Supplementary Material
Acknowledgments
We thank Sofia Perazzo for assistance in data analysis and presentation and Glenn M. Chertow for helpful discussions. This study was supported by National Institutes of Health (NIH) awards R0-1 HL-102497, R01-DK 49419, and U54HD071601.
Footnotes
Electronic supplementary material The online version of this article (doi:10.1007/s00467-016-3317-5) contains supplementary material, which is available to authorized users.
Conflict of interest The authors declare no conflict of interest.
Ethics statement This Institutional Review Board at Children’s National Health System approved the study protocol in adherence to the Declaration of Helsinki and waived the need for consent.
References
- 1.Shankaran S. Outcomes of hypoxic-ischemic encephalopathy in neonates treated with hypothermia. Clin Perinatol. 2014;41:149–159. doi: 10.1016/j.clp.2013.10.008. [DOI] [PubMed] [Google Scholar]
- 2.Shankaran S, Laptook AR, Ehrenkranz RA, Tyson JE, McDonald SA, Donovan EF, Fanaroff AA, Poole WK, Wright LL, Higgins RD, Finer NN, Carlo WA, Duara S, Oh W, Cotten CM, Stevenson DK, Stoll BJ, Lemons JA, Guillet R, Jobe AH, National Institute of Child H Human Development Neonatal Research N Wholebody hypothermia for neonates with hypoxic-ischemic encephalopathy. N Engl J Med. 2005;353:1574–1584. doi: 10.1056/NEJMcps050929. [DOI] [PubMed] [Google Scholar]
- 3.Shankaran S, Laptook AR, McDonald SA, Higgins RD, Tyson JE, Ehrenkranz RA, Das A, Sant’Anna G, Goldberg RN, Bara R, Walsh MC, Eunice Kennedy Shriver National Institute of Child H, Human Development Neonatal Research Network Temperature profile and outcomes of neonates undergoing whole body hypothermia for neonatal hypoxic-ischemic encephalopathy. Pediatr Crit Care Med. 2012;13:53–59. doi: 10.1097/PCC.0b013e31821926bc. [DOI] [PMC free article] [PubMed] [Google Scholar]
- 4.Sarkar S, Askenazi DJ, Jordan BK, Bhagat I, Bapuraj JR, Dechert RE, Selewski DT. Relationship between acute kidney injury and brain MRI findings in asphyxiated newborns after therapeutic hypothermia. Pediatr Res. 2014;75:431–435. doi: 10.1038/pr.2013.230. [DOI] [PubMed] [Google Scholar]
- 5.Selewski DT, Jordan BK, Askenazi DJ, Dechert RE, Sarkar S. Acute kidney injury in asphyxiated newborns treated with therapeutic hypothermia. J Pediatr. 2013;162(725–729):e721. doi: 10.1016/j.jpeds.2012.10.002. [DOI] [PubMed] [Google Scholar]
- 6.Thomas ME, Blaine C, Dawnay A, Devonald MA, Ftouh S, Laing C, Latchem S, Lewington A, Milford DV, Ostermann M. The definition of acute kidney injury and its use in practice. Kidney Int. 2015;87:62–73. doi: 10.1038/ki.2014.328. [DOI] [PubMed] [Google Scholar]
- 7.Askenazi DJ, Ambalavanan N, Goldstein SL. Acute kidney injury in critically ill newborns: what do we know? What do we need to learn? Pediatr Nephrol. 2009;24:265–274. doi: 10.1007/s00467-008-1060-2. [DOI] [PMC free article] [PubMed] [Google Scholar]
- 8.Drukker A, Guignard JP. Renal aspects of the term and preterm infant: a selective update. Curr Opin Pediatr. 2002;14:175–182. doi: 10.1097/00008480-200204000-00006. [DOI] [PubMed] [Google Scholar]
- 9.Karlowicz MG, Adelman RD. Nonoliguric and oliguric acute renal failure in asphyxiated term neonates. Pediatr Nephrol. 1995;9:718–722. doi: 10.1007/BF00868721. [DOI] [PubMed] [Google Scholar]
- 10.Mehta RL, Kellum JA, Shah SV, Molitoris BA, Ronco C, Warnock DG, Levin A, Acute Kidney Injury N Acute Kidney Injury Network: report of an initiative to improve outcomes in acute kidney injury. Crit Care. 2007;11:R31. doi: 10.1186/cc5713. [DOI] [PMC free article] [PubMed] [Google Scholar]
- 11.Akcan-Arikan A, Zappitelli M, Loftis LL, Washburn KK, Jefferson LS, Goldstein SL. Modified RIFLE criteria in critically ill children with acute kidney injury. Kidney Int. 2007;71:1028–1035. doi: 10.1038/sj.ki.5002231. [DOI] [PubMed] [Google Scholar]
- 12.Kidney Disease: Improving Global Outcomes (KDIGO) Acute Kidney Injury Work Group. KDIGO clinical practice guidelines for acute kidney injury. Section 2: AKIdefinition. Kidney Int Suppl. 2012;2:19–36. [Google Scholar]
- 13.Schwartz GJ, Furth SL. Glomerular filtration rate measurement and estimation in chronic kidney disease. Pediatr Nephrol. 2007;22:1839–1848. doi: 10.1007/s00467-006-0358-1. [DOI] [PubMed] [Google Scholar]
- 14.Schwartz GJ, Feld LG, Langford DJ. A simple estimate of glomerular filtration rate in full-term infants during the first year of life. J Pediatr. 1984;104:849–854. doi: 10.1016/s0022-3476(84)80479-5. [DOI] [PubMed] [Google Scholar]
- 15.Schwartz GJ, Brion LP, Spitzer A. The use of plasma creatinine concentration for estimating glomerular filtration rate in infants, children, and adolescents. Pediatr Clin North Am. 1987;34:571–590. doi: 10.1016/s0031-3955(16)36251-4. [DOI] [PubMed] [Google Scholar]
- 16.Jetton JG, Askenazi DJ. Update on acute kidney injury in the neonate. Curr Opin Pediatr. 2012;24:191–196. doi: 10.1097/MOP.0b013e32834f62d5. [DOI] [PMC free article] [PubMed] [Google Scholar]
- 17.Selewski DT, Charlton JR, Jetton JG, Guillet R, Mhanna MJ, Askenazi DJ, Kent AL. Neonatal acute kidney injury. Pediatrics. 2015;136:e463–e473. doi: 10.1542/peds.2014-3819. [DOI] [PubMed] [Google Scholar]
- 18.Singbartl K, Kellum JA. AKI in the ICU: definition, epidemiology, risk stratification, and outcomes. Kidney Int. 2012;81:819–825. doi: 10.1038/ki.2011.339. [DOI] [PubMed] [Google Scholar]
- 19.Alinei P, Guignard JP. Assessment of glomerular filtration rate in infants. Comparison of three methods used in clinical practice. Helv Paediatr Acta. 1987;42:253–262. [PubMed] [Google Scholar]
- 20.Guignard JP, Torrado A, Feldman H, Gautier E. Assessment of glomerular filtration rate in children. Helv Paediatr Acta. 1980;35:437–447. [PubMed] [Google Scholar]
- 21.Barnett HL, Hare WK, McNamara H, Hare RS. Influence of postnatal age on kidney function of premature infants. Proc Soc Exp Biol Med. 1948;69:55–57. doi: 10.3181/00379727-69-16616p. [DOI] [PubMed] [Google Scholar]
- 22.Leake RD, Trygstad CW, Oh W. Inulin clearance in the newborn infant: relationship to gestational and postnatal age. Pediatr Res. 1976;10:759–762. doi: 10.1203/00006450-197608000-00013. [DOI] [PubMed] [Google Scholar]
- 23.Sertel H, Scopes J. Rates of creatinine clearance in babies less than one week of age. Arch Dis Child. 1973;48:717–720. doi: 10.1136/adc.48.9.717. [DOI] [PMC free article] [PubMed] [Google Scholar]
- 24.Aperia A, Broberger O, Elinder G, Herin P, Zetterstrom R. Postnatal development of renal function in pre-term and full-term infants. Acta Paediatr Scand. 1981;70:183–187. doi: 10.1111/j.1651-2227.1981.tb05539.x. [DOI] [PubMed] [Google Scholar]
- 25.Feldman H, Guignard JP. Plasma creatinine in the first month of life. Arch Dis Child. 1982;57:123–126. doi: 10.1136/adc.57.2.123. [DOI] [PMC free article] [PubMed] [Google Scholar]
- 26.Hoffman SB, Massaro AN, Soler-Garcia AA, Perazzo S, Ray PE. A novel urinary biomarker profile to identify acute kidney injury (AKI) in critically ill neonates: a pilot study. Pediatr Nephrol. 2013;28:2179–2188. doi: 10.1007/s00467-013-2524-6. [DOI] [PMC free article] [PubMed] [Google Scholar]
- 27.Carmody JB, Swanson JR, Rhone ET, Charlton JR. Recognition and reporting of AKI in very low birth weight infants. Clin J Am Soc Nephrol. 2014;9:2036–2043. doi: 10.2215/CJN.05190514. [DOI] [PMC free article] [PubMed] [Google Scholar]
- 28.Wai K, Soler-Garcia AA, Perazzo S, Mattison P, Ray PE. A pilot study of urinary fibroblast growth factor-2 and epithelial growth factor as potential biomarkers of acute kidney injury in critically ill children. Pediatr Nephrol. 2013;28:2189–2198. doi: 10.1007/s00467-013-2543-3. [DOI] [PMC free article] [PubMed] [Google Scholar]
- 29.Askenazi DJ, Montesanti A, Hunley H, Koralkar R, Pawar P, Shuaib F, Liwo A, Devarajan P, Ambalavanan N. Urine biomarkers predict acute kidney injury and mortality in very low birth weight infants. J Pediatr. 2011;159(907–912):e901. doi: 10.1016/j.jpeds.2011.05.045. [DOI] [PMC free article] [PubMed] [Google Scholar]
- 30.Grund B, Sabin C. Analysis of biomarker data: logs, odds ratios, and receiver operating characteristic curves. Curr Opin HIV AIDS. 2010;5:473–479. doi: 10.1097/COH.0b013e32833ed742. [DOI] [PMC free article] [PubMed] [Google Scholar]
- 31.Chertow GM, Burdick E, Honour M, Bonventre JV, Bates DW. Acute kidney injury, mortality, length of stay, and costs in hospitalized patients. J Am Soc Nephrol. 2005;16:3365–3370. doi: 10.1681/ASN.2004090740. [DOI] [PubMed] [Google Scholar]
- 32.Zappitelli M, Bernier PL, Saczkowski RS, Tchervenkov CI, Gottesman R, Dancea A, Hyder A, Alkandari O. A small post-operative rise in serum creatinine predicts acute kidney injury in children undergoing cardiac surgery. Kidney Int. 2009;76:885–892. doi: 10.1038/ki.2009.270. [DOI] [PubMed] [Google Scholar]
- 33.Pottel H, Vrydags N, Mahieu B, Vandewynckele E, Croes K, Martens F. Establishing age/sex related serum creatinine reference intervals from hospital laboratory data based on different statistical methods. Clin Chim Acta. 2008;396:49–55. doi: 10.1016/j.cca.2008.06.017. [DOI] [PubMed] [Google Scholar]
- 34.Paragas N, Qiu A, Zhang Q, Samstein B, Deng SX, Schmidt-Ott KM, Viltard M, Yu W, Forster CS, Gong G, Liu Y, Kulkarni R, Mori K, Kalandadze A, Ratner AJ, Devarajan P, Landry DW, D’Agati V, Lin CS, Barasch J. The Ngal reporter mouse detects the response of the kidney to injury in real time. Nat Med. 2011;17:216–222. doi: 10.1038/nm.2290. [DOI] [PMC free article] [PubMed] [Google Scholar]
- 35.Mishra J, Ma Q, Prada A, Mitsnefes M, Zahedi K, Yang J, Barasch J, Devarajan P. Identification of neutrophil gelatinase-associated lipocalin as a novel early urinary biomarker for ischemic renal injury. J Am Soc Nephrol. 2003;14:2534–2543. doi: 10.1097/01.asn.0000088027.54400.c6. [DOI] [PubMed] [Google Scholar]
- 36.Wheeler DS, Devarajan P, Ma Q, Harmon K, Monaco M, Cvijanovich N, Wong HR. Serum neutrophil gelatinase-associated lipocalin (NGAL) as a marker of acute kidney injury in critically ill children with septic shock. Crit Care Med. 2008;36:1297–1303. doi: 10.1097/CCM.0b013e318169245a. [DOI] [PMC free article] [PubMed] [Google Scholar]
- 37.Lavery AP, Meinzen-Derr JK, Anderson E, Ma Q, Bennett MR, Devarajan P, Schibler KR. Urinary NGAL in premature infants. Pediatr Res. 2008;64:423–428. doi: 10.1203/PDR.0b013e318181b3b2. [DOI] [PubMed] [Google Scholar]
- 38.Parravicini E. The clinical utility of urinary neutrophil gelatinase-associated lipocalin in the neonatal ICU. Curr Opin Pediatr. 2010;22:146–150. doi: 10.1097/MOP.0b013e3283369e78. [DOI] [PubMed] [Google Scholar]
- 39.Parravicini E, Nemerofsky SL, Michelson KA, Huynh TK, Sise ME, Bateman DA, Lorenz JM, Barasch JM. Urinary neutrophil gelatinase-associated lipocalin is a promising biomarker for late onset culture-positive sepsis in very low birth weight infants. Pediatr Res. 2010;67:636–640. doi: 10.1203/PDR.0b013e3181da75c1. [DOI] [PMC free article] [PubMed] [Google Scholar]
- 40.Chen L, Liu W. Effect of asphyxia on urinary epidermal growth factor levels in newborns. J Tongji Med Univ. 1997;17:144–146. doi: 10.1007/BF02888289. [DOI] [PubMed] [Google Scholar]
- 41.Boer DP, de Rijke YB, Hop WC, Cransberg K, Dorresteijn EM. Reference values for serum creatinine in children younger than 1 year of age. Pediatr Nephrol. 2010;25:2107–2113. doi: 10.1007/s00467-010-1533-y. [DOI] [PMC free article] [PubMed] [Google Scholar]
Associated Data
This section collects any data citations, data availability statements, or supplementary materials included in this article.