

Abstract
Objective
T-lymphocytes are potential initiators and regulators of adipose tissue (AT) inflammation, but there is limited human data on omental AT. Our aim was to assess the relationship between T-cells, particularly Foxp3+ regulatory T (Treg) cells, in human subcutaneous (subQ) and omental AT and type 2 diabetes risk.
Methods
We collected subQ and deep subcutaneous (DsubQ) abdominal and omental AT biopsies from 44 patients (body mass index (BMI)≥25) undergoing elective abdominal surgery. Flow cytometry was used to quantify CD4+ T-cell (T effector and Treg) and macrophages (M1 and M2), and systemic inflammation was measured in fasting blood.
Results
Tregs were significantly lower in omental versus subQ and DsubQ AT and M1 cell counts were significantly higher in the omental and DsubQ depot relative to the subQ. Only omental AT Tregs were negatively associated with fasting glucose and MCP-1 and positively associated with HOMA-β. M1 and M2 cell counts across multiple depots had significant relationships with HOMA-IR, TNF-α, insulin and HOMA-β. All relationships were consistent across ethnicities.
Conclusions
Tregs were significantly lower in omental versus both subQ adipose depots. Fewer omental Tregs may have metabolic implications based on depot specific relationship with higher fasting glucose and lower beta-cell function.
Keywords: Adipose tissue, adipocytes, blood glucose, omental, immunology
Introduction
Obesity increases risk for type 2 diabetes but the exact pathophysiology is not fully understood. One of the primary theories lies in the inflammatory properties of enlarged adipose tissue (AT) (1–3). Prior work relating to AT biology in humans is almost exclusively limited to studies in Caucasians, overlooking important racial/ethnic variability in the link between obesity, fat distribution, inflammation and type 2 diabetes risk. This limitation is significant since prior work has shown that the conventional wisdom linking visceral AT to greater metabolic risk does not hold true for African Americans, who have lower intra-abdominal fat but higher metabolic risk compared to Caucasians and Hispanics (4).
Macrophages were one of the first cell types discovered in the burgeoning field of AT inflammation and immunometabolism, however there are a host of other immune cells involved in the inflammatory cascade, including Foxp3+ regulatory T cells (Tregs) (5). While obesity is associated with an increase in inflammatory immune cells, there is recent evidence to suggest that Tregs decrease in the context of obesity (6). Tregs regulate self-tolerance and immunosuppression (7, 8), and with their ability to dampen the inflammatory response of a large range of cell populations (5), they may be central to controlling the transition from healthy AT functioning to chronic pathological inflammation.
While the presence of Tregs in human AT has been demonstrated, the association between Tregs, body weight, and diabetes risk in humans is limited (9–13). Therefore, the aim of this study was to use live cell sorting to determine the relative quantity of Foxp3+ Treg cells, CD4+ Teffector cells, and macrophage populations (anti-inflammatory CD45+CD14+CD163+-M2 and pro-inflammatory CD45+CD14+CD163−-M1), paired with immunohistochemistry quantification of macrophages (CLS), across multiple adipose depots, including the omentum. Our objectives were threefold: 1) to characterize the immune cell repertoire of multiple AT depots in patients who are overweight or obese, 2) examine relationships between immune cells in circulation and AT with fasting markers of type 2 diabetes risk, and 3) test whether these associations differed by race/ethnicity. We hypothesized increased AT inflammation in the omental relative to subcutaneous depot and that lower levels of omental Treg would be related to increased diabetes risk. We further hypothesized that omental Tregs would be lowest in African Americans with obesity followed by Hispanics and white patients, potentially contributing to observed health disparities in these racial/ethnic groups.
Methods
This study was conducted at the University of Southern California (USC) Health Sciences Campus, Keck Hospital of USC and Los Angeles County+USC Medical Center. Forty-four patients (body mass index (BMI) >25 kg/m2) who underwent elective abdominal surgery (bariatric, cholecystectomy or hernia repair) were recruited for this study, and a subset thirty-seven has complete flow cytometry data. These male and female participants were between 20–56 years of age, without type 1 or type 2 diabetes, and did not use related medications. Patients with inflammatory disease or uncontrolled systemic disease were excluded. Prior to sample collection, informed written consent was obtained from the participant. The USC Institutional Review Board approved this study.
Participant Characteristics
Anthropometry, including height, weight and BMI, and medical history were collected from patient medical records. Participants self-identified their race/ethnicity upon consent to study.
Sample Collection
Prior to onset of surgery, 12 mL of blood was collected (8 mL for flow cytometry and 4 mL for fasting blood sample). During the surgery, ~2 grams of AT were collected from each abdominal depot: subQ just adjacent to the skin, DsubQ superficial to the rectus abdominus fascia (14), and intra-abdominally from the omental depot. AT was rinsed 3 times with cold sterile saline, 100 mg was immediately fixed in zinc-formalin for histology and the remaining sample (~1.5 g) was placed in ice cold PBS for flow cytometry.
Adipose Tissue Histology
AT samples were placed in zinc-formalin for 24 hours, rinsed and transferred to 70% ethanol for immunohistochemistry. Four consecutive, 5-micron sections of AT were stained with hematoxylin-eosin and CD68 antibody (Leica Biosystems, Newcastle, UK). For each depot, four independent fields at 20× magnification were captured from the first mounted section on each slide for cell sizing. Adipose cell size (µm2) was obtained using Fiji quantitative microscopy software (15), and the mean value for adipose cell size was obtained per depot. Similar to our previous study (16), all sections were examined by a single blinded technician for the presence or absence of macrophage crown-like structures (CLS).
Flow Cytometry: AT and Blood
Fresh AT samples were weighed and digested with 200 U/ml Type-IV-collagenase (Worthington Biochemical Corporation, Lakewood, NJ) at 37°C for one hour. Ficoll density centrifugation was used to collect plasma and mononuclear cells from the whole blood sample. Cells from the stromal vascular fraction of the AT and blood sample were stained with the following antibodies surface markers: CD45, CD4, CD14, CD25, CD163 (ebioscience, San Diego, CA). Thereafter, cells were fixed, permeabilized and stained for the intracellular FOXP3 expression (ebioscience, San Diego, CA) Macrophage/monocytes and T cell subsets were then isolated using the 8-color BD FACS Aria III cell sorter and data was acquired using BD FACS Diva (BD Bioscience, San Jose, CA). The following gating strategies were used to isolate the immune cells of interest: CD45+CD14+CD163− cells was used to isolate M1 macrophages, CD45+CD14+CD163+ was used to isolate M2 macrophages, CD45+CD4+CD25+FOXP3+ was used to isolate regulatory T cells, CD45+CD4+CD25+FOXP3− was used to isolate T effector cells (Figure 1). Flowjo X software (Ashland, OR) was used to quantify the number of CD45+CD14+CD163−-M1, CD45+CD14+CD163+-M2, Treg and Teff subsets, which were back calculated to the total cell count and normalized to the AT weight or mL blood as previously described (17). We selected cells/g or cells/mL as our normalization strategy since it could be compared across all cell types and since % cell can be altered by the presence of other cell types (18, 19).
Figure 1. FACS gating strategy and representative plots.
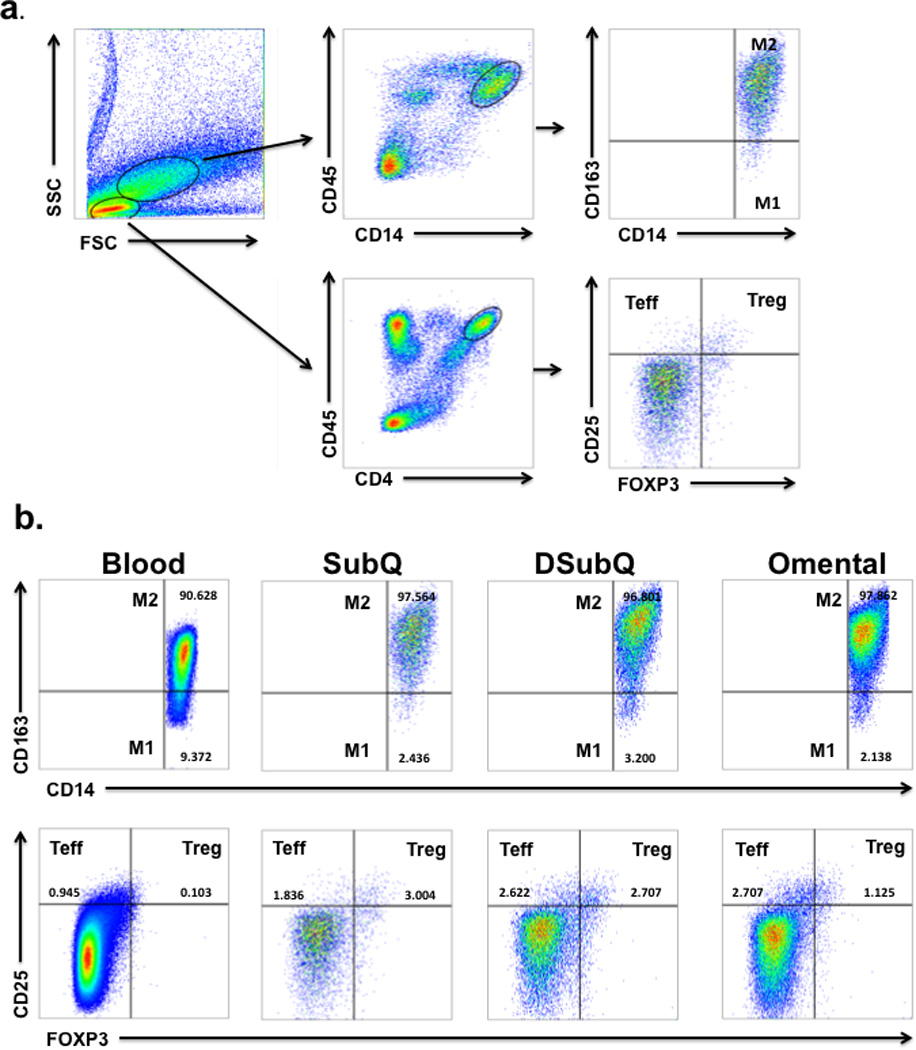
a. Gating strategy used to determine M1, M2, Treg and Teff cells in blood and adipose tissue. Treg (CD25+FOXP3+) and Teff (CD25+FOXP3−) cells were determined from CD45+CD4+ cells after gating on lymphocytes based on their forward and side scatter properties. M1 Macrophages (CD14+CD163−) and M2 Macrophages (CD14+CD163+) were determined from CD45+CD14+ cells after gating on macrophages based on their forward and side scatter properties. b. Representative FACS plot of immune cells isolated from whole blood and the Stromal Vascular Fraction from Subcutaneous (SubQ), Deep Subcutaneous (DSubQ) and Omental adipose tissue. The frequency of M1, M2, Treg and Teff cells are highlighted in the figure.
Assays and Metabolic Measures
Glucose was assayed on a Yellow Springs Instrument 2710 Analyzer (Yellow Springs, OH) using the glucose oxidase method, and insulin was assayed using a specific human ELISA kit from EMD Millipore (St. Charles, MO). Adipocytokines (including, IL-6, MCP-1, TNF-α) and leptin were assayed using the magnetic bead-based multiplex ELISA (#HADK2MAG-61K-08, EMD-Millipore) on a Luminex MAGPIX (intra-assay and inter-assay variability of <10%). CRP was assayed using a human ELISA kit from Millipore (St. Charles, MO). Homeostasis model assessment-insulin resistance (HOMA-IR) and a marker of beta-cell function (HOMA-β) was calculated according to the following formula: HOMA-IR = fasting insulin [µU/mL] * fasting glucose [mg/dL]/405, while HOMA-β = 360 * fasting insulin [µU/mL]/fasting glucose [mg/dL] − 63. Patients were labeled as pre-diabetic (pre-DM) if their fasting glucose >100 mg/dL or identified as pre-diabetic in their medical charts.
Statistical Analysis
Linear mixed effects regression models, using repeated measures, were used to analyze the ethnic and depot differences in immune cell counts, average adipocyte size, and CLS status (+/−); depot difference by ethnicity status was examined by the interaction term (ethnicity*depot). These models accounted for the correlation between repeated adipose measurements within participants using the conditional correlation structure (selected for best fit by lowest IC values). Within each depot, associations between cell counts, cell size BMI, serum markers of type 2 diabetes risk (insulin, glucose, HOMA-IR, HOMA-β), circulating cytokines (CRP, IL-6, TNF- α, MCP-1) and leptin were assessed through correlations and adjusted partial correlations, and the association with CLS status (+/−) were tested by ANCOVA. All relationships were tested for the confounding effects of age, gender, BMI, surgery type, and ethnicity; raw correlations reported unless covariate adjustment altered findings and are described.
Statistical significance was set a P<0.05, and data are reported as mean ± SEM, unless otherwise noted. Variables were natural log transformed (Ln) if necessary to achieve a normal distribution. Data were analyzed with SAS 9.3.
Results
As shown in Table 1, a total of 44 non-diabetic participants who are overweight or obese were included in this study. The study population was of mixed ethnicity/race (10 African American, 21 Hispanic, 9 white and 3 other) and had an average BMI of 37.2±1.2 kg/m2 and age of 41.5±1.6 years. Ninety-one percent of participants were obese, 70% were female, and each had complete histology, anthropometric and fasting blood measures. Out of 44 participants, flow cytometry data was available for 37 patients. There was no statistical difference in characteristics between two groups (data not shown).
Table 1.
Participant Characteristics (n=44)
| Variable | Frequency |
|---|---|
| Ethnicity (AA/Hispanic/White/Other) | (11/21/9/3) |
| Sex (Male/Female) | (13/31) |
| Obesity status (overweight/obese) | (4/40) |
| Surgery Type (bariatric/hernia/chole) | (20/8/16) |
| Pre-DM (yes/no) | (14/30) |
| Mean ± SEM | |
| Age (yrs) | 41.5 ± 1.55 |
| Height (inches) | 65.0 ± 0.63 |
| Weight (lb) | 221.4 ± 8.58 |
| BMI (kg/m2) | 37.2 ± 1.20 |
| Fasting Glucose (mg/dL) | 94.3 ± 4.80 |
| Fasting Insulin (µU/mL) | 6.47 ± 0.66 |
| HOMA-IR | 1.49 ± 0.16 |
| HOMA-β | 107.4 ± 13.0 |
| Leptin (pg/mL) | 30103 ± 3458 |
| CRP (µg/mL) | 6.42 ± 1.20 |
| IL-6 (pg/mL) | 3.49 ± 0.51 |
| TNF-α (pg/mL) | 4.48 ± 0.25 |
| MCP-1 (pg/mL) | 269.9 ± 16.9 |
AA=African American; "chole"= cholecystectomy; Pre-DM= Pre-type 2 diabetic; BMI= body mass index; HOMA-IR= homeostasis model assessment-insulin resistance; CRP= C-reactive protein; IL-6= Interleukin 6; TNF-α= tumor necrosis factor alpha; MCP-1= monocyte chemotactic protein type 1 (aka chemokine (C-C motif) ligand 2 (CCL2))
Basic AT Histology
As shown in Figure 2a, the average adipocyte cell size was significantly higher in the subQ relative to the DsubQ and omental depot (4,527±169 µ2 vs 4,022 ±179 and 3,827 ±169 µ2; p=0.001). The subQ was the most hypertrophied depot and had significant positive relationships with circulating CRP (r=0.39 p=0.01) and leptin (r=0.46 p=0.002), but after controlling for BMI, age, sex, ethnicity and surgery type, there was only a significant relationship with circulating leptin (r=0.40 p=0.02) and newly with IL-6 (r=0.38 p=0.03). SubQ and DsubQ cell size also significantly associated with subQ M1 and DsubQ M1 cell counts (r=0.40 p=0.028; r=0.45 p=0.011, respectively) and DsubQ cell size associated with subQ M1, DsubQ M1 and omental M1 cell counts (r=0.041 p=0.023; r=0.36 p=0.48, r=0.38 p=0.037, respectively). There were no other significant cell size and cell counts relationships, nor did cell size significantly associate with any fasting diabetes marker.
Figure 2. Histology characteristics by depot and ethnicity.

Raw values shown. a. The average adipocyte cell size (µm2) is significantly larger in the subQ depot relative to the DsubQ and omental depots (4,527±169 µ2 vs 4,022 ±179 and 3,827 ±169 µ2; p=0.001), and this relationship was consistent across ethnicities and independent of age, BMI, gender, and surgery type. b. Additionally the proportion of CLS+ samples was significantly lower in the omental depot relative to the subQ and DsubQ (29% CLS+ vs 71% and 65% CLS+; p=0.010). The proportion of CLS+ samples by depot was also consistent across ethnicities and the lower CLS+% was independent of age, BMI, gender, and surgery type.
Presence of CLS (CLS+) was significantly lower in the omental depot relative to the subQ and DsubQ (29% CLS+ vs 71% and 65% CLS+; p=0.010) (Figure 2b). The difference in frequency was consistent across ethnicities. The presence of CLS significantly predicted circulating markers of inflammation in the subQ and DsubQ depot, but there were no relationships with omental CLS+ status. Specifically, those with CLS+ subQ had higher circulating CRP (7.6±1.6 vs 3.2±0.8 µg/mL, p=0.016) and IL-6 (4.02±0.4 vs 2.1±0.6, p=0.005) levels compared to CLS−. In the DsubQ depot, CLS+ versus CLS− participants had significantly higher IL-6 (3.6±0.3 vs 2.3±0.2 µg/mL, p=0.005). Presence of CLS did not predict any other marker of type 2 diabetes risk, nor associate with BMI or weight. CLS status in both subcutaneous depots had trend associations for higher counts of M1 and M2 cells in patients who were CLS+ versus CLS− in those respective depots (p<0.01). CLS status did not predict either T cell count, nor were there any significant relationships in the omental depot. Representative histology images per depot are displayed in Figure 3.
Figure 3. Representative histology images.
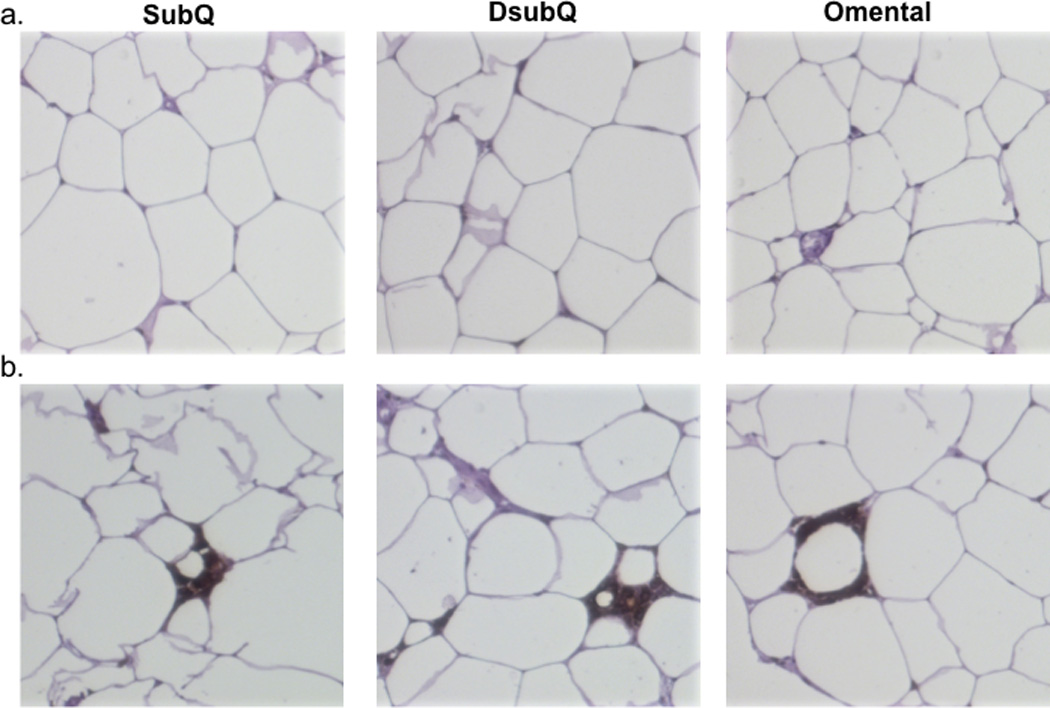
a. Slides displaying representative CLS negative samples across the three depots SubQ (superficial subcutaneous fat), DSubQ (deep subcutaneous fat) and Omental. Images like these were used for cell sizing measurement. b. Slides display representative CLS positive samples across the three adipose depots, SubQ, DsubQ and Omental.
AT and Blood Immune Cell Sorting
As shown in Figure 4a, Treg cells were significantly lower in adipose tissue from the omentum relative to both subQ and DsubQ depots (4.3±0.3 vs. 4.9±0.3 & 5.4±0.3 Ln cells/gram, p=0.013). This difference became more significant after controlling for BMI, gender, age, and surgery type, and ethnicity (p=0.0006), and the relationship was consistent across ethnicities. In the omentum and DsubQ, there were more pro-inflammatory immune cells (CD45+CD14+CD163−-M1) relative to the subQ depot (7.9±0.4 & 7.8±0.4 vs. 7.2±0.4 Ln cells/gram, p=0.030) (Figure 4b), which was consistent across ethnicities. There was no difference by depot or ethnicity in the Teff or CD45+CD14+CD163+-M2 cell counts (Figure 4c, 4d), however there were significant depot differences when the ratio between Teff to Treg (Treg/Teff) and CD45+CD14+CD163−-M1 to CD45+CD14+CD163+-M2 (M1/M2) cell types was assessed. Specifically, the ratio of Teff to Treg and M1 to M2 was significantly higher in the omentum relative to both the subQ and DsubQ depots (Teff/Treg: 6.2±0.9 vs. 2.5±0.9 & 2.3±1.1 p=0.0012; M1/M2: 2.2±0.5 vs 1.0±0.5 & 0.3±0.6 p=0.0049).
Figure 4. Cell counts by depot and ethnicity.

Raw natural log values shown (mean±SEM). a. Treg cell counts are significantly lower in the omentum vs. both subcutatneous depots, DsubQ and subQ (p=0.013), and this relationship is consistent across ethnicities and independent of BMI, gender, age, and surgery type. b. No significant difference in Teff cell count by depot or ethnicity. c. CD45+CD14+CD163− M1 cell counts are significantly higher in the omentum and DsubQ relative to the subQ depot (p=0.03) and this relationship is consistent across ethnicities and independent of BMI, gender, age and surgery type. d. No significant difference in CD45+CD14+CD163+ M2 cell count by depot or ethnicity.
As shown in Figure 5 Omental Treg number was inversely associated with plasma fasting glucose (r= −0.35 p= 0.045) and MCP-1 (r= −0.40 p= 0.015) and positively associated with HOMA-β (r= 0.34 p= 0.046) (Figures 5a–c). Treg and Teff cell counts in other fat depots were not associated with any fasting markers of type 2 diabetes risk or inflammation. As shown in Figure 5d–g, CD45+CD14+CD163−-M1 cell counts in all abdominal depots, as well as those measured systemically in the blood, were positively associated with circulating TNF-α levels (subQ: r=0.33 p=0.045; DsubQ r=0.50 p=0.002; omental: r=0.37 p=0.026; blood/circulation: r=0.33 p=0.048). Increased numbers of CD45+CD14+CD163−-M1 cells in the subQ and circulation were also associated with increased HOMA-IR (subQ: r=0.36 p=0.032; circulation: r=0.38 p=0.026) (figure not shown), but both associations became a trend after controlling for covariates (p<0.1). Increased anti-inflammatory cells (CD45+CD14+CD163+-M2) in each fat depot were associated with higher fasting insulin levels and indicators of insulin resistance and β-cell function. Specifically, CD45+CD14+CD163+-M2 counts in the subQ, omentum, and circulation were associated with higher fasting insulin and increased insulin resistance (fasting insulin= subQ: r=0.35 p=0.034; omental: r=0.46 p=0.005; blood/circulation: r=0.54 p=0.001 (Figures 5h–j); HOMA-IR= subQ: r=0.37 p=0.029;omental: r=0.41 p=0.014; blood/circulation: r=0.49 p=0.004 (Figures 5k–m)), with no significant relationship in DsubQ counts. As shown in Figure 5n–o, increased CD45+CD14+CD163+-M2 cell counts in the omental adipose tissue and in circulation were associated with increased HOMA-β (omental: r=0.48 p=0.003; blood/circulation: r=0.61 p<0.001). CD45+CD14+CD163−-M1 or CD45+CD14+CD163+-M2 cell counts by depot did not significantly associate with any other fasting marker.
Figure 5. Cell count associations with serum markers of type 2 diabetes risk and inflammation.

Raw values displayed and all cell counts are natural log transformed. a–c. Displays the significant relationship between omental Tregs and glucose, MCP-1 and HOMA-β (fasting marker of beta-cell function). d–g. Displays the significant CD45+CD14+CD163−M1 relationships between M1 cell counts in all depots (subQ, DsubQ, omental, and circulation) and TNF-α. h–j. Displays the significant relationship between CD45+CD14+CD163+M2 cell counts in the subQ, omentum and circulation, and fasting insulin. k–m. Displays the significant relationship between CD45+CD14+CD163+M2 cell counts in the subQ, omentum and circulation, and HOMA-IR, a fasting marker of insulin resistance. n,o. Displays the significant relationship between CD45+CD14+CD163+M2 cell counts in the omentum and circulation, and HOMA-β, a fasting marker of beta-cell function.
Table 2 summarizes the inter-depot correlations for the various cell types. Overall, cell counts positively and significantly correlated with each other across depots, however Tcell subsets only had a significant relationship between circulating and omental cell counts (Treg: r=0.36 p=0.033; Teff: r=0.33 p=0.049).
Table 2.
Inter-depot cell count correlations by cell type
| Treg | SubQ | DsubQ | Omental | |
| r (p-value) | r (p-value) | r (p-value) | ||
| DsubQ | 0.48 (0.003) | |||
| Omental | 0.42 (0.009) | 0.36 (0.030) | ||
| Circulation | 0.14 (0.425) | 0.32 (0.065) | 0.36 (0.033) | |
| Teff | SubQ | DsubQ | Omental | |
| DsubQ | 0.61 (<0.0001) | |||
| Omental | 0.46 (0.004) | 0.31 (0.070) | ||
| Circulation | 0.22 (0.193) | 0.29 (0.095) | 0.33 (0.049) | |
| M1 | SubQ | DsubQ | Omental | |
| DsubQ | 0.67 (<0.0001) | |||
| Omental | 0.61 (<0.0001) | 0.60(<0.0001) | ||
| Circulation | 0.63 (<0.0001) | 0.64 (<0.0001) | 0.74 (<0.0001) | |
| M2 | SubQ | DsubQ | Omental | |
| DsubQ | 0.60 (<0.0001) | |||
| Omental | 0.41 (0.012) | 0.28 (0.103) | ||
| Circulation | 0.39 (0.017) | 0.37 (0.028) | 0.58 (<0.0001) | |
Bold indicates p<0.05. SubQ= superficial subcutaneous abdominal adipose tissue; DsubQ= deep subcutaneous abdominal adipose tissue; Treg= Fox3p+ T regulatory cells; Teff= CD4+ T effector cells; M1= CD45+CD14+CD163− Macrophage type 1 (pro-inflammatory); M2= CD45+CD14+CD163+Macrophage type 2 (anti-inflammatory); all adipose depot units are cell counts/gram and the unit for circulation is cell counts/mL.
Discussion
This is one of the first studies using human fat biopsies to couple traditional histological measures of AT inflammation with live cell sorting to characterize immune cells in various AT depots. The main findings indicate that Treg cell counts are lower in the omental adipose tissue relative to the subcutaneous abdominal depots in non-diabetic adults who are overweight or obese irrespective of race/ethnicity. Additionally, the lower omental Treg counts were associated with higher fasting glucose, higher MCP-1, and lower beta-cell function. These results demonstrate depot specific effects of Tregs on diabetes risk factors that are specific to omental but not subcutaneous AT depots or Tregs in circulation, with a similar effect by race/ethnicity. Based on this and the loss of omental Tregs in obese animals (6), we propose that increased omental fat could lead to loss of immune modulatory functioning and increased risk for type 2 diabetes..
As part of the intra-abdominal visceral depot, the omentum has significant immune properties (20, 21), and contains lymphoreticular aggregations (milky spots) which distinguish it from other visceral AT (22). The omentum is the center of peritoneal cavity lymphocyte trafficking and activation (22) and an important site of Tcell accumulation (23). These unique immune properties may partially account for the depot specific findings observed in the current study. Previous human studies in which Tregs were quantified, primarily used gene expression from frozen AT; however associations with obesity varied, and some studies showed lower omental Tregs in obesity (6, 9), where others showed no difference or higher Tregs (10–13). One study using live cell sorting of Tregs did not find a depot difference (13), however this study only had 10 participants in their paired depot. Findings from cell sorting on circulating (blood) Tregs also match our hypothesis showing that type 2 diabetes patients have lower levels of Treg and elevated Teff cells that predict systemic inflammation (24, 25). We demonstrate through isolating Foxp3+ cells directly from the AT of patients who are overweight or obese that omental Tregs are decreased in obesity with metabolic implications, further building on this hypothesis.
We also quantified CD4+ effector Tcells (CD3+CD4+CD25+FOXP3−) and did not find significant depot differences, nor associations with metabolic or inflammatory markers. We believe this is due to the multiple cell types that fall into this “Teff” category, which include pro- and anti-inflammatory Tcells, and suspect that separation of this category into smaller T-cell subsets would reveal higher concentrations of pro-inflammtory T-cell populations in the omental depot, such as Th1 and Th17 cells, as previously demonstrated (13, 26). We however did find a higher ratio of Teff/Treg in the omentum relative to both subcutaneous depots, suggesting a greater pro-inflammatory T-cell predominance of the omentum.
Pro-inflammatory macrophage counts (CD45+CD14+CD163−-M1) were significantly higher in deeper abdominal depots, and the combination of lower Treg count and higher pro-inflammatory “M1” counts and higher M1/M2 ratio in the omentum match the general hypothesis of an inflammatory visceral depot. However, macrophage associations with inflammatory and metabolic risk markers were significant across depots and not specific to the omentum. Both macrophage cell types associated with markers of inflammation and metabolic risk, and CD45+CD14+CD163+-M2 cells, which are considered anti-inflammatory, associated positively with fasting insulin and insulin resistance. “Classically activated” pro-inflammatory M1 and “alternatively activated” anti-inflammatory M2 macrophages have been well characterized in mice (27), but their clear-cut phenotype have been questioned in humans (28) and recently a population of distinct pro-inflammatory macrophages that result from metabolic challenge was described, MMe macrophages (29). These new metabolically activated macrophages, MMe, would have fallen in our “M1” macrophage category as they are CD163−, however were not able to sort them out further, nor use other reported M1 surface markers (CD206, CD11c, etc) due to restriction in color channels and complexity of our studies. The associations found in our study compliment the extensive literature on the importance of macrophages (30), however the positive association between CD45+CD14+CD163+-M2 cell counts and insulin resistance further question the M1 and M2 phenotypes in humans. Future human studies exploring multiple cell surface markers and clarifying macrophage subtype phenotype and function are needed.
Although obesity is a risk factor for disease, patients with obesity who are classified as metabolically healthy have been well documented (31). We previously found that among adults with obesity, those with adipose tissue inflammation had a significantly greater metabolic risk profile (16), and data from the current study supports this notion. Recent studies show mean adipocyte size does not differ between insulin sensitive versus insulin resistant participants, and rather a bi-modal distribution occurs with a higher proportion of small adipocytes that appear unable to appropriately accumulate lipids and hypertrophy in insulin resistant patients (32, 33). Similarly, we found that adipocyte cell size in the subQ and DsubQ depots was associated with CD45+CD14+CD163−-M1 cell counts, circulating CRP, and leptin levels; however, there were no associations between cell size and metabolic risk. This may be due to the fact that the proportion of small adipocytes is a better marker of AT function (34) and metabolic health (32, 33) than the mean cell size used in this study. Similarly, although CLS status in the subQ AT was associated with markers of inflammation and CD45+CD14+CD163−-M1 and CD45+CD14+CD163+-M2 cell counts, it was not associated with fasting insulin levels, HOMA-IR or HOMA-β. CLS status in the subQ has previously been associated with HOMA-IR (35), however the patients in our study have lower levels of insulin resistance than those previously reported and exact quantification of live macrophage cells, like the cells sorting done in our study may be required to detect an association with HOMA-IR when insulin resistance is lower. Furthermore, while CLS has been used to quantify subQ AT inflammation (28), we found that omental CLS status did not predict any cell counts, associate with any inflammatory markers, or risk factors for type 2 diabetes. More holistic measures such as gene expression, or the live cell sorting used in this study may best capture AT inflammatory status in all adipose depots but especially in the omentum due to it’s unique immune morphology (36).
While this study has the advantage of utilizing adipose tissue biopsies from multiple abdominal depots, the cross-sectional associations cannot prove causality. Although Treg counts in the circulation and other AT depots was significantly associated with omental Treg counts, the unique properties of the omentum for T-cell programming and the unique omental Treg association with metabolic risk highlight the need to for future studies to collect and examine omental Tregs. Furthermore, we only had access to fasting metabolic measures in our convenience surgical sample, and while our cell counts showed significant associations with these limited fasting measures, using more sensitive metabolic measures would enhance future studies. While we did not find differences in metabolic risk or cell counts by ethnicity, this study is bolstered by its inclusion of a diverse patient population and increases the generalization of our findings. Furthermore, this lack of ethnic difference in AT immune cell counts should be confirmed by a study with larger sample size across ethnicities,
In conclusion, our findings highlight the significance of omental Tregs in explaining potential links between visceral obesity, AT inflammation and diabetes risk. Omental Tregs and macrophages across all adipose depots were the greatest predictors of metabolic risk in our population of patients who are overweight or obese, emphasizing the importance of quantifying AT inflammation in the assessment of metabolic risk. Omental Tregs had unique metabolic associations with diabetes risk factors that emphasize the need for collection of this depot in future human adipose tissue research or identification of relevant biomarkers. Furthermore, there is a long list of pro-inflammatory cell types potentially causing type 2 diabetes. Tregs have the unique ability to dampen and decrease the activity and function of these cells, making Treg cells promising contenders for the prevention and treatment of obesity associated metabolic disease.
Questions.
What is already known about this subject?
T-regulatory cells (Tregs) are immunomodulatory cells, which may have a particularly important role in the omental adipose depot.
In mice, the onset of obesity leads to the loss of Tregs in the omental depot, coinciding with metabolic decline. The restoration of Tregs improves adipose inflammation, liver fat and glucose levels.
In humans, adipose Tregs levels have only been assessed by gene expression, resulting in mixed findings that warrant clarification with improved methodology such as live cell sorting to quantify Tregs across multiple adipose depots.
What does your study add?
This is one of the first studies to use live cell sorting to quantify human adipose Treg cell populations across multiple abdominal adipose depots.
In adults with obesity there are significantly lower Treg cells in the omentum relative to the abdominal subcutaneous depot.
Live cell sorting counts of Tcells and macrophages were better markers of type 2 diabetes risk than traditional adipose histology markers (cell size and presence of crown-like structures), where lower levels of Tregs are associated with higher fasting glucose and lower fasting measures of beta-cell function.
Acknowledgments
Funding: This work was supported by grants from SC CTSI (NIH/NCRR/NCATS) Grant# UL1TR000130 and the Robert C. and Veronica Atkins Foundation Grant to M.G. The content is solely the responsibility of the authors and does not necessarily represent the official views of the National Institutes of Health.
This work could not have been done without the generous time and support of the physicians and nurses whom partnered to recruit and collect the samples utilized in this project; specifically Sandra Lee, RN, Michelle Beirsack, RN, Monique Santamaria, RN NP, Carol Cisneros Rivas, RN NP, Namir Katkhouda, MD, Peter Crookes, MD, Kulmeet Sandhu, MD, Joerg Zehetner, MD, and Nikolai Bildzukewicz, MD (all affiliated with Keck Medical Hospital and LAC+USC Medical Center, Los Angeles, CA). We also appreciate the time and contribution of all of the study participants who made this research possible.
Footnotes
Conflict of interest: No potential conflicts of interest relevant to this article were reported.
Author Contributions: L.G. conceived and carried out the experiments, and analyzed the data. J.L., O.A. and N.K. conceived and carried out the experiments. T.A. carried out experiments. H.A. and M.G. conceived the study design and experiments. All authors were involved in writing the paper and had final approval of the submitted and published versions
References
- 1.Hotamisligil GS, Arner P, Caro JF, Atkinson RL, Spiegelman BM. Increased adipose tissue expression of tumor necrosis factor-alpha in human obesity and insulin resistance. Journal of Clinical Investigation. 1995;95:2409–2415. doi: 10.1172/JCI117936. [DOI] [PMC free article] [PubMed] [Google Scholar]
- 2.Pradhan AD, Manson JE, Rifai N, Buring JE, Ridker PM. C-reactive protein, interleukin 6, and risk of developing type 2 diabetes mellitus. JAMA. 2001;286:327–334. doi: 10.1001/jama.286.3.327. [DOI] [PubMed] [Google Scholar]
- 3.Weisberg SP, McCann D, Desai M, Rosenbaum M, Leibel RL, Ferrante AW. Obesity is associated with macrophage accumulation in adipose tissue. Journal of Clinical Investigation. 2003;112:1796–1808. doi: 10.1172/JCI19246. [DOI] [PMC free article] [PubMed] [Google Scholar]
- 4.Goran MI. Ethnic-specific pathways to obesity-related disease: the Hispanic vs. African-American paradox. Obesity (Silver Spring) 2008;16:2561–2565. doi: 10.1038/oby.2008.423. [DOI] [PubMed] [Google Scholar]
- 5.Mathis D. Perspective. Cell Metabolism. 2013;17:851–859. doi: 10.1016/j.cmet.2013.05.008. [DOI] [PMC free article] [PubMed] [Google Scholar]
- 6.Feuerer M, Herrero L, Cipolletta D, et al. Lean, but not obese, fat is enriched for a unique population of regulatory T cells that affect metabolic parameters. Nature Publishing Group. 2009;15:930–939. doi: 10.1038/nm.2002. [DOI] [PMC free article] [PubMed] [Google Scholar]
- 7.Wan YY. Regulatory T cells: immune suppression and beyond. Cell Mol Immunol. 2010;7:204–210. doi: 10.1038/cmi.2010.20. [DOI] [PMC free article] [PubMed] [Google Scholar]
- 8.Sakaguchi S, Yamaguchi T, Nomura T, Ono M. Regulatory T cells and immune tolerance. Cell. 2008;133:775–787. doi: 10.1016/j.cell.2008.05.009. [DOI] [PubMed] [Google Scholar]
- 9.Deiuliis J, Shah Z, Shah N, et al. Visceral adipose inflammation in obesity is associated with critical alterations in tregulatory cell numbers. In: Brusic V, editor. PLoS ONE. Vol. 6. 2011. p. e16376. [DOI] [PMC free article] [PubMed] [Google Scholar]
- 10.Travers RL, Motta AC, Betts JA, Bouloumie A, Thompson D. The impact of adiposity on adipose tissue-resident lymphocyte activation in humans. Int J Obes (Lond) 2014 doi: 10.1038/ijo.2014.195. [DOI] [PMC free article] [PubMed] [Google Scholar]
- 11.Pereira SS, Teixeira LG, Aguilar EC, et al. Modulation of adipose tissue inflammation by Foxp3+ Treg cells, IL-10 and TGFβ in metabolically healthy class III obese individuals. Nutrition. 2013:1–32. doi: 10.1016/j.nut.2013.11.023. [DOI] [PubMed] [Google Scholar]
- 12.Zeyda M, Huber J, Prager G, Stulnig TM. Inflammation correlates with markers of T-cell subsets including regulatory T cells in adipose tissue from obese patients. Obesity (Silver Spring) 2011;19:743–748. doi: 10.1038/oby.2010.123. [DOI] [PubMed] [Google Scholar]
- 13.McLaughlin T, Liu L-F, Lamendola C, et al. T-cell profile in adipose tissue is associated with insulin resistance and systemic inflammation in humans. Arterioscler Thromb Vasc Biol. 2014;34:2637–2643. doi: 10.1161/ATVBAHA.114.304636. [DOI] [PMC free article] [PubMed] [Google Scholar]
- 14.Alvehus M, Burén J, Sjöström M, Goedecke J, Olsson T. The human visceral fat depot has a unique inflammatory profile. Obesity (Silver Spring) 2010;18:879–883. doi: 10.1038/oby.2010.22. [DOI] [PubMed] [Google Scholar]
- 15.Schindelin J, Arganda-Carreras I, Frise E, et al. Fiji: an open-source platform for biological-image analysis. Nat Methods. 2012;9:676–682. doi: 10.1038/nmeth.2019. [DOI] [PMC free article] [PubMed] [Google Scholar]
- 16.Lê K-A, Mahurkar S, Alderete TL, et al. Subcutaneous adipose tissue macrophage infiltration is associated with hepatic and visceral fat deposition, hyperinsulinemia, and stimulation of NF-κB stress pathway. Diabetes. 2011;60:2802–2809. doi: 10.2337/db10-1263. [DOI] [PMC free article] [PubMed] [Google Scholar]
- 17.Hagman DK, Kuzma JN, Larson I, et al. Characterizing and quantifying leukocyte populations in human adipose tissue: impact of enzymatic tissue processing. J Immunol Methods. 2012;386:50–59. doi: 10.1016/j.jim.2012.08.018. [DOI] [PMC free article] [PubMed] [Google Scholar]
- 18.Biswas P, Mantelli B, Sica A, et al. Expression of CD4 on human peripheral blood neutrophils. Blood. 2003;101:4452–4456. doi: 10.1182/blood-2002-10-3056. [DOI] [PubMed] [Google Scholar]
- 19.Kazazi F, Mathijs JM, Foley P, Cunningham AL. Variations in CD4 expression by human monocytes and macrophages and their relationships to infection with the human immunodeficiency virus. J Gen Virol. 1989;70(Pt 10):2661–2672. doi: 10.1099/0022-1317-70-10-2661. [DOI] [PubMed] [Google Scholar]
- 20.Kaminski DA, Randall TD. Adaptive immunity and adipose tissue biology. Trends Immunol. 2010;31:384–390. doi: 10.1016/j.it.2010.08.001. [DOI] [PMC free article] [PubMed] [Google Scholar]
- 21.Rangel-Moreno J, Moyron-Quiroz JE, Carragher DM, et al. Omental milky spots develop in the absence of lymphoid tissue-inducer cells and support B and T cell responses to peritoneal antigens. Immunity. 2009;30:731–743. doi: 10.1016/j.immuni.2009.03.014. [DOI] [PMC free article] [PubMed] [Google Scholar]
- 22.Carlow DA, Gold MR, Ziltener HJ. Lymphocytes in the peritoneum home to the omentum and are activated by resident dendritic cells. The Journal of Immunology. 2009;183:1155–1165. doi: 10.4049/jimmunol.0900409. [DOI] [PubMed] [Google Scholar]
- 23.Lynch L, O'Shea D, Winter DC, Geoghegan J, Doherty DG, O'Farrelly C. Invariant NKT cells and CD1d(+) cells amass in human omentum and are depleted in patients with cancer and obesity. Eur J Immunol. 2009;39:1893–1901. doi: 10.1002/eji.200939349. [DOI] [PubMed] [Google Scholar]
- 24.Jagannathan-Bogdan M, McDonnell ME, Shin H, et al. Elevated proinflammatory cytokine production by a skewed T cell compartment requires monocytes and promotes inflammation in type 2 diabetes. The Journal of Immunology. 2011;186:1162–1172. doi: 10.4049/jimmunol.1002615. [DOI] [PMC free article] [PubMed] [Google Scholar]
- 25.Cai B, Zhang J, Zhang M, et al. Micro-inflammation characterized by disturbed Treg/Teff balance with increasing sIL-2R in patients with type 2 diabetes. Exp Clin Endocrinol Diabetes. 2013;121:214–219. doi: 10.1055/s-0033-1333687. [DOI] [PubMed] [Google Scholar]
- 26.Bertola A, Ciucci T, Rousseau D, et al. Identification of adipose tissue dendritic cells correlated with obesity-associated insulin-resistance and inducing Th17 responses in mice and patients. Diabetes. 2012;61:2238–2247. doi: 10.2337/db11-1274. [DOI] [PMC free article] [PubMed] [Google Scholar]
- 27.Gordon S, Taylor PR. Monocyte and macrophage heterogeneity. Nat Rev Immunol. 2005;5:953–964. doi: 10.1038/nri1733. [DOI] [PubMed] [Google Scholar]
- 28.Wentworth JM, Naselli G, Brown WA, et al. Pro-inflammatory CD11c+CD206+ adipose tissue macrophages are associated with insulin resistance in human obesity. Diabetes. 2010;59:1648–1656. doi: 10.2337/db09-0287. [DOI] [PMC free article] [PubMed] [Google Scholar]
- 29.Kratz M, Coats BR, Hisert KB, et al. Metabolic dysfunction drives a mechanistically distinct proinflammatory phenotype in adipose tissue macrophages. Cell Metabolism. 2014;20:614–625. doi: 10.1016/j.cmet.2014.08.010. [DOI] [PMC free article] [PubMed] [Google Scholar]
- 30.Olefsky JM, Glass CK. Macrophages, inflammation, and insulin resistance. Annu Rev Physiol. 2010;72:219–246. doi: 10.1146/annurev-physiol-021909-135846. [DOI] [PubMed] [Google Scholar]
- 31.Stefan N. Identification and Characterization of Metabolically Benign Obesity in Humans. Arch Intern Med. 2008;168:1609. doi: 10.1001/archinte.168.15.1609. [DOI] [PubMed] [Google Scholar]
- 32.McLaughlin T, Sherman A, Tsao P, et al. Enhanced proportion of small adipose cells in insulin-resistant vs insulin-sensitive obese individuals implicates impaired adipogenesis. Diabetologia. 2007;50:1707–1715. doi: 10.1007/s00125-007-0708-y. [DOI] [PubMed] [Google Scholar]
- 33.McLaughlin T, Lamendola C, Coghlan N, et al. Subcutaneous adipose cell size and distribution: relationship to insulin resistance and body fat. Obesity (Silver Spring) 2014;22:673–680. doi: 10.1002/oby.20209. [DOI] [PMC free article] [PubMed] [Google Scholar]
- 34.McLaughlin T, Deng A, Yee G, et al. Inflammation in subcutaneous adipose tissue: relationship to adipose cell size. Diabetologia. 2010;53:369–377. doi: 10.1007/s00125-009-1496-3. [DOI] [PMC free article] [PubMed] [Google Scholar]
- 35.Apovian CM, Bigornia S, Mott M. Adipose macrophage infiltration is associated with insulin resistance and vascular endothelial dysfunction in obese subjects. 2008 doi: 10.1161/ATVBAHA.108.170316. [DOI] [PMC free article] [PubMed] [Google Scholar]
- 36.Krist LF, Eestermans IL, Steenbergen JJ, et al. Cellular composition of milky spots in the human greater omentum: an immunochemical and ultrastructural study. Anat Rec. 1995;241:163–174. doi: 10.1002/ar.1092410204. [DOI] [PubMed] [Google Scholar]