Abstract
The role of Toll-like receptor (TLR) signaling has attracted much attention in the development of hepatic inflammation and hepatocellular carcinoma (HCC). We herein sought to determine the role of TLRs and responsible cells in steatohepatitis-related HCC. We used hepatocyte-specific Pten-deficient (PtenΔhep) mice, which exhibit steatohepatitis followed by liver tumor formation, including HCC. We then generated PtenΔhep/Tlr4−/− and PtenΔhep/Tlr2−/− double-mutant mice and investigated the role of macrophages using reconstitution of bone marrow (BM)-derived cells, chemical depletion of macrophages, and isolated macrophages. Tlr4 but not Tlr2 deficiency in the PtenΔhep mice suppressed tumor growth as well as hepatic inflammation. Gut sterilization by an antibiotic mixture reduced the portal LPS levels as well as tumor growth in the PtenΔhep mice. Tumor growth was also decreased by reconstitution of BM-derived cells to Tlr4−/− BM cells. In addition, chemical depletion of macrophages significantly reduced tumor size and numbers. Macrophages expressing Ly6C were increased in number, which was associated with inflammation and tumor progression in the PtenΔhep mice. Hepatic macrophages isolated from the PtenΔhep mice abundantly expressed the Ly6C gene and produced much more IL-6 and TNFα in response to LPS. These proinflammatory cytokines induced the proliferation of HCC cells as well as oval cells, putative cancer progenitor cells. Indeed, putative cancer progenitor cells emerged before the development of macroscopic liver tumors and then increased in number under sustained inflammation. TLR4 on macrophages contributes to the development of steatohepatitis-related HCC in mice.
Keywords: hepatocellular carcinoma, inflammation, macrophage, phosphatase and tensin homolog (PTEN), toll-like receptor (TLR)
Introduction
Hepatocellular carcinoma (HCC)2 is an inflammation-related cancer induced by chronic infection with hepatitis B virus and/or hepatitis C virus, non-alcoholic steatohepatitis, and exposure to alcohol and/or aflatoxin (1, 2). Issues in HCC management include asymptomatic progression to advanced stages and a high rate of recurrence even after curative treatments for the primary tumors. Therefore, HCC is a refractory cancer, and the third leading cause of cancer-related death worldwide. Sustained inflammation is a risk factor for the development of HCC. In fact, a high transaminase level is associated with the development and recurrence of HCC in patients with liver cirrhosis (3, 4). Moreover, sustained inflammation induces liver fibrosis, an additional risk factor for HCC (5). Therefore, controlling inflammation is required to reduce the incidence and recurrence of HCC.
Recently, the gut-liver axis has attracted much attention with respect to its role in the development of liver diseases, such as non-alcoholic steatohepatitis and HCC (6). Gut-derived substances stimulate the innate immune system, including Toll-like receptors (TLRs), which recognize bacterial components. Of the TLRs, TLR4 senses components of Gram-negative bacteria, including LPS, whereas TLR2 identifies components of Gram-positive bacteria such as peptidoglycan (7). TLR signaling has a dual function in the development of liver diseases. For instance, elevated LPS levels can induce inflammation and fibrosis via TLR4 (8, 9), and the lack of TLR4 signaling promotes the progression of other experimental liver diseases (10, 11). To date, the role of TLRs in the development of steatohepatitis-related liver tumors has not yet been determined.
There are several types of TLR-expressing cells in the liver, including hepatic stellate cells and macrophages. Of these cells, the role of hepatic stellate cells has been extensively investigated in the development of liver fibrosis (9) and subsequent tumor growth via TLR4 (12). In particular, hepatic stellate cells produce a cancer-promoting factor, epiregulin, in response to LPS (12). Therefore, the TLR4 present on hepatic stellate cells promotes the progression of HCC. However, the role of TLR signaling in macrophages remains unclear. Macrophages display dual functions in liver tumors, including promoting (13) and inhibitory effects on tumor growth (14). In addition, macrophages consist of both proinflammatory and anti-inflammatory types or resident or recruited types (15). Hence, further research is required to elucidate the roles of macrophages in the development of HCC.
In this study, we sought to clarify the role of TLRs and to identify responsible cells in the process of tumor growth using hepatocyte-specific Pten-deficient (PtenΔhep) mice, which share several features of human non-alcoholic steatohepatitis and HCC. Indeed, 50% of HCC lose Pten expression in human HCC (16). Here, we demonstrate that TLR4 but not TLR2 activation promotes hepatic inflammation and tumor growth. In that process, hepatic macrophages contribute to the proliferation of putative cancer progenitor cells and tumor cells by producing proinflammatory cytokines.
Experimental Procedures
Generation and Handling of the Mice
PtenΔhep mice were generated by crossing albumin-Cre recombinase transgenic mice (The Jackson Laboratory, Bar Harbor, ME) and Ptenfl/fl mice, as reported previously (17). We then generated double-mutant mice, including PtenΔhep/Tlr2−/− mice and PtenΔhep/Tlr4−/− mice, by crossing PtenΔhep mice and Tlr2−/−/Tlr4−/− double-mutant mice (Oriental Yeast Co., Ltd. Japan). All mice had a C57Bl6 background and were given free access to food and water, under specific pathogen-free conditions, until the end of the experiments.
For gut sterilization, the mice were orally administered a well established antibiotics mixture (9, 18) containing ampicillin (1 g/liter), neomycin (1 g/liter), metronidazole (1 g/liter), and vancomycin (0.5 g/liter). Treatment with the antibiotics mixture was given from 8 to 48 or 72 weeks of age. To generate chimeric mice, liposomal clodronate was injected intraperitoneally to deplete hepatic macrophages 1 day prior to bone marrow (BM) transplantation. BM cells (1 × 10⁷ cells) obtained from PtenΔhep mice, Tlr2−/− mice, and Tlr4−/− mice were transplanted into Ptenfl/fl mice and PtenΔhep mice via the tail vein after the recipient mice were lethally irradiated (10 gray). For macrophage depletion, 200 μl of liposomal clodronate was injected intraperitoneally every 2 weeks from 24 to 48 weeks of age. Sensitivity to LPS was assessed using 10-week-old male mice injected with 1 mg of heat-killed Propionibacterium acnes (Van Kampen Group, Hoover, AL) intraperitoneally. After 7 days, 20 μg of LPS (Sigma) was injected intravenously to the mice. The administration of LPS combined with P. acnes did not result in any deaths up to 36 h after the LPS challenge. For neutralization of oxidative stress in mice (48 weeks of age), N-acetyl-l-cysteine (20 mg/kg) was injected intraperitoneally 1 h prior to intravenous injection of LPS (40 μg). Blood samples were collected 6 h after the LPS injection and measured glutamic pyruvic transaminase (GPT) concentration. All animal experiments were approved by the Institutional Review Board of Akita University, Graduate School of Medicine.
Histological Examination and Immunocytochemistry for Ly6C
H&E and Sirius red staining were performed for a general histological assessment and evaluation of liver fibrosis, respectively. The non-alcoholic fatty liver disease activity score was determined as described (19). The Sirius red-positive area was measured on 10 magnified (×100) fields/slide and quantified using National Institutes of Health imaging software program. Immunohistochemistry was performed according to established protocols using primary antibodies (Table 1). F4/80-, Ly6C-, EpCAM-, PCNA-, and Ki67-positive cells were counted on 30–50 high power (×400) fields per slide, and cell numbers and the labeling index were compared. HCC and cholangiocellular carcinoma were diagnosed as tumor cell positivity for α-fetoprotein and cytokeratin 19, respectively. Regarding immunocytochemistry for Ly6C, F4/80-positive macrophages were separated from the Ptenfl/fl mice and PtenΔhep mice using a magnetically activated cell sorting system according to the manufacturer's instructions. These F4/80-positive cells were subjected to immunofluorescent staining for Ly6C.
TABLE 1.
List of primary antibodies
The following abbreviations are used: WB, Western blotting; IHC, immunohistochemistry; IF, immunofluorescent staining; AFP, α-fetoprotein.
| Antibody | Dilution | Catalog no. | Distributor |
|---|---|---|---|
| Actin | WB (×10,000) | A4700 | Sigma |
| AFP | IHC (×50) | sc-8108 | Santa Cruz Biotechnology |
| AKT | WB (×1000) | 9272S | Cell Signaling |
| p-AKT (Ser-473) | WB (×1000) | 9271 | Cell Signaling |
| EpCAM | WB (×1000) | Ab71916 | Abcam |
| IHC (×200) | |||
| F4/80 | IHC (×100) | 14-4801 | eBioscience |
| Ki67 | IHC (×400) | 12202 | Cell Signaling |
| Ly6C | IHC (×100) | Ab15627 | Abcam |
| IF (×50) | |||
| PCNA | IHC (×100) | M0879 | Dako |
Gut Microbiota Composition Analysis
Stool samples were collected from each mouse and stored at −20 °C until use. DNA was extracted from the stool using mechanical disruption with microbeads (20). A subsequent analysis of the gut microbiota was performed using the terminal restriction fragment length polymorphism method, as reported previously (20).
Measurement of GPT, LPS, TNFα, IL-6, FFA, and Hydrogen Peroxidase Levels
The GPT, LPS, TNFα, IL-6, FFA, and hydrogen peroxidase levels were measured using the transaminase C II kit (Wako Pure Chemical Industry Ltd., Osaka, Japan), ToxinSensor Chromogenic LAL endotoxin assay kit (GenScript, Piscataway, NJ), ELISA kits for TNFα and IL-6 (R&D Systems, Minneapolis, MN), NEFA C kit (Wako Pure Chemical Industry Ltd.), and hydrogen peroxidase assay kit (Cayman Chemical Co., Ann Arbor, MI) respectively, according to the manufacturers' instructions.
Quantitative Real Time PCR Analysis
RNA was extracted from the liver and cells using TRIzol (Life Technologies, Inc., Tokyo, Japan). The extracted RNA was subjected to reverse transcription and subsequent PCR using the listed primers (Table 2) and the LightCycler 480 SYBR Green I Master device (Roche Applied Science, Basel, Switzerland). The gene expression levels were normalized to that of 18S RNA as an internal control.
TABLE 2.
Sequence of primers for quantitative real time PCR
| Primers | Forward | Reverse |
|---|---|---|
| Mouse | ||
| 18S | AGTCCCTGCCCTTTGTACACA | CGATCCGAGGGCCTCACTA |
| Tnf | AGGGTCTGGGCCATAGAACT | CCACCACGCTCTTCTGTCTAC |
| Il-6 | ACCAGAGGAAATTTTCAATAGGC | TGATGCACTTGCAGAAAACA |
| Collagen1α1 | TAGGACTGACCAAGGTGGCT | GGAACCTGGTTTCTTCTCACC |
| TIMP-1 | AGGTGGTCTCGTTGATTTCT | GTAAGGCCTGTAGCTGTGCC |
| TGF-β | GTGGAAATCAACGGGATCAG | ACTTCCAACCCAGGTCCTTC |
| Ly6C | AGGGCAGAAAGAAAGGCACT | TGATGGATTCTGCATTGCTC |
| Epiregulin | GGATCACGGTTGTGCTGATA | AAGCTGCACCGAGAAAGAAG |
| HGF | CTTCTCCTTGGCCTTGAATG | CCTGACACCACTTGGGAGTA |
| Light | CTTCCTCCCCTCCGTCAG | AAATGACCCTGAGAGCATGG |
| Ym1 | TTTCTCCAGTGTAGCCATCCTT | AGGAGCAGGAATCATTGACG |
| Human | ||
| 18S | AGTCCCTGCCCTTTGTACACA | CGATCCGAGGGCCTCACTA |
| EpCAM | CCCATCTCCTTTATCTCAGCC | CTGAATTCTCAATGCAGGGTC |
| Il-6 | GTCAGGGGTGGTTATTGCAT | AGTGAGGAACAAGCCAGAGC |
| Tnf | AGATGATCTGACTGCCTGGG | CTGCTGCACTTTGGAGTGAT |
Cells and Treatment
Primary-cultured hepatocytes were isolated from the Ptenfl/fl mice, the PtenΔhep mice, and the PtenΔhep/T4−/− mice at 12 weeks of age. These hepatocytes were stimulated with or without 10 μg/ml insulin and harvested at 20 min after stimulation for a Western blot analysis. Hepatic and peritoneal macrophages were isolated from the mice, as reported previously (21, 22). After cell attachment, the macrophages were serum-starved for 16 h followed by treatment with up to 10 ng/ml of LPS. Huh 7 cells were used to isolate EpCAM-positive cancer cells. The EpCAM-positive cells were isolated using magnetically activated cell sorting (Miltenyi Biotec, Cologne, Germany) according to the manufacturer's instructions. Briefly, the Huh 7 cells were incubated with anti-EpCAM antibody-conjugated microbeads for 30 min at 4 °C and then passed through a column equipped with a magnet after being rinsed with the provided buffer. Cells that passed through the column were regarded to be EpCAM-negative Huh 7 cells, and those trapped in the column were regarded to be EpCAM-positive Huh 7 cells. The EpCAM-positive oval cells were a generous gift from Professor Miyajima (University of Tokyo). Briefly, C57Bl/6 mice on a 3,5-diethoxycarbonyl-1,4-dihydrocollidine-containing diet were used for oval cell isolation. Double-positive cells for EpCAM and Trop2 were regarded to be oval cells, which were isolated from the non-parenchymal cell fraction after collagenase perfusion. The cells were isolated from injured mouse livers and established as a cell line that excluded cholangiocytes (23). A cell proliferation assay was performed using an MTT assay kit (Millipore, Temecula, CA), according to the manufacturer's instructions.
Western Blotting
Five to fifty micrograms of proteins were subjected to a Western blot analysis. The proteins were separated using a proper concentration of SDS gels and transferred to nitrocellulose membranes, followed by incubation with the primary antibodies (Table 1).
Statistics
Differences between two groups were compared using the χ2 test (tumor incidence, cell count), t test (samples for normal distribution), and Mann-Whitney U test (samples without a normal distribution). Differences between multiple groups were compared using one-way ANOVA (GraphPad Prism version 4.02; GraphPad Software); p values of <0.05 were considered to be statistically significant.
Results
Tlr4 Deficiency Delays the Progression of Liver Tumors in PtenΔhep Mice
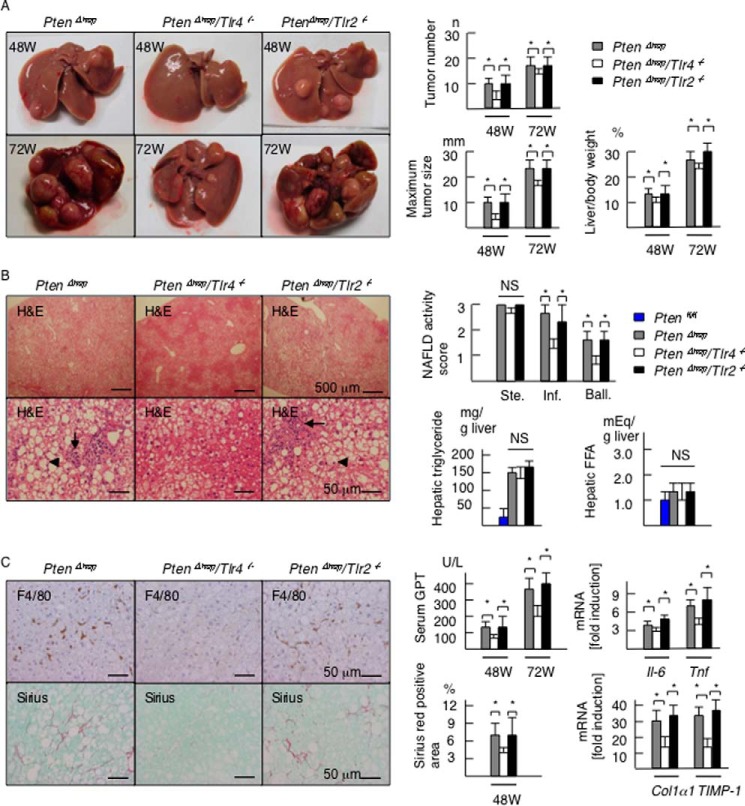
PTEN, a multifunctional phosphatase, regulates AKT signaling and functions as a tumor suppressor. PtenΔhep mice exhibit steatohepatitis and the subsequent development of liver tumors (17). In the present experiments, macroscopic liver tumors emerged after 36 weeks of age and subsequently expanded to infiltrate the entire liver with aging (Fig. 1A). First, we generated PtenΔhep/Tlr4−/− and PtenΔhep/Tlr2−/− double-mutant mice to determine whether TLR signaling is important for tumor progression. At 48 weeks of age, the incidence of macroscopic liver tumors in the PtenΔhep mice, the PtenΔhep/Tlr4−/− mice, and the PtenΔhep/Tlr2−/− mice was 96.7% (n, 29/30), 76% (n, 19/25), and 100% (n, 18/18), respectively. Although the incidence of tumors in the PtenΔhep/Tlr4−/− mice was significantly low at 48 weeks of age (p < 0.05), the incidence reached 100% by 72 weeks of age in all three groups. No liver tumors were found in the Ptenfl/fl mice, Tlr4−/− mice, or Tlr2−/− mice until 72 weeks of age. The average maximum tumor size, number of tumors, and ratio of liver to body weight were smaller in the PtenΔhep/Tlr4−/− mice than in the PtenΔhep mice and the PtenΔhep/Tlr2−/− mice at both 48 and 72 weeks of age (Fig. 1A). These data indicate that Tlr4 deficiency delayed the progression of liver tumors.
FIGURE 1.
Tlr4 deficiency delays the tumor progression and background inflammation in the PtenΔhep mice. A, representative photographs of the liver in the PtenΔhep mice, PtenΔhep/Tlr4−/− double-mutant mice, and PtenΔhep/Tlr2−/− double-mutant mice at 48 and 72 weeks of age. The tumor number, maximum tumor size, and liver to body weight ratio are shown in the right panel (48 weeks of age, n = 18–29; 72 weeks of age, n = 10 each). B, histological assessment of non-tumor areas in the liver examined on H&E staining (48 weeks of age). The PtenΔhep/Tlr4−/− mice displayed a similar grade of steatosis (upper panel), with reduced inflammatory cell infiltration (arrow) and hepatocyte ballooning (arrowhead). The non-alcoholic fatty liver disease activity score (right panel) was assessed by the grades of steatosis (Ste), inflammatory cell infiltration (Inf), and hepatocyte ballooning (Ball). Hepatic contents of triglyceride and FFA are shown in the right panel (n = 10 each). C, immunohistochemistry for F4/80 and Sirius red staining. Serum GPT levels, the gene expression of proinflammatory cytokines and profibrogenic factors in the non-tumor liver tissue, and the Sirius red-positive areas are shown in the right panel (48 weeks of age, n = 8–10). In the gene expression analysis, the fold induction is shown compared with that observed in the control Ptenfl/fl mice after normalization to the 18S RNA expression. Differences between multiple groups were compared using one-way ANOVA. The data are presented as the mean ± S.E. *, p < 0.05. NS, not significant.
We then compared the severity of background steatohepatitis to determine the association between tumor progression and inflammation. The PtenΔhep/Tlr4−/− mice exhibited a slow progression of steatohepatitis. Although steatosis was not suppressed in the PtenΔhep/Tlr4−/− mice, the degrees of inflammatory cell infiltration and hepatocytes ballooning were weak compared with that seen in the PtenΔhep mice (Fig. 1B). A histological assessment of inflammation, the serum GPT levels, and the gene expression of proinflammatory cytokines were suppressed in the PtenΔhep/Tlr4−/− mice versus the PtenΔhep mice (Fig. 1, B and C). Liver fibrosis became evident as inflammation persisted. Notably, the degree of liver fibrosis assessed on Sirius red staining and the gene expression levels of profibrogenic factors were also suppressed in the PtenΔhep/Tlr4−/− mice (Fig. 1C). In contrast, the PtenΔhep/Tlr2−/− mice showed similar grades of steatosis, inflammatory cell infiltration, and liver fibrosis to those observed in the PtenΔhep mice (Fig. 1, B and C). Because a former study showed that epiregulin function is involved in TLR4-mediated tumorigenesis (12), we examined the expression of epiregulin (ereg) and hepatocyte growth factor (hgf). The mRNA expression of ereg in the PtenΔhep/Tlr4−/− mice was equivalent to that of the PtenΔhep mice (Fig. 2). In contrast, the hgf expression was lower in the PtenΔhep/Tlr4−/− mice versus the PtenΔhep mice (Fig. 2). Thus, our model is different from the former chemical carcinogen-induced HCC model.
FIGURE 2.
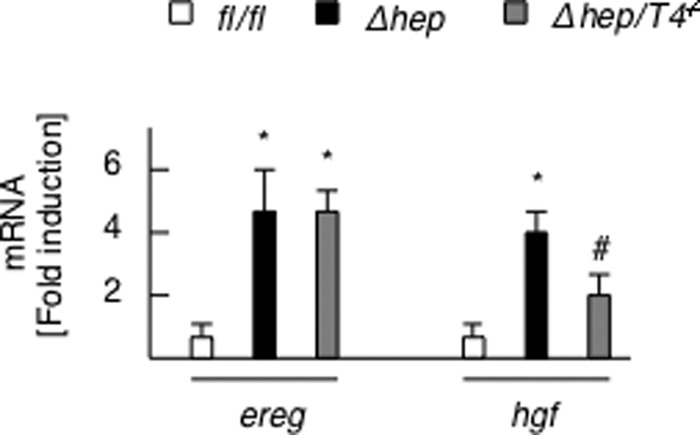
Expression of ereg and hgf. The gene expression of ereg and hgf in the non-tumor liver tissue of the Ptenfl/fl (fl/fl) mice, PtenΔhep mice (Δhep), and PtenΔhep/Tlr4−/− (Δhep/T4−/−) mice (48 weeks of age, n = 8–10) is shown. The fold induction is shown compared with that observed in the control Ptenfl/fl mice after normalization to the 18S RNA expression. Differences between multiple groups were compared using one-way ANOVA. The data are presented as the mean ± S.E. *, p < 0.05, compared with Ptenfl/fl mice. #, p < 0.05, compared with PtenΔhep mice.
Gut-derived LPS Is a TLR4 Ligand in the PtenΔhep Mice
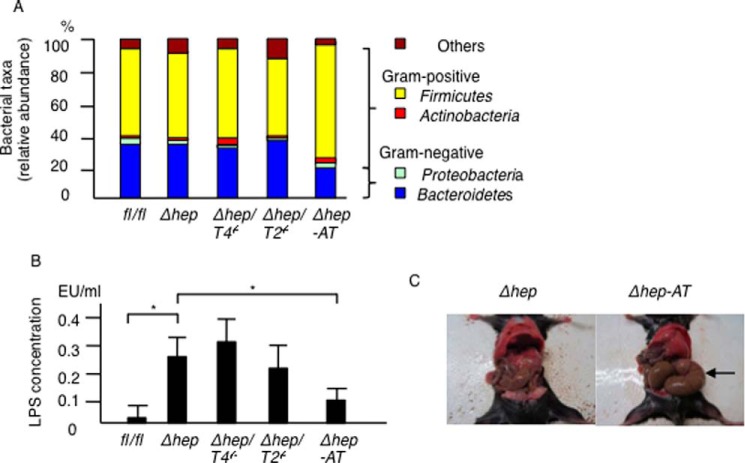
Recent studies have demonstrated that gut microbiota is associated with the development of liver tumors (6). Thus, we ruled out the possibility that alterations in the gut microbiota affected the tumor suppression seen in the PtenΔhep/Tlr4−/− mice. Consequently, the PtenΔhep/Tlr4−/− mice showed a similar gut microbiota composition to the control AlbCre-negative Ptenfl/fl mice, the PtenΔhep mice, and the PtenΔhep/Tlr2−/− mice (Fig. 3A), indicating that alterations in the gut microbiota at the phylum level are not the primary cause of tumor suppression in the PtenΔhep/Tlr4−/− mice. Interestingly, the portal LPS concentrations in the PtenΔhep mice and the PtenΔhep/Tlr4−/− mice were higher than that measured in the control Ptenfl/fl mice (Fig. 3B).
FIGURE 3.
Composition of gut microbiota and LPS concentration. A, composition of the gut microbiota in the Pten fl/fl (fl/fl) mice, PtenΔhep mice (Δhep), PtenΔhep/Tlr4−/− (Δhep/T4−/−) mice, PtenΔhep/Tlr2−/− (Δhep/T2−/−) mice, and antibiotic-treated PtenΔhep (Δhep-AT) mice. A relative abundance of gut bacteria at the phylum level is shown. Four mice from each group were used for sample collection. B, LPS concentration in the portal vein (n = 10 each). Differences between multiple groups were compared using one-way ANOVA. The data are presented as the mean ± S.E. *, p < 0.05. C, representative photographs of the cecum (48 weeks of age). Antibiotic treatment resulted in remarkable swelling of the cecum (arrow).
To determine the effect of gut-derived LPS, the gut was sterilized by an antibiotic mixture. Gut sterilization resulted in remarkable swelling of the cecum (Fig. 3C), indicating that antibiotic treatment was effective. Although a small amount of gut microbiota was detected even after gut sterilization, the gut microbiota composition altered with a relative decrease in Gram-negative bacteria belonging to the Proteobacteria and Bacteroidetes phyla (Fig. 3A). In addition, the antibiotic mixture reduced the LPS levels in the portal vein (Fig. 3B).
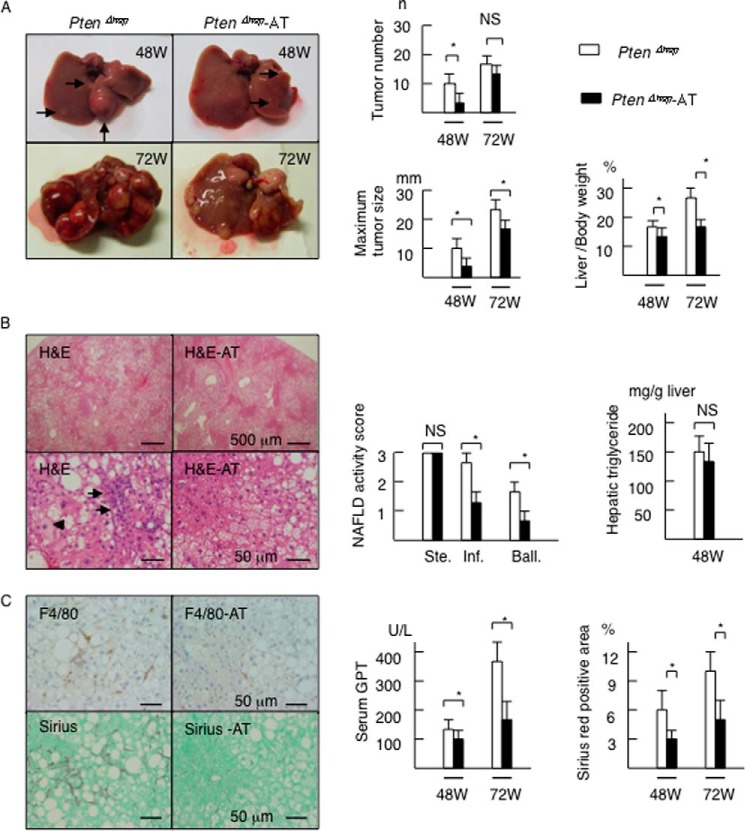
We then assessed tumor development and background steatohepatitis in the gut-sterilized mice. Gut sterilization decreased the number of macroscopic tumors, maximum size of the tumors, and liver to body weight ratio at 48 weeks of age (Fig. 4A). The size of the largest tumor and ratio of liver to body weight remained smaller in the gut-sterilized mice at 72 weeks of age (Fig. 4A). The tumor incidence in the antibiotic group showed a decreasing trend, although no significant differences were noted (data not shown). Gut sterilization also suppressed the grades of inflammatory cell infiltration and the incidence of hepatocyte ballooning, but not the severity of histological steatosis or the hepatic content of triglyceride at 48 weeks of age (Fig. 4B). Antibiotic treatment decreased the number of F4/80-positive cells (Fig. 4C) and the serum GPT levels (Fig. 4C). In addition, the antibiotic treatment attenuated subsequent liver fibrosis on Sirius red staining (Fig. 4C). These data suggest that gut-derived LPS contributes to the pathogenesis of tumor progression and background inflammation.
FIGURE 4.
Gut sterilization ameliorates the hepatic features of the PTENΔhep mice. A, PtenΔhep mice exhibited liver tumors (48W (W is weeks), arrows) and the number of tumors increased with age. Data for the tumor number, maximum tumor size, and liver to body weight ratio are shown in the right panel (48 weeks of age, n = 10–14; 72 weeks of age, n = 10 each). Differences between two groups were compared using the Mann-Whitney U test. B, histological assessment of the liver on H&E staining (48 weeks of age). The PtenΔhep mice showed severe steatosis (upper panel), infiltration of inflammatory cells (arrows), and hepatocyte ballooning (arrowhead). The non-alcoholic fatty liver disease activity score (right panel) was assessed by the grades of steatosis (Ste), inflammatory cell infiltration (Inf), and hepatocyte ballooning (Ball). Hepatic content of triglyceride is shown in the right panel. Differences between two groups were compared using the t test. C, immunohistochemistry for F4/80 and Sirius red staining. Serum GPT levels and Sirius red-positive areas are shown in the right panel. Differences between two groups were compared using the Mann-Whitney U test. The data are presented as the mean ± S.E. *, p < 0.05. NS, not significant.
FFA is a potential TLR4 ligand (22). However, the hepatic FFA content was at similar levels between the Ptenfl/fl mice and other mutant mice (Fig. 1B).
TLR4 on Hematopoietic Cells Contributes to Tumor Growth by Inducing Inflammation
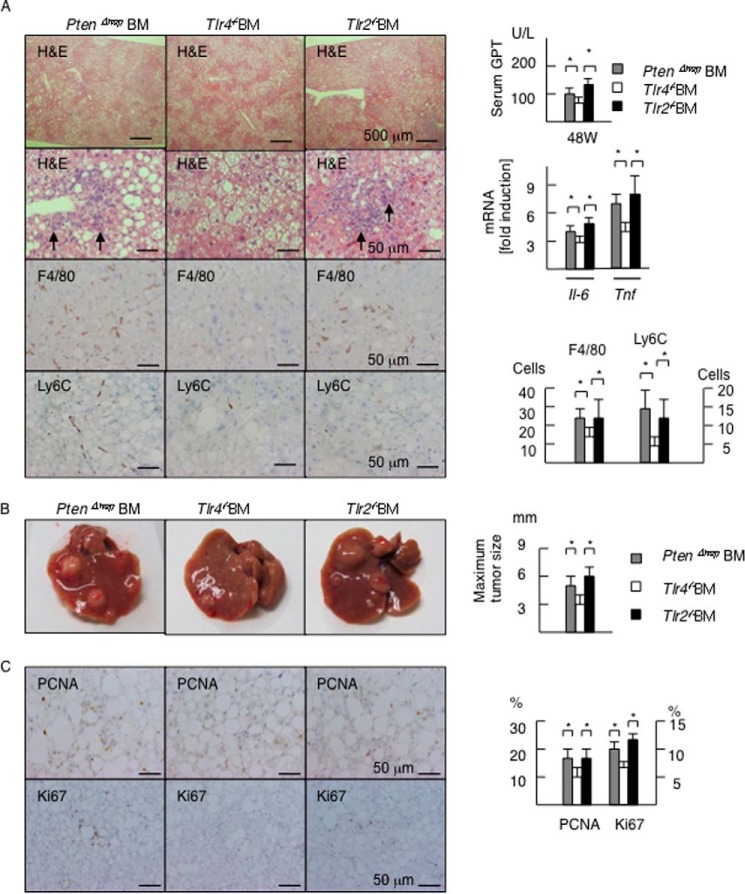
We subsequently sought to identify cells responsible for promoting inflammation and tumor growth via TLR4. To this end, we reconstituted hematopoietic cells by generating chimeric mice, in which BM cells lacking TLR were transplanted after the administration of lethal irradiation combined with the depletion of resident macrophages (9, 24). Transplanting Tlr4−/− BM cells resulted in the suppression of inflammatory cell infiltration in the PtenΔhep mice compared with that observed in the control BM or Tlr2−/− BM cells (Fig. 5A). Consistent with the histological findings on H&E staining, the numbers of F4/80-positive cells and Ly6C-positive cells were decreased in the Tlr4−/− BM-transplanted PtenΔhep mice (Fig. 5A). Transplanting Tlr4−/− BM cells resulted in lower serum GPT levels (Fig. 5A) and the hepatic mRNA expression of Il-6 and Tnf (Fig. 5A). At 48 weeks of age, the maximum tumor size in the Tlr4−/− BM-transplanted PtenΔhep mice was small compared with that noted in the control mice (Fig. 5B), in which BM cells from the PtenΔhep mice were transplanted into the PtenΔhep mice. Precancerous adenomas, representative tumors in the PtenΔhep mice at 48 weeks of age, showed that the labeling index of PCNA-positive and Ki67-positive cells was decreased in the Tlr4−/− BM-transplanted PtenΔhep mice (Fig. 5C). However, there were no significant differences in liver fibrosis (data not shown) or the incidence and number of tumors between the Tlr4−/− BM-transplanted mice and the control mice (data not shown), indicating that TLR4 present on BM-derived cells partially contributes to tumor development. In contrast, the incidence, numbers, and size of tumors in the Tlr2−/− BM-transplanted mice were equal to that seen in the control mice (Fig. 5B).
FIGURE 5.
TLR4 on hematopoietic cells contributes to tumor growth. A, histological assessment of the liver (48 weeks of age). BM cells isolated from the PtenΔhep mice (PtenΔhep BM), Tlr4−/− mice (Tlr4−/− BM), and Tlr2−/− mice (Tlr2−/− BM) were transplanted. Transplantation of Tlr4−/− BM cells suppressed inflammatory cell infiltration (arrows) examined on H&E staining. Immunohistochemistry for F4/80 and Ly6C is shown. Serum GPT levels, the gene expression of proinflammatory cytokines, and the numbers of positive cells are shown in the right panel. The fold induction is shown after normalization to the 18S RNA expression (n = 7–11). B, macroscopic appearance of the liver (48 weeks of age). The maximum tumor size is shown in the right panel. C, immunohistochemistry for PCNA and Ki67 in precancerous adenomas. The labeling index of PCNA- and Ki67-positive cells is shown in the right panel. Differences between multiple groups were compared using one-way ANOVA. The data are presented as the mean ± S.E. *, p < 0.05.
We also ruled out the possibility that TLR4 signaling in hepatocytes affects tumor development. A crucial mechanism by which Pten deficiency induces liver tumors is sustained activation of AKT. In this study, Tlr4 deficiency did not suppress AKT activation in hepatocytes (Fig. 6). In addition, AKT activation by insulin stimulation was equivalent between PtenΔhep hepatocytes and PtenΔhep/Tlr4−/− hepatocytes. These data support the notion that TLR4 on non-parenchymal cells, including hematopoietic cells, promotes inflammation as well as the emergence of HCC in the PtenΔhep mice.
FIGURE 6.
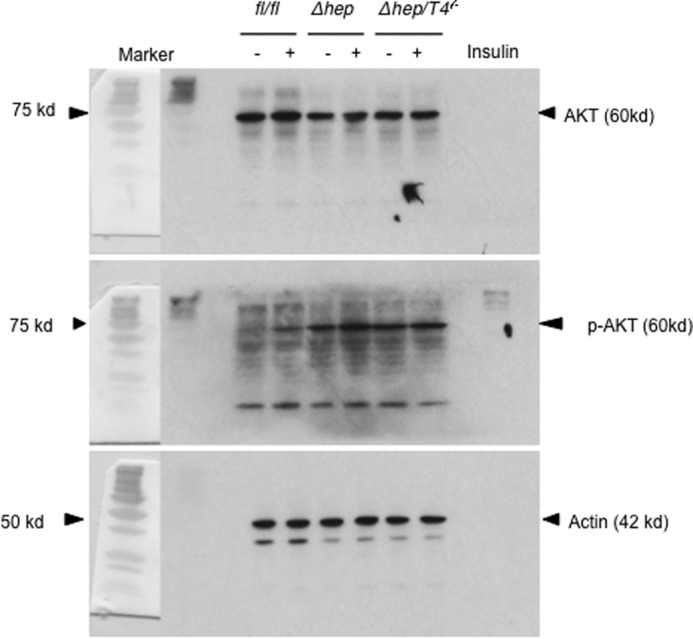
AKT activation in primary cultured hepatocytes. Hepatocytes were isolated from the Ptenfl/fl mice (fl/fl), the PtenΔhep mice (Δhep), and the PtenΔhep/T4−/− mice (Δhep/T4−/−) at 12 weeks of age. These primary-cultured hepatocytes were stimulated with or without 10 μg/ml insulin and harvested at 20 min after stimulation. Western blotting for p-AKT (Ser-473), AKT, and actin are shown.
Hepatic Macrophages Contribute to the Tumor Growth in the PtenΔhep Mice
Of the various hematopoietic cells expressing TLR4, we focused on macrophages because these cells are a major source of proinflammatory cytokines, which promote the progression of steatohepatitis (21, 24). Ly6C is a marker for inflammatory macrophages derived from the BM (25). An immunohistochemical study showed that the number of Ly6C-positive cells was increased in the liver of the PtenΔhep mice compared with the control Pten fl/fl mice. In contrast, the number of Ly6C-positive cells was decreased in the PtenΔhep mice treated with the antibiotics and the PtenΔhep/Tlr4−/− mice (Fig. 7A). Indeed, mRNA expression of Ly6C in liver tissue was decreased in the PtenΔhep mice treated with the antibiotic and the PtenΔhep/Tlr4−/− mice (Fig. 7B). As expected, hepatic macrophages isolated from the PtenΔhep mice showed an increased expression of Ly6C (Fig. 7C). Of the F4/80-positive cells isolated from the PtenΔhep mice at 24 weeks of age, 73.2% of cells were stained for Ly6C (Fig. 7D). However, less than 3% of Ly6C-positive cells was observed in F4/80-positive macrophages isolated from the Ptenfl/fl mice at 24 weeks of age. These data suggest that Ly6C-positive cells were recruited into the liver, and the majority of Ly6C-positive cells were macrophages in the PtenΔhep mice. Although we examined macrophage M1 and M2 markers, macrophages from the PtenΔhep mice expressed both M1 and M2 markers (Fig. 8). Macrophages from the PtenΔhep/Tlr4−/− mice showed a lower expression of M1 markers; however, M2 markers demonstrated mixed data; the Il-10 expression was decreased, whereas the arginase expression was increased compared with those from the PtenΔhep mice. Thus, macrophages in the PtenΔhep mice and the PtenΔhep/Tlr4−/− mice were not clearly divided into M1 and M2 macrophages.
FIGURE 7.
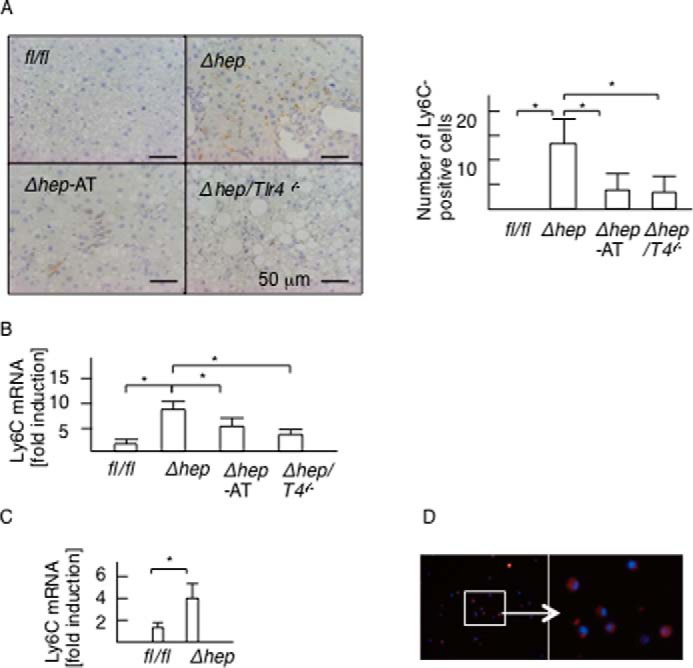
Ly6C-positive macrophages is associated with steatohepatitis and tumor growth in the PtenΔhep mice. A, immunohistochemistry for Ly6C in the liver of Pten fl/fl (fl/fl) mice, PtenΔhep mice (Δhep), antibiotic-treated PtenΔhep (Δhep-AT) mice, and the PtenΔhep/Tlr4−/− (Δhep/T4−/−) mice. The number of Ly6C-positive cells is shown in the right panel. B and C, gene expression of Ly6C in the liver (B) and isolated macrophages (C). Differences between two groups were compared using the Mann-Whitney U test. The data are presented as the mean ± S.E. *, p < 0.05. D, immunofluorescent staining for Ly6C. F4/80-positive macrophages were separated from mice using a magnetic activated cell separation system. These F4/80-positive cells were subjected to immunofluorescent staining for Ly6C. We also counted the number of Ly6C-positive cells in DAPI-positive cells.
FIGURE 8.
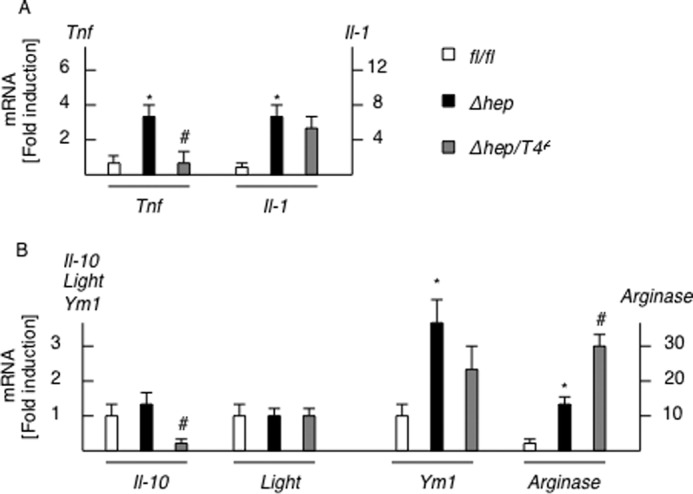
Macrophage M1 and M2 expression in isolated macrophages. Hepatic macrophages were isolated from the Ptenfl/fl mice (f/f), the PtenΔhep mice (Δhep), and the PtenΔhep/T4−/− mice (Δhep/T4−/−) (n = 4 each). M1 markers (A) and M2 markers (B) were examined by quantitative real time PCR. Differences between two groups were compared using the Mann-Whitney U test. The data are presented as the mean ± S.E. *, p < 0.05, compared with Ptenfl/fl mice. #, p < 0.05, compared with PtenΔhep mice.
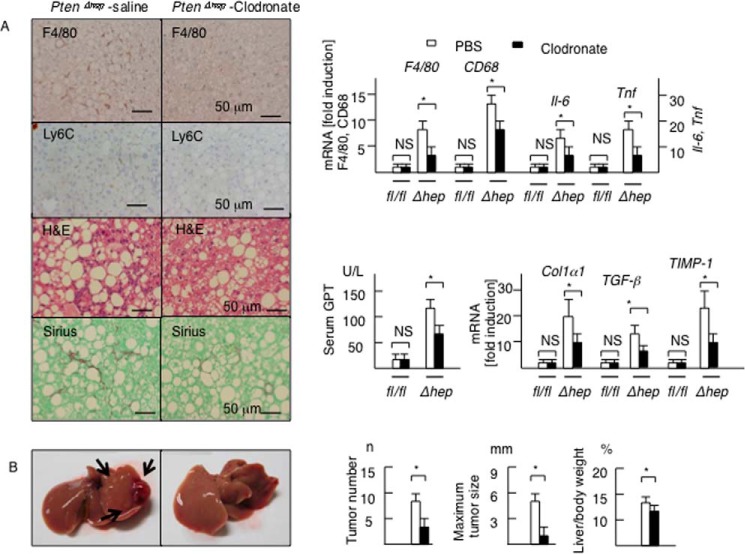
To confirm the role of macrophages in tumor growth, hepatic macrophages, including Ly6C-positive macrophages, were depleted via repeated injections of liposomal clodronate from 24 to 48 weeks of age. The injections of liposomal clodronate successfully depleted F4/80-positive cells as well as Ly6C-positive cells in the liver (Fig. 9A). As expected, the mRNA levels of macrophage markers and proinflammatory cytokines, including Il-6 and Tnf, were decreased by clodronate administration in the PtenΔhep mice (Fig. 9A). Furthermore, macrophage depletion ameliorated histological improvement of steatohepatitis, including liver fibrosis examined on Sirius red staining, and lowered the serum GPT and the gene expression levels of profibrogenic factors (Fig. 9A). As a result, this depletion significantly reduced the tumor size and number (Fig. 9B). These data demonstrate that hepatic macrophages contribute to tumor growth as well as inflammation.
FIGURE 9.
Hepatic macrophages contribute to tumor growth in the PtenΔhep mice. A, PtenΔhep mice were injected with control liposome or liposomal clodronate (n = 6–8 each). Representative photographs of liver sections (48 weeks of age) are shown. Inflammatory cell infiltration (H&E, F4/80, Ly6C) and liver fibrosis (Sirius red staining) were reduced by clodronate treatment. The gene expression of macrophage markers, proinflammatory cytokines, and profibrogenic factors and the serum GPT levels are shown in the right panel. The fold induction is shown after normalization to the 18S RNA expression. Differences between two groups were compared using the Mann-Whitney U test. B, representative photographs of the liver. The arrow shows liver tumors (48 weeks of age). The tumor number, maximum tumor size, and liver to body weight ratio are shown in the right panel. Differences between two groups were compared using the Mann-Whitney U test. The data are presented as the mean ± S.E. *, p < 0.05. NS, not significant
Macrophages in the PtenΔhep Mice Are Highly Susceptible to LPS through Oxidative Stress
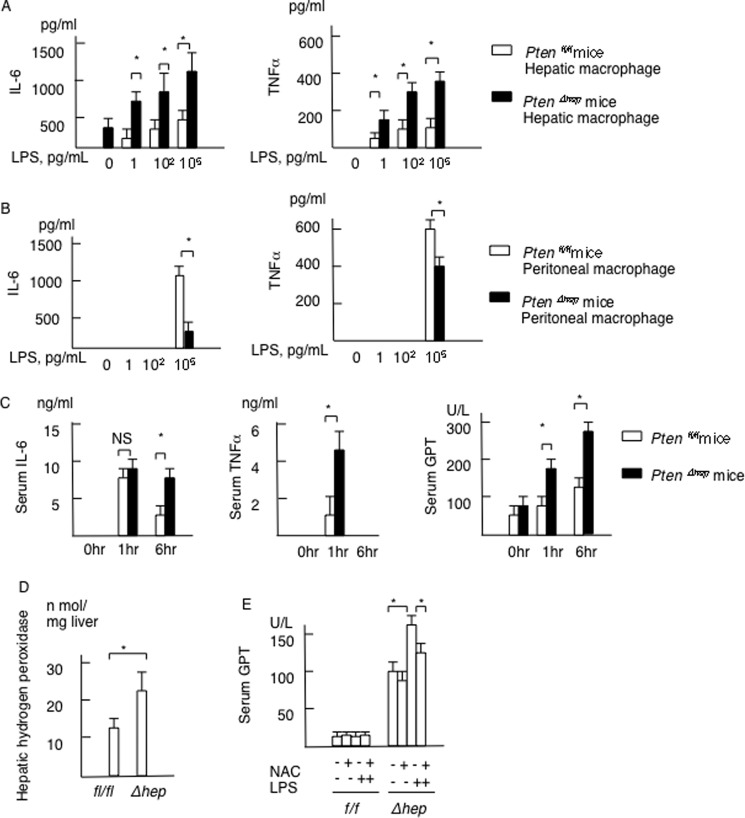
Because the hepatic macrophage is a key player in tumor growth, we evaluated the response of macrophages to TLR4 ligand LPS. Freshly isolated hepatic macrophages from the PtenΔhep mice produced IL-6 without TLR ligand stimulation. In addition, hepatic macrophages from the PtenΔhep mice produced much more IL-6 and TNFα in response to LPS than those obtained from the control Ptenfl/fl mice (Fig. 10A). These findings were observed even at 1 pg/ml LPS, a concentration of portal LPS noted in the PtenΔhep mice. In contrast, peritoneal macrophages showed a weak response to a low concentration of LPS (Fig. 10B). In addition, peritoneal macrophages isolated from the control Ptenfl/fl mice produced much more IL-6 and TNFα compared with the PtenΔhep mice in response to LPS stimulation (Fig. 10B). These data indicate that hepatic macrophages in the PtenΔhep mice were highly susceptible to LPS. We then examined the sensitivity to LPS in vivo using mice primed with P. acnes, which enhances susceptibility to LPS (26). Consequently, LPS challenge in the PtenΔhep mice primed with P. acnes resulted in further elevation of the serum IL-6, TNFα, and GPT levels compared with that seen in the control Ptenfl/fl mice (Fig. 10C). Thus, hepatic macrophages in the PtenΔhep mice are highly susceptible to LPS in vitro and in vivo.
FIGURE 10.
Macrophages in the PtenΔhep mice are highly susceptible to LPS. A, hepatic macrophages isolated from the Ptenfl/fl and the PtenΔhep mice were stimulated with LPS at the indicated concentration. The concentrations of IL-6 and TNFα in the supernatant are presented (n = 4 each). B, peritoneal macrophages isolated from the Ptenfl/fl and the PtenΔhep mice were stimulated with LPS at the indicated concentration. The concentrations of IL-6 and TNFα in the supernatant are presented (n = 5 each). C, mice primed with P. acnes were injected with LPS (n = 10 each). The serum IL-6, TNFα, and GPT levels are presented as the indicated time points. D, hydrogen peroxidase content in non-tumor liver tissue (n = 5 each, 48 weeks of age). E, serum GPT levels in the Ptenfl/fl and the PtenΔhep mice stimulated with LPS after treated with or without the anti-oxidant N-acetyl-l-cysteine. Serum samples were collected at 6 h after the LPS injection (n = 4 each). Differences between two groups were compared using the Mann-Whitney U test. The data are presented as the mean ± S.E. *, p < 0.05. NS, not significant.
Because oxidative stress is a potential mechanism to enhance the sensitivity to LPS (27), we measured hydrogen peroxidase levels in the liver. Hydrogen peroxidase levels in the PtenΔhep mice were higher than in the Ptenfl/fl mice at 48 weeks of age (Fig. 10D). LPS challenge to the PtenΔhep mice elevated the serum GPT levels (Fig. 10E). By neutralization with anti-oxidant agent N-acetyl-l-cysteine, the serum GPT levels were decreased in the PtenΔhep mice stimulated with LPS (Fig. 10E). These data indicate that oxidative stress enhances the sensitivity to LPS in the PtenΔhep mice.
Proinflammatory Cytokines Increase the Proliferation of Putative Cancer Progenitor Cells
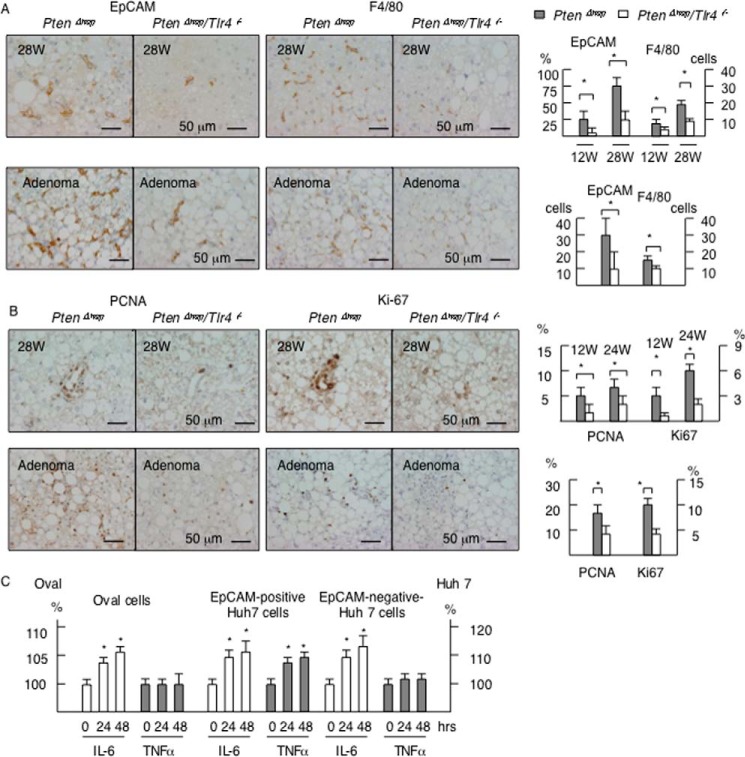
It is well known that immature epithelial cells, such as oval cells (28), emerge prior to the development of tumors in liver injury models, including PtenΔhep mice (29). In addition, these cells are able to form tumors when transplanted into mice (30, 31), indicating that these immature epithelial cells include cancer progenitor cells. Because EpCAM is used as a marker of oval cells (23) and cancer progenitor cells (32), we examined the distribution of EpCAM-positive cells in the PtenΔhep mice. EpCAM-positive epithelial cells emerged in non-portal areas of the PtenΔhep mice at 12 weeks of age and increased in number with aging. In contrast, EpCAM-positive cells were rarely detected at 12 weeks of age, and the increase was blunt, in the PtenΔhep/Tlr4−/− mice (Fig. 11A). Because macrophages contribute to tumor growth, we focused on the association between macrophages and putative cancer progenitor cells. The EpCAM-positive cells increased in number parallel to the F4/80-positive macrophage count (Fig. 11A). These findings were observed in both the non-tumor areas and precancerous adenomas (Fig. 11A). The immature cells were found to be highly proliferative, based on the PCNA- and Ki67-labeling indices, in the PtenΔhep mice and less so in the PtenΔhep/Tlr4−/− mice (Fig. 11B). Therefore, macrophage-mediated inflammation is likely to induce the proliferation of EpCAM-positive cells in the PtenΔhep mice.
FIGURE 11.
Inflammation increases the proliferation of putative cancer progenitor cells. A, immunohistochemistry for EpCAM and F4/80 in non-tumor areas (28 weeks of age) and precancerous adenoma (48 weeks of age). The numbers of EpCAM-positive cells and F4/80-positive cells in non-tumor tissue are shown in the right panel. Because the number of EpCAM-positive cells was small until 28 weeks of age, we randomly selected 50 fields and counted the frequency of fields, in which EpCAM-positive cells are observed. The numbers of F4/80-positive cells per field are shown. B, immunohistochemistry for PCNA and Ki-67 in non-tumor areas (28 weeks of age) and precancerous adenoma (48 weeks of age). The labeling index of PCNA- and Ki67-positive cells is shown in the right panel. The χ2 test (EpCAM cells in 28 weeks, Ki67- and PCNA-positive cells) and the Mann-Whitney U test (EpCAM-positive cells in adenomas, F4/80-positive cells) were used for statistical analysis. C, 3-(4,5-dimethylthiazol-2-yl)-2,5-diphenyltetrazolium bromide assay. The cells were treated with 10 ng/ml IL-6 or 10 ng/ml TNFα for 24 or 48 h. Eight wells were measured, and the values were compared with those observed in the non-treatment group. Differences between multiple groups were compared using one-way ANOVA. The data are presented as the mean ± S.E. *, p < 0.05.
To determine the effects of proinflammatory cytokines on putative cancer progenitor cells, we subsequently examined the proliferation of EpCAM-positive oval cells isolated from injured liver (23) and Huh 7 cells, a human HCC cell line. Consequently, IL-6 promoted the proliferation of oval cells (Fig. 11C). In addition, we isolated EpCAM-positive cells from Huh 7 cells (Fig. 12), which have features of cancer progenitor cells (32). Notably, the EpCAM-positive Huh 7 cells increased in number in response to both IL-6 and TNFα (Fig. 11C), and IL-6 promoted the proliferation of EpCAM-negative Huh 7 cells. These data demonstrate that proinflammatory cytokines induce the proliferation of putative cancer progenitor cells as well as HCC cells. In contrast, LPS had little effect on the proliferation of oval cells or Huh 7 cells (data not shown) and did not induce the expression of proinflammatory cytokines, including IL-6 and TNFα, in the EpCAM-positive oval cells or Huh 7 cells (data not shown). These data suggest that macrophage-derived proinflammatory cytokines contribute to cell proliferation.
FIGURE 12.
Isolation of EpCAM-positive Huh 7 cells. Huh 7 cells were divided into EpCAM-positive cells and EpCAM-negative 7 cells using magnetically activated cell sorting. A, EpCAM mRNA expression examined by quantitative real time PCR (n = 4 each). Differences between the two groups were compared using the Mann-Whitney U test. The data are presented as the mean ± S.E. *, p < 0.05. B, EpCAM-positive cells were successfully isolated from Huh 7 cells.
TLR4-mediated Inflammation Promotes HCC Development
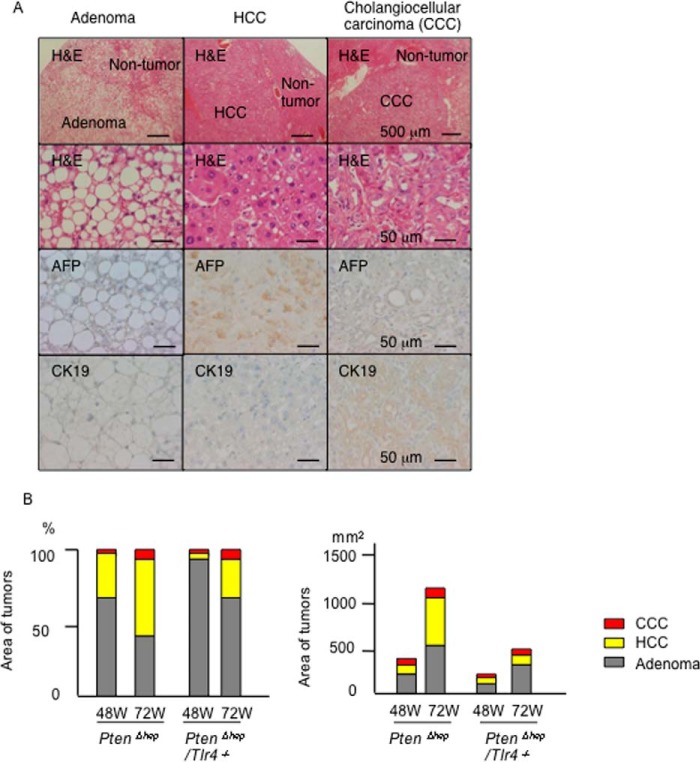
Finally, we examined the histological differences of the tumors between the PtenΔhep mice and PtenΔhep/Tlr4−/− mice. Most tumors observed at 48 weeks of age were precancerous adenomas, and HCC and cholangiocellular carcinoma were subsequently observed until 72 weeks of age (Fig. 13, A and B). We measured the areas of these tumors and found the most frequent tumor to be adenoma (70.2%), followed by HCC (26.7%), and cholangiocellular carcinoma (3.1%) in the PtenΔhep mice at 48 weeks of age (Fig. 13B). At 72 weeks of age, the sum of the area had increased for all three types of tumors (Fig. 13B). Of the tumor types, the proportion of HCC (46.8%) was dramatically increased, whereas that of adenoma (47.7%) was decreased in the PtenΔhep mice. In contrast, the area of the HCC lesions was far smaller in the PtenΔhep/Tlr4−/− mice at 48 weeks of age (6.17%). At 72 weeks of age, the increase in the number of HCC lesions was blunt, with the proportion of HCC lesions remaining at 21.7%, in the PtenΔhep/Tlr4−/− mice (Fig. 13B).
FIGURE 13.
TLR4-mediated inflammation promotes HCC development. A, characteristics of the tumors that developed in the PtenΔhep mice. The adenoma cells were rich in lipid droplets but negative for α-fetoprotein (AFP) and cytokeratin 19 (CK19). α-Fetoprotein and cytokeratin 19 were used as markers for HCC and cholangiocellular carcinoma (CCC), respectively. B, area of the tumors (n = 25–113) was measured using the ImageJ software program. The proportions of adenomas, HCC, and cholangiocellular carcinoma lesions are shown in the left panel, and the sum of the area is shown in the right panel.
Discussion
We herein demonstrated that TLR4 signaling promotes hepatic inflammation as well as subsequent tumor development in the PtenΔhep mice. Antibiotic treatment suppressed tumor growth in association with a decreasing LPS level in the portal vein, indicating that the gut microbiota serves as a source of a TLR4 ligand. In addition, LPS challenge enhanced the degree of liver injury in the PtenΔhep mice, in which macrophages were highly sensitive to LPS. Proinflammatory cytokines produced by macrophages promoted the emergence of putative cancer progenitor cells and the development of HCC. These data are in accordance with the findings of former reports showing that the LPS-TLR4 pathway promotes the progression of non-alcoholic steatohepatitis (8) and liver tumors (12), in which resident macrophages and hepatic stellate cells are key players, respectively. In this study, we demonstrated that recruited macrophages expressing Ly6C also play a role in tumor development.
Our initial hypothesis was that TLR2 signaling additionally promotes inflammation as well as tumor growth. However, Tlr2 deficiency did not protect against liver injury in the PtenΔhep mice. Similar findings were also observed in another tumor-bearing mouse model using diethylnitrosamine plus carbon tetrachloride (12). The role of TLR2 is not always equal to that of TLR4, although they share a common signaling pathway via MyD88. Indeed, former reports using Tlr2−/− mice showed oppositional results in experimental steatohepatitis models; TLR2 deficiency reduced hepatic inflammation in mice on a choline-deficient diet (24) or on a high fat diet (33) but not those on a methionine and choline-deficient diet (34). In the case of Tlr2−/− mice on a methionine- and choline-deficient diet, sensitivity to LPS increased, which resulted in severe inflammation. Oxidative stress is a potential mechanism that increases sensitivity to LPS in the setting of steatohepatitis (27). Indeed, the PtenΔhep mice exhibited higher levels of oxidative stress (17) and increased sensitivity to LPS. Paik et al. (35) reported that a higher concentration of ligands is required to activate TLR2 versus TLR4, suggesting that LPS activates TLR4 signaling before TLR2 ligands reach sufficient concentrations to stimulate TLR2. As a result, TLR4 signaling may compensate for the lack of TLR2 signaling in the PtenΔhep mice.
Macrophages expressing Ly6C are BM-derived macrophages that contribute to the development of liver diseases, including steatohepatitis (36, 37). We demonstrated here that Ly6C-positive macrophages were also associated with the development of liver tumors in the PtenΔhep mice. Indeed, Ly6C-positive macrophages were rarely observed in the normal liver, suggesting that Ly6C-positive macrophages were recruited from the circulation during the progression of liver injury. Our data further demonstrated that chemical depletion of macrophages, including Ly6C-positive macrophages and Kupffer cells, suppressed inflammation as well as tumor growth compared with those observed in chimeric mice. We previously reported that depletion of Kupffer cells ameliorated the severity of steatohepatitis (38). These data suggested that resident macrophage Kupffer cells also contribute to inflammation as well as tumor progression. Macrophage polarization to M1 and M2 is often used to characterize macrophages, in which M1 macrophages exhibit an inflammatory phenotype, and M2 macrophages are alternatively activated, including an anti-inflammatory phenotype. We speculated that hepatic macrophages in the PtenΔhep mice predominantly polarize to the M1 phenotype than the M2 phenotype compared with those in the PtenΔhep/Tlr4−/− mice. However, this polarization was not observed in the PtenΔhep mice. Although M1 macrophages likely show a similar phenotype to Ly6C-positive macrophages and may include Ly6C-positive macrophages, the relationship between M1 macrophages and Ly6C-positive macrophages remained unclear.
Hepatic macrophages are the principal cells that produce “cancer-promoting cytokines,” including IL-6 and TNFα, in response to LPS. Hepatic macrophages in the PtenΔhep mice produced higher levels of these cytokines compared with those in the Ptenfl/fl mice. In addition, hepatic macrophages in the PtenΔhep mice responded to a low concentration of LPS compared with peritoneal macrophages in the PtenΔhep mice. These data demonstrated that hepatic macrophages in the PtenΔhep mice were highly susceptible to LPS. Because of the lack of TLR4 signaling in macrophages, the expression of these cytokines was decreased in the tumor-suppressed groups, including the PtenΔhep/Tlr4−/− mice and Tlr4−/− BM-transplanted chimeric mice, compared with the control mice. In addition, macrophage depletion suppressed tumor development in association with decreasing levels of these cytokines. Hepatic macrophages also contribute to tumor growth in the diethylnitrosamine-induced HCC model by producing IL-6 and TNFα (39). A lack of these cytokines results in a reduction in the incidence of HCC (40). IL-6 and TNFα have been reported to induce the proliferation of oval cells (41, 42), putative cancer progenitor cells that emerge in severe liver injury. In addition, IL-6 is a key cytokine in the development of HCC (43). In this study, we showed that IL-6 induces the proliferation of oval cells and Huh 7 cells. In vivo, epithelial cells expressing the stem cell marker EpCAM emerged in the non-tumor tissue and increased in number under the condition of sustained inflammation in the PtenΔhep mice. Cancer progenitor cells are observed in PtenΔhep mice prior to tumor development (29), and isolated cancer progenitor cells are capable of promoting tumor formation (30). Hence, the proinflammatory cytokines produced by macrophages contributed to tumor growth by inducing the proliferation of cancer progenitor cells and tumor cells in the PtenΔhep mice.
Although we focused on the role of macrophages in the development of steatohepatitis and liver tumors, we considered that TLR4 on other cells also assists in tumor growth in the PtenΔhep mice. For instance, TLR4 present on hepatic stellate cells, principal cells that produce collagen, has been reported to promote tumor growth in another tumor-bearing model (12). Hepatic stellate cells may contribute to hepatic tumor development in the PtenΔhep mice for the following reasons: 1) liver fibrosis progressed as the liver tumors grew; 2) transplantation of Tlr4−/− BM cells into the PtenΔhep mice showed a partial effect on tumor suppression, in which liver fibrosis was not attenuated; and 3) macrophage depletion after established liver fibrosis had a smaller effect on tumor suppression (data not shown). In the PtenΔhep mice, liver fibrosis and activated hepatic stellate cells determined by the α-smooth muscle actin expression were rarely found in the early stage of tumor growth, suggesting that the contribution of hepatic stellate cells is relatively small in the early stage. Instead, sustained inflammation induced by macrophages was present prior to tumor development. Therefore, we speculate that macrophages contribute to the early stages of tumor growth, although hepatic stellate cells contribute to the late stages. Dapito et al. (12) demonstrated that hepatic stellate cells play a role in tumor promotion rather than initiation in an HCC-bearing model.
It is interesting to note whether oval cells, putative cancer progenitor cells, acquire the HCC phenotype in response to LPS. However, LPS stimulation increased the expression of α-fetoprotein, a marker for HCC, in EpCAM-positive Huh7 cells but not in isolated oval cells in this study (data not shown). Because cancer progenitor cells can form tumors when transplanted to the inflamed liver (31), additional factors are likely required for transformation into tumor lineage cells. In addition, the number of cancer progenitor cells may have been small in the oval cell line because oval cells are reported to be a heterogeneous population. Further examinations are thus required to clarify the tumorigenicity of oval cells.
In summary, gut-derived LPS induced inflammation via TLR4 on macrophages. TLR4-mediated inflammation subsequently promoted the expansion of putative cancer progenitor cells and may have induced differentiation into HCC. Currently, little information is available regarding the role of TLRs in the development of HCC. HCC is a good model of inflammation-related cancer, and the severity of inflammation is associated with the progression of liver diseases (44). Therefore, TLR4 is an attractive target for preventing HCC.
Author Contributions
K. M. designed the project, performed experiments, and wrote the manuscript. M. I. analyzed composition of gut microbiota and performed some of the experiments. S. M., Y. H., S. O., and T. G. generated and maintained the mice and performed a part of the in vivo experiments. H. O. designed the experiments and managed the project.
Acknowledgments
We thank Dr. Miyajima (University of Tokyo, Japan) for providing oval cell lines; Dr. van Rooijen (Vrije Universiteit Medical Center, The Netherlands) for liposomal clodronate; and Daichi Nakagawa (Akita University), Yosuke Osawa (Tokyo Metropolitan Cancer and Infectious Diseases Center Komagome Hospital), and Hirotaka Kimura (Akita University Graduate School of Medicine) for excellent technical assistance.
The authors declare that they have no conflicts of interest with the contents of this article.
- HCC
- hepatocellular carcinoma
- TLR
- Toll-like receptor
- BM
- bone marrow
- PCNA
- proliferating cell nuclear antigen
- ANOVA
- analysis of variance
- ereg
- epiregulin
- hpf
- hepatocyte growth factor
- GPT
- glutamic pyruvic transaminase
- FFA
- free fatty acid.
References
- 1. El-Serag H. B. (2012) Epidemiology of viral hepatitis and hepatocellular carcinoma. Gastroenterology 142, 1264–1273.e1 [DOI] [PMC free article] [PubMed] [Google Scholar]
- 2. Forner A., Llovet J. M., and Bruix J. (2012) Hepatocellular carcinoma. Lancet 379, 1245–1255 [DOI] [PubMed] [Google Scholar]
- 3. Tarao K., Takemiya S., Tamai S., Sugimasa Y., Ohkawa S., Akaike M., Tanabe H., Shimizu A., Yoshida M., and Kakita A. (1997) Relationship between the recurrence of hepatocellular carcinoma (HCC) and serum alanine aminotransferase levels in hepatectomized patients with hepatitis C virus-associated cirrhosis and HCC. Cancer 79, 688–694 [DOI] [PubMed] [Google Scholar]
- 4. Tarao K., Rino Y., Ohkawa S., Shimizu A., Tamai S., Miyakawa K., Aoki H., Imada T., Shindo K., Okamoto N., and Totsuka S. (1999) Association between high serum alanine aminotransferase levels and more rapid development and higher rate of incidence of hepatocellular carcinoma in patients with hepatitis C virus-associated cirrhosis. Cancer 86, 589–595 [DOI] [PubMed] [Google Scholar]
- 5. Yoshida H., Shiratori Y., Moriyama M., Arakawa Y., Ide T., Sata M., Inoue O., Yano M., Tanaka M., Fujiyama S., Nishiguchi S., Kuroki T., Imazeki F., Yokosuka O., Kinoyama S., et al. (1999) Interferon therapy reduces the risk for hepatocellular carcinoma: National Surveillance Program of Cirrhotic and Noncirrhotic Patients with Chronic Hepatitis C in Japan. Ann. Intern. Med. 131, 174–181 [DOI] [PubMed] [Google Scholar]
- 6. Miura K., and Ohnishi H. (2014) Role of gut microbiota and Toll-like receptors in non-alcoholic fatty liver disease. World J. Gastroenterol. 20, 7381–7391 [DOI] [PMC free article] [PubMed] [Google Scholar]
- 7. Kawai T., and Akira S. (2010) The role of pattern-recognition receptors in innate immunity: update on Toll-like receptors. Nat. Immunol. 11, 373–384 [DOI] [PubMed] [Google Scholar]
- 8. Rivera C. A., Adegboyega P., van Rooijen N., Tagalicud A., Allman M., and Wallace M. (2007) Toll-like receptor-4 signaling and Kupffer cells play pivotal roles in the pathogenesis of non-alcoholic steatohepatitis. J. Hepatol. 47, 571–579 [DOI] [PMC free article] [PubMed] [Google Scholar]
- 9. Seki E., De Minicis S., Osterreicher C. H., Kluwe J., Osawa Y., Brenner D. A., and Schwabe R. F. (2007) TLR4 enhances TGF-β signaling and hepatic fibrosis. Nat. Med. 13, 1324–1332 [DOI] [PubMed] [Google Scholar]
- 10. Wang Z., Yan J., Lin H., Hua F., Wang X., Liu H., Lv X., Yu J., Mi S., Wang J., and Hu Z.-W. (2013) Toll-like receptor 4 activity protects against hepatocellular tumorigenesis and progression by regulating expression of DNA repair protein Ku70 in mice. Hepatology 57, 1869–1881 [DOI] [PubMed] [Google Scholar]
- 11. Yoshimoto S., Loo T. M., Atarashi K., Kanda H., Sato S., Oyadomari S., Iwakura Y., Oshima K., Morita H., Hattori M., Hattori M., Honda K., Ishikawa Y., Hara E., and Ohtani N. (2013) Obesity-induced gut microbial metabolite promotes liver cancer through senescence secretome. Nature 499, 97–101 [DOI] [PubMed] [Google Scholar]
- 12. Dapito D. H., Mencin A., Gwak G.-Y., Pradere J.-P., Jang M.-K., Mederacke I., Caviglia J. M., Khiabanian H., Adeyemi A., Bataller R., Lefkowitch J. H., Bower M., Friedman R., Sartor R. B., Rabadan R., and Schwabe R. F. (2012) Promotion of hepatocellular carcinoma by the intestinal microbiota and TLR4. Cancer Cell 21, 504–516 [DOI] [PMC free article] [PubMed] [Google Scholar]
- 13. Fan Q. M., Jing Y. Y., Yu G. F., Kou X. R., Ye F., Gao L., Li R., Zhao Q. D., Yang Y., Lu Z. H., and Wei L. X. (2014) Tumor-associated macrophages promote cancer stem cell-like properties via transforming growth factor-β1-induced epithelial–mesenchymal transition in hepatocellular carcinoma. Cancer Lett. 352, 160–168 [DOI] [PubMed] [Google Scholar]
- 14. Osawa Y., Suetsugu A., Matsushima-Nishiwaki R., Yasuda I., Saibara T., Moriwaki H., Seishima M., and Kozawa O. (2013) Liver acid sphingomyelinase inhibits growth of metastatic colon cancer. J. Clin. Invest. 123, 834–843 [DOI] [PMC free article] [PubMed] [Google Scholar]
- 15. Sica A., and Mantovani A. (2012) Macrophage plasticity and polarization: in vivo veritas. J. Clin. Invest. 122, 787–795 [DOI] [PMC free article] [PubMed] [Google Scholar]
- 16. Hu T.-H., Huang C.-C., Lin P.-R., Chang H.-W., Ger L.-P., Lin Y.-W., Changchien C.-S., Lee C.-M., and Tai M.-H. (2003) Expression and prognostic role of tumor suppressor gene PTEN/MMAC1/TEP1 in hepatocellular carcinoma. Cancer 97, 1929–1940 [DOI] [PubMed] [Google Scholar]
- 17. Horie Y., Suzuki A., Kataoka E., Sasaki T., Hamada K., Sasaki J., Mizuno K., Hasegawa G., Kishimoto H., Iizuka M., Naito M., Enomoto K., Watanabe S., Mak T. W., and Nakano T. (2004) Hepatocyte-specific Pten deficiency results in steatohepatitis and hepatocellular carcinomas. J. Clin. Invest. 113, 1774–1783 [DOI] [PMC free article] [PubMed] [Google Scholar]
- 18. Rakoff-Nahoum S., Paglino J., Eslami-Varzaneh F., Edberg S., and Medzhitov R. (2004) Recognition of commensal microflora by toll-like receptors is required for intestinal homeostasis. Cell 118, 229–241 [DOI] [PubMed] [Google Scholar]
- 19. Kleiner D. E., Brunt E. M., Van Natta M., Behling C., Contos M. J., Cummings O. W., Ferrell L. D., Liu Y. C., Torbenson M. S., Unalp-Arida A., Yeh M., McCullough A. J., Sanyal A. J., and Non-alcoholic Steatohepatitis Clinical Research Network. (2005) Design and validation of a histological scoring system for non-alcoholic fatty liver disease. Hepatology 41, 1313–1321 [DOI] [PubMed] [Google Scholar]
- 20. Jin J.-S., Touyama M., Hisada T., and Benno Y. (2012) Effects of green tea consumption on human fecal microbiota with special reference to Bifidobacterium species. Microbiol. Immunol. 56, 729–739 [DOI] [PubMed] [Google Scholar]
- 21. Miura K., Kodama Y., Inokuchi S., Schnabl B., Aoyama T., Ohnishi H., Olefsky J. M., Brenner D. A., and Seki E. (2010) Toll-like receptor 9 promotes steatohepatitis by induction of interleukin-1β in mice. Gastroenterology 139, 323–334 [DOI] [PMC free article] [PubMed] [Google Scholar]
- 22. Shi H., Kokoeva M. V., Inouye K., Tzameli I., Yin H., and Flier J. S. (2006) TLR4 links innate immunity and fatty acid–induced insulin resistance. J. Clin. Invest. 116, 3015–3025 [DOI] [PMC free article] [PubMed] [Google Scholar]
- 23. Okabe M., Tsukahara Y., Tanaka M., Suzuki K., Saito S., Kamiya Y., Tsujimura T., Nakamura K., and Miyajima A. (2009) Potential hepatic stem cells reside in EpCAM+ cells of normal and injured mouse liver. Development. 136, 1951–1960 [DOI] [PubMed] [Google Scholar]
- 24. Miura K., Yang L., van Rooijen N., Brenner D. A., Ohnishi H., and Seki E. (2013) Toll-like receptor 2 and palmitic acid cooperatively contribute to the development of non-alcoholic steatohepatitis through inflammasome activation in mice. Hepatology 57, 577–589 [DOI] [PMC free article] [PubMed] [Google Scholar]
- 25. Tacke F., and Zimmermann H. W. (2014) Macrophage heterogeneity in liver injury and fibrosis. J. Hepatol. 60, 1090–1096 [DOI] [PubMed] [Google Scholar]
- 26. Romics L. Jr., Dolganiuc A., Kodys K., Drechsler Y., Oak S., Velayudham A., Mandrekar P., and Szabo G. (2004) Selective priming to Toll-like receptor 4 (TLR4), not TLR2, ligands by P. acnes involves up-regulation of MD-2 in mice. Hepatology 40, 555–564 [DOI] [PubMed] [Google Scholar]
- 27. Kudo H., Takahara T., Yata Y., Kawai K., Zhang W., and Sugiyama T. (2009) Lipopolysaccharide triggered TNF-α-induced hepatocyte apoptosis in a murine non-alcoholic steatohepatitis model. J. Hepatol. 51, 168–175 [DOI] [PubMed] [Google Scholar]
- 28. Sell S., and Leffert H. L. (2008) Liver cancer stem cells. J. Clin. Oncol. 26, 2800–2805 [DOI] [PMC free article] [PubMed] [Google Scholar]
- 29. Galicia V. A., He L., Dang H., Kanel G., Vendryes C., French B. A., Zeng N., Bayan J.-A., Ding W., Wang K. S., French S., Birnbaum M. J., Rountree C. B., and Stiles B. L. (2010) Expansion of hepatic tumor progenitor cells in Pten-null mice requires liver injury and is reversed by loss of AKT2. Gastroenterology 139, 2170–2182 [DOI] [PMC free article] [PubMed] [Google Scholar]
- 30. Rountree C. B., Ding W., He L., and Stiles B. (2009) Expansion of CD133-expressing liver cancer stem cells in liver-specific phosphatase and tensin homolog deleted on chromosome 10-deleted mice. Stem Cells 27, 290–299 [DOI] [PMC free article] [PubMed] [Google Scholar]
- 31. He G., Dhar D., Nakagawa H., Font-Burgada J., Ogata H., Jiang Y., Shalapour S., Seki E., Yost S. E., Jepsen K., Frazer K. A., Harismendy O., Hatziapostolou M., Iliopoulos D., Suetsugu A., et al. (2013) Identification of liver cancer progenitors whose malignant progression depends on autocrine IL-6 signaling. Cell 155, 384–396 [DOI] [PMC free article] [PubMed] [Google Scholar]
- 32. Yamashita T., Honda M., Nakamoto Y., Baba M., Nio K., Hara Y., Zeng S. S., Hayashi T., Kondo M., Takatori H., Yamashita T., Mizukoshi E., Ikeda H., Zen Y., Takamura H., et al. (2013) Discrete nature of EpCAM+ and CD90+ cancer stem cells in human hepatocellular carcinoma. Hepatology 57, 1484–1497 [DOI] [PMC free article] [PubMed] [Google Scholar]
- 33. Himes R. W., and Smith C. W. (2010) Tlr2 is critical for diet-induced metabolic syndrome in a murine model. FASEB J. 24, 731–739 [DOI] [PMC free article] [PubMed] [Google Scholar]
- 34. Rivera C. A., Gaskin L., Allman M., Pang J., Brady K., Adegboyega P., and Pruitt K. (2010) Toll-like receptor-2 deficiency enhances non-alcoholic steatohepatitis. BMC Gastroenterol. 10, 52. [DOI] [PMC free article] [PubMed] [Google Scholar]
- 35. Paik Y.-H., Lee K. S., Lee H. J., Yang K. M., Lee S. J., Lee D. K., Han K.-H., Chon C. Y., Lee S. I., Moon Y. M., and Brenner D. A. (2006) Hepatic stellate cells primed with cytokines upregulate inflammation in response to peptidoglycan or lipoteichoic acid. Lab. Invest. 86, 676–686 [DOI] [PubMed] [Google Scholar]
- 36. Baeck C., Wehr A., Karlmark K. R., Heymann F., Vucur M., Gassler N., Huss S., Klussmann S., Eulberg D., Luedde T., Trautwein C., and Tacke F. (2012) Pharmacological inhibition of the chemokine CCL2 (MCP-1) diminishes liver macrophage infiltration and steatohepatitis in chronic hepatic injury. Gut 61, 416–426 [DOI] [PubMed] [Google Scholar]
- 37. Tosello-Trampont A.-C., Landes S. G., Nguyen V., Novobrantseva T. I., and Hahn Y. S. (2012) Kuppfer cells trigger non-alcoholic steatohepatitis development in diet-induced mouse model through tumor necrosis factor-production. J. Biol. Chem. 287, 40161–40172 [DOI] [PMC free article] [PubMed] [Google Scholar]
- 38. Miura K., Yang L., van Rooijen N., Ohnishi H., and Seki E. (2012) Hepatic recruitment of macrophages promotes non-alcoholic steatohepatitis through CCR2. Am. J. Physiol. Gastrointest. Liver Physiol. 302, G1310–G1321 [DOI] [PMC free article] [PubMed] [Google Scholar]
- 39. Maeda S., Kamata H., Luo J.-L., Leffert H., and Karin M. (2005) IKKβ couples hepatocyte death to cytokine-driven compensatory proliferation that promotes chemical hepatocarcinogenesis. Cell 121, 977–990 [DOI] [PubMed] [Google Scholar]
- 40. Park E. J., Lee J. H., Yu G.-Y., He G., Ali S. R., Holzer R. G., Osterreicher C. H., Takahashi H., and Karin M. (2010) Dietary and genetic obesity promote liver inflammation and tumorigenesis by enhancing IL-6 and TNF expression. Cell 140, 197–208 [DOI] [PMC free article] [PubMed] [Google Scholar]
- 41. Kirillova I., Chaisson M., and Fausto N. (1999) Tumor necrosis factor induces DNA replication in hepatic cells through nuclear factor κB activation. Cell Growth Differ. 10, 819–828 [PubMed] [Google Scholar]
- 42. Matthews V. B., Klinken E., and Yeoh G. C. (2004) Direct effects of interleukin-6 on liver progenitor oval cells in culture. Wound Repair Regen. 12, 650–656 [DOI] [PubMed] [Google Scholar]
- 43. Naugler W. E., Sakurai T., Kim S., Maeda S., Kim K., Elsharkawy A. M., and Karin M. (2007) Gender disparity in liver cancer due to sex differences in MyD88-dependent IL-6 production. Science 317, 121–124 [DOI] [PubMed] [Google Scholar]
- 44. Hernandez-Gea V., Toffanin S., Friedman S. L., and Llovet J. M. (2013) Role of the microenvironment in the pathogenesis and treatment of hepatocellular carcinoma. Gastroenterology 144, 512–527 [DOI] [PMC free article] [PubMed] [Google Scholar]


