

Abstract
Background and Purpose
Hypoxic activation of hypoxia‐inducible factor 1α (HIF‐1α) and fibrosis in adipose tissue contribute to adipose dysfunction. This study was designed to investigate the effects of metformin and resveratrol on the regulation of HIF‐1α and fibrosis in hypoxic adipose tissue.
Experimental Approach
Mice were fed a high‐fat diet to induce hypoxia and fibrosis in adipose tissue; adipose tissue incubated in vitro in 1% O2 showed a similar change. The effects of metformin and resveratrol on hypoxia, HIF‐1α accumulation, endoplasmic reticulum stress and gene expressions of extracellular matrix components and pro‐inflammatory cytokines were examined.
Key Results
Oral administration of metformin or resveratrol prevented hypoxia and reduced HIF‐1α accumulation with dephosphorylation of inositol‐requiring enzyme 1α and eukaryotic initiation factor 2α, indicative of suppression of hypoxic HIF‐1α activation and endoplasmic reticulum stress. Metformin and resveratrol down‐regulated gene expressions of Col3α, Col6α, elastin and lysyl oxidase and thereby reduced collagen deposition in adipose tissue. The increased gene expressions of TNF‐α, IL‐6, monocyte chemoattractant protein 1 and F4/80 were also down‐regulated by metformin and resveratrol. Metformin and resveratrol had similar effects in adipose tissue exposed to 1% O2. Metformin reduced ATP production and prevented the reduction in oxygen tension in 3T3‐L1 cells, suggesting that it prevented hypoxia by limiting oxygen consumption, whereas resveratrol reduced HIF‐1α accumulation by promoting its proteasomal degradation via the regulation of AMPK/SIRT1.
Conclusion and Implications
Hypoxia and fibrosis are early causes of adipose dysfunction in obesity. Both metformin and resveratrol effectively inhibited HIF‐1α activation‐induced fibrosis and inflammation in adipose tissue, although by different mechanisms.
Abbreviations
- AMPK
AMP‐activated kinase
- ECM
extracellular matrix
- eIF‐2α
eukaryotic initiation factor 2α
- ER stress
endoplasmic reticulum stress
- FCCP
Carbonyl cyanide 4‐(trifluoromethoxy)phenylhydrazone
- FFA
free fatty acid
- FITC
Fluorescein Isothiocyanate
- HFD
high‐fat diet
- HIF‐1α
hypoxia‐inducible factor 1α
- HPRT
hypoxanthine phosphoribosyltransferase
- IRE‐1α
inositol‐requiring enzyme 1α
- LOX
lysyl oxidase
- MCP‐1
monocyte chemoattractant protein 1 (also known as CCL2)
- TC
total cholesterol
- TUDCA
tauroursodeoxycholic acid
- SIRT1
Sirtuin 1
- ZMP
5‐aminoimidazole‐4‐carboxamide‐1β‐D‐ribofuranosyl‐5‐monophate
Tables of Links
| TARGETS | |
|---|---|
| GPCRs a | Enzymes b |
| F4/80 (ADGRE1) | AMPK |
| HIF‐1α | |
| Lysyl oxidase (LOX) | |
| Sirtuin 1 (SIRT1) |
| LIGANDS | |
|---|---|
| ATP | Metformin |
| Compound C | MCP‐1 (CCL2) |
| Dexamethasone | MG‐132 |
| Digoxin | Palmitate |
| IBMX | Resveratrol |
| IL‐6 | Tauroursodeoxycholic acid |
| Insulin | TNF‐α |
These Tables list key protein targets and ligands in this article which are hyperlinked to corresponding entries in http://www.guidetopharmacology.org, the common portal for data from the IUPHAR/BPS Guide to PHARMACOLOGY (Pawson et al., 2014) and are permanently archived in the Concise Guide to PHARMACOLOGY 2015/16 (a,bAlexander et al., 2015a, 2015b).
Introduction
It is generally accepted that obesity is a chronic and low‐grade inflammatory state responsible for insulin resistance, diabetes and cardiovascular diseases (Lee et al., 2009). The rational association of adipose inflammation with metabolic disorders has been extensively investigated in the past decade, with adipose hypoxia emerging as a causative factor for adipose dysfunction in obesity (Trayhurn, 2013). A key step in the progression from a lean to obese state is an increase in fat. When the increased adipocyte size reaches the diffusional limit of oxygen from the vessel, the low oxygen tension in adipose tissue induces hypoxia‐inducible factor 1α (HIF‐1α) accumulation. As a transcription factor, HIF‐1α regulates the molecular response to hypoxia, and there is accumulating evidence demonstrating the pathological impact of hypoxia on adipose function and obesity‐related metabolic disorders (Semenza, 2012; Trayhurn, 2013). Recently, Yun Sok Lee and colleagues found that feeding a high‐fat diet (HFD) for a short time and saturated fatty acid induce adipose hypoxia by increasing O2 consumption in adipocytes, leading to inflammation and insulin resistance (Lee et al., 2014). This finding demonstrates that lipid load induces hypoxia in adipose tissue, while the morphology of adipocytes remains normal, and thereby provides a new insight into the impact of lipotoxicity on cell oxygen homeostasis.
The HIF‐1α‐mediated transcriptional programme in adipocytes is a critical component of the ‘fibrotic response’, directly linked to metabolic dysfunction in adipose tissues under hypoxic conditions (Sun et al., 2013a). In addition to promoting neovasculature and anaerobic metabolism, HIF‐1α regulates gene expressions by encoding proteins involved in extracellular matrix (ECM) remodelling and inflammation. In addition to providing a support surrounding adipocytes, ECM proteins respond to different cell signalling events (Halberg et al., 2009). Adipose tissue regulates metabolism while functioning as a storage site for lipids. Adipocyte size increases because of the intracellular accumulation of lipid droplets. Adipocytes are surrounded by a network of ECM, and the flexibility of ECM allows adipose tissue to expand in an ordered manner. In response to hypoxia, HIF‐1α activation induces an alternative transcriptional programme, mainly entailing enhanced synthesis of ECM protein, and then initiates adipose tissue fibrosis (Khan et al., 2009). The increased interstitial fibrosis in adipose tissue decreases ECM flexibility and reduces tissue plasticity, thereby preventing the safe expansion of adipose tissue, which results in cell injury and death (Halberg et al., 2009; Sun et al., 2013b). As a consequence, monocytes and macrophages are recruited into the adipose tissue to remove the injured and dead adipocytes, whereas the increased and sustained infiltration of macrophages can trigger inflammation in local adipose tissue, leading to adipose dysfunction (Halberg et al., 2009). In this context, hypoxia‐induced adipose fibrosis is considered to be an early event responsible for the initiation of inflammation in adipose tissue. HIF‐1α activation in adipose tissue develops into insulin resistance with dietary obesity (Krishnan et al., 2012); deletion of HIF‐1α protects mice from HFD‐induced insulin resistance with reduced fat formation (Jiang et al., 2011), indicative of the critical role of HIF‐1α in the development of insulin resistance. Selective inhibition of HIF‐1α suppresses fibrosis and reduces local inflammation in adipose tissue and ameliorates insulin resistance in mice fed a high‐fat diet, further demonstrating the contribution of adipose fibrosis and inflammation to insulin resistance (Sun et al., 2013a). These events raise the possibility that suppression of adipose fibrosis can prevent inflammation‐associated insulin resistance.
Metformin is currently the first‐line drug treatment for type 2 diabetes, and its insulin‐enhancing action contributes to its therapeutic effects. Although the efficiency of metformin at preventing cardiac and renal fibrosis has been documented (Xiao et al., 2010; Bai et al., 2013; Kim et al., 2015), its effectiveness with regard to fibrosis in non‐alcoholic fatty liver remains to be confirmed (Ozturk and Kadayifci, 2014). Resveratrol is a polyphenol most commonly found in red grapes, red wine and tea. Similar to metformin, resveratrol exerts an anti‐diabetic action with beneficial effects on insulin sensitivity (Lagouge et al., 2006; Brasnyó et al., 2011), and its anti‐fibrosis effects in liver, heart and kidney have been intensively investigated (Di Pascoli et al., 2013; Bai et al., 2014; Chen et al., 2015). But up to now, little is known about its effect on adipose fibrosis, especially in the setting of hypoxia. Therefore, we wanted to know whether and how metformin and resveratrol regulate hypoxic responses in adipose tissue with an emphasis on fibrosis, with the aim of finding their potential mechanism of action involved in the prevention of adipose dysfunction under hypoxic conditions. Our findings show that although the mechanisms by which metformin and resveratrol are able to suppress HIF‐1α activation are different, they are equally effective at preventing fibrosis and inhibiting inflammation in hypoxic adipose tissue.
Methods
Animals
ICR male mice (6–8 weeks of age) were obtained from Nanjing Qinglongshan Experiment Animal Centre and housed in cages with 12 h dark–light cycles under a constant temperature (22 ± 2°C) and given unlimited access to water. All studies involving animals are in accordance with the ARRIVE guidelines for reporting experiments involving animals (Kilkenny et al., 2010; McGrath and Lilley, 2015). The treatment and care of these mice were approved by the Animal Ethics Committee of School of Chinese Materia Medica, China Pharmaceutical University. The mice were divided into appropriate experimental groups by complete randomization. In ex vivo experiments, mice were killed by cervical dislocation and intact epididymal adipose tissue was removed. Adipose tissue fragments were incubated for 24 h in DMEM containing glucose (25 mM), supplemented with 100 U·mL−1 penicillin G and 100 μg·mL−1 streptomycin, at 37°C in a humidified atmosphere of 21% O2 or in a hypoxic atmosphere of 1% O2.
HFD feeding of mice
Mice were fed with a diet containing 10% lard, 10% yolk, 1% cholesterol, 0.2% cholate and 78.8% standard diet and given metformin (200 mg·kg−1), resveratrol (50 mg·kg−1) or TUDCA (50 mg·kg−1) by gavage every day for 7 days. Mice were anaesthetized via an i.p. injection of sodium pentobarbital (50 mg·kg−1) after being fasted for 8–10 h and were exsanguinated via retro‐orbital venous puncture under general anaesthesia. The mice were killed immediately afterwards via cervical dislocation. Serum was collected by centrifugation at 1 800× g for 15 min and was stored at −80°C for further analysis. Serum glucose (Nanjing Jiancheng Bioengineering Institute, Nanjing, China), triglycerides (Beijing BHKT Clinical Reagent Co., Ltd., Beijing, China), total cholesterol (TC) (Beijing BHKT Clinical Reagent Co., Ltd) and nonesterified fatty acid (Nanjing Jiancheng Bioengineering Institute) were assayed according to the manufacturers’ instructions of the kits used.
Cell culture and differentiation
3T3‐L1 cells (a pre‐adipocyte cell line from the cell bank of the Chinese Academy of Sciences, Shanghai, China) were cultured in DMEM supplemented with 10% (v v‐1) FBS, 100 μg·mL−1 streptomycin and 100 U·mL−1 penicillin at 37°C in a 5% CO2 atmosphere. Postconfluent cells were differentiated by incubation in DMEM in the presence of 0.5 mM IBMX, 1 mM dexamethasone and 10 μg mL insulin for 2 days. Then cells were incubated for 2 days in DMEM containing insulin alone. After 8–12 days, over 80% of the cells exhibited the mature adipocyte phenotype.
Measurement of cellular ATP
Differentiated 3T3‐L1 cells were incubated with metformin (1 mM) or resveratrol (10 μM) under normoxia for 4 h. ATP was assayed by using an ATP Assay Kit (Beyotime Institute of Biotechnology).
Histology examination using pimonidazole and Masson's staining
For the assessment of hypoxic regions, mice (n = 5), fed for 7 days, from each group were injected with 60 mg·kg−1 pimonidazole (Hypoxyprobe‐1 plus kit; Hypoxyprobe, Inc., Burlington, VT, USA) 30 min before being killed. Epididymal adipose tissues were removed, processed and fixed in a 4% paraformaldehyde/PBS buffer, FITC‐conjugated antibodies against pimonidazole adducts, which is distributed to all tissues that have an oxygen concentration less than 14 μM at 37°C (according to the manufacturer's instructions). For Masson's staining in adipose tissue, the fixed adipose tissue was stained with Masson's trichrome according to standard protocols. For the pimonidazole adduct formation assay in differentiated adipocytes, pimonidazole was added to the 3T3‐L1 cells; it binds to cells with pO2 levels <10 mmHg. The cells were exposed to normoxia or hypoxia (1% O2) for 4 h in the presence of metformin (1 mM), resveratrol (10 μM) or AICAR (500 μM). The image was visualized using the OLYMPUS microscopy set at a 400× magnification or Nikon ECLIPSE Ti‐S microscopy (Tokyo, Japan) at a 200× magnification.
Western blot analysis
Epididymal adipose tissues, from mice (n = 5) of each group, or adipocytes were lysed in ice‐cold RIPA buffer with Tissue Lyser for 5 min, incubated in an ice bath for 45 min and then cleared by centrifugation at 12 000× g for 20 min at 4°C. Equal amounts of protein were electrophoresed on SDS‐PAGE, transferred to a PVDF membrane and then blocked at room temperature for 2 h. For immunoblotting, the primary antibodies were applied, respectively, at 4°C overnight, followed by incubation with the secondary antibody at room temperature for 2 h or at 4°C overnight. An enhanced ECL kit was used to detect signals and Image‐Pro Plus 6.0 software to analyse the blots quantitatively by densitometry.
RNA preparation, cDNA synthesis
Total RNAs were extracted from epididymal adipose tissues of the mice (n = 5) from each group or cells in Trizol reagent (SunShineBio, Nanjing, China) and then isolated by following the protocol from the manufacturer. The purity and integrity of the RNA were calculated by absorbance at 260/280 nm. cDNA synthesis was prepared by using the TransScript First‐Strand cDNA Synthesis SuperMix (TransGen Biotech, Beijing, China) and stored at −70°C prior to further analysis. Primer sequences are shown in Supporting Information Table S1.
Quantitative real‐time PCR
The relative gene expression was quantified by quantitative PCR (Q‐PCR) using the SYBR Green I PCR kit (Bio‐Rad, Hercules, CA, USA) and the CFX96TM real‐time system (Bio‐Rad). The primer sequences used for Q‐PCR are presented in Supporting Information Table S1. For all quantitative RT‐PCR experiments, the results were calculated using the threshold cycle method, using HPRT or β‐actin for normalization, and the relative gene expression was calculated with the 2−∆∆Ct method.
The siRNA‐mediated gene silencing
To specifically restrain and silent AMP‐activated kinase (AMPK) gene expression, 3T3‐L1 cells were stably transfected with siRNA. According to the manufacturer's instructions, 70–80% confluent cells in six‐well plates were transfected with non‐specific control siRNA (sc‐37007) or siRNAs against mouse AMPKA1/2 (also known as AMPKα1/2) (sc‐45313) with siRNA transfection reagent (sc‐29528) (Santa Cruz Biotechnology, Inc., Santa Cruz, CA, USA). After 7 h of transfection, cells were cultured in a medium for 18–24 h, and the mRNA specific for the siRNA transfection by Q‐PCR was examined or replaced with fresh medium for an additional 24 h. Then cells were treated with metformin (1 mM) or resveratrol (10 μM) under normoxia (21% O2) or hypoxia (1% O2) for 24 h, and the protein expression was analysed by western blot.
Cellular oxygen consumption measurements
Oxygen consumption rates (OCRs) were measured using the XFe96 Extracellular Flux Analyzer (Seahorse Bioscience, North Billerica, MA, USA). 3T3‐L1 cells were seeded (10 000 cells per well) and incubated overnight in DMEM supplemented with 10% (v v‐1) FBS. One hour before the measurement, cells were incubated with XF medium at 37°C in a CO2‐free incubator. The OCRs were detected under basal conditions and after the application of 1 μM oligomycin, 0.5 μM FCCP and 0.5 μM rotenone + 0.5 μM antimycin A (XF Cell Mito Stress Test Kit; Seahorse Bioscience). Each sample was analysed five times.
Statistical analysis
The data were first evaluated for normal distribution using the Kolmogorov–Smirnov test. The results of normally distributed data are expressed as the means ± SD. For normally distributed data with equivalent group variances, one‐way ANOVA followed by the Bonferroni test was used. Post hoc tests were performed only if P < 0.05 and there was no significant inhomogeneity of variance. A value of P < 0.05 was considered statistically significant. Data analysis was conducted in a blinded manner (single‐blind study design). The data and statistical analysis comply with the recommendations on experimental design and analysis in pharmacology (Curtis et al., 2015).
Materials
Metformin (purity ≥97%) was obtained from Sino‐American Shanghai Squibb Pharma (Shanghai, China). Resveratrol (purity ≥98%) was provided by Nanjing Zelang Medical Technology Co., LTD (Nanjing, China). Tauroursodeoxycholic acid (TUDCA) and compound C were from Sigma (St. Louis, MO, USA). Digoxin (purity ≥98%) was offered from NRCCRM (Beijing, China). PX‐478 (L‐phenylalanine, 4‐[bis(2‐chloroethyl)oxidoamino]‐, dihydrochloride) (purity ≥97%) was purchased from Taizhou Rico Biological Technology Co., LTD (Taizhou, China). AICA riboside (AICAR) was obtained from Beyotime Institute of Biotechnology (Shanghai, China). These agents were dissolved in DMSO and diluted with buffered saline to the desired concentration. It is noteworthy that the final concentration of DMSO was <0.1% v v‐1. Palmitate (PA) (Sinopharm Chemical Rwagent Co., Ltd. Shanghai, China) was dissolved in anhydrous ethanol and diluted with 10% of BSA at the ratio of 1:19 to 10 mM before use.
Results
Oral administration of metformin and resveratrol prevented adipose hypoxia
Feeding mice a HFD induced hypoxia in adipose tissue, as demonstrated by staining of hypoxia adducts with pimonidazole (Figure 1A). Meanwhile, gene and protein expressions of HIF‐1α expression were also markedly increased by 7 days of HFD feeding (Figure 1B, C). Treating mice with metformin and resveratrol attenuated pimonidazole staining in adipose tissue. Resveratrol attenuated the gene and protein expressions of HIF‐1α, while metformin reduced the accumulation of HIF‐1α, but had no significant effect on HIF‐1α gene expression. These results show that metformin and resveratrol prevented hypoxia‐induced increase in HIF‐1α in adipose tissue. The endoplasmic reticulum stress (ER stress) inhibitor TUDCA exhibited a similar effect to that of metformin and resveratrol.
Figure 1.

Oral administration of metformin (Met) and resveratrol (Res) prevented hypoxic HIF‐1α induction in adipose tissue. Mice were fed a HFD for 7 days and simultaneously administered Met, Res or TUDCA by oral gavage. (A) Hypoxia staining in epididymal adipose tissue was viewed by using the hypoxia probe pimonidazole (200× magnification); (B) mRNA expression of HIF‐1α in epididymal adipose tissue was measured by Q‐PCR; (C) HIF‐1α protein expression in epididymal adipose tissues was determined by western blot. Data are expressed as mean ± SD of five mice per group. *P < 0.05 versus HFD feeding‐only treatment; # P < 0.05 versus the indicated treatment. NCD, normalchow diet.
Meanwhile, HFD feeding increased the blood contencentrations of free fatty acids (FFA) and TC, while blood glucose, insulin and triglyceride remained at basal levels in comparison with the mice fed a normal diet. Oral administration of metformin and resveratrol down‐regulated the elevated level of FFA without affecting other biochemical parameters in the blood. TUDCA administration also reduced the increased FFA content in the blood. No significant body weight gain was observed in mice subjected to metformin or resveratrol administration (Supporting Information Fig. S1).
Metformin and resveratrol suppressed ER stress in adipose tissue
Short‐term HFD feeding induced ER stress in adipose tissue, as indicated by enhanced inositol‐requiring enzyme 1α (IRE‐1α) and eukaryotic initiation factor 2α (eIF‐2α) phosphorylations. As shown in Figure 2A, B, metformin and resveratrol administration suppressed ER stress by dephosphorylation of IRE‐1α and eIF‐2α. As a positive control, TUDCA normalized IRE‐1α and eIF‐2α phosphorylation in adipose tissue.
Figure 2.

Metformin (Met) and resveratrol (Res) suppressed ER stress in adipose tissue. Mice were fed a HFD for 7 days and simultaneously administered Met, Res or TUDCA by oral gavage. The phosphorylations of IRE‐1α (A) and eIF‐2α (B) in epididymal adipose tissues were assessed by western blot. Data are expressed as mean ± SD of five mice per group. *P < 0.05 versus HFD feeding‐only treatment; # P < 0.05 versus the indicated treatment.
Metformin and resveratrol inhibited adipose fibrosis and inflammation in HFD‐fed mice
As a transcription factor, HIF‐1α induction leads to an alternative transcriptional programme, including increased gene expressions for ECM components. In adipose tissue from HFD‐fed mice, the gene expressions of structural proteins, including Col3α, Col6α and elastin, increased. Lysyl oxidase (LOX) catalyses the cross‐linking of elastin and collagen, and its gene expression was also increased. Despite no significant change occurring in adipocyte size, we found increased positive Masson's staining surrounding adipocytes, indicating the accumulation of collagen in adipose tissue. As shown in Figure 3A, B, metformin and resveratrol down‐regulated the gene expressions of Col3α, Col6α, elastin and LOX and thereby attenuated collagen deposition.
Figure 3.

Metformin (Met) and resveratrol (Res) inhibited adipose fibrosis and inflammation in HFD‐fed mice. Mice were fed a HFD for 7 days and simultaneously administered Met, Res or TUDCA by oral gavage. (A) mRNA expressions of Col3α, Col6α, elastin and LOX in epididymal adipose tissue were determined by Q‐PCR; (B) Masson's trichrome staining in adipose tissue (left). Bar, 50 μM. Adipocyte size indicated by average diameter (right); (C) mRNA expressions of IL‐6, TNF‐α, monocyte chemoattractant protein 1 (MCP‐1) and F4/80 in epididymal adipose tissue were determined by Q‐PCR. Data are expressed as mean ± SD of five mice per group. *P < 0.05 versus HFD feeding‐only treatment; # P < 0.05 versus the indicated treatment. NCD, normalchow diet.
Inflammation also accompanied the fibrosis occurring in adipose tissue. As shown in Figure 3C, oral administration of metformin and resveratrol significantly reduced mRNA expressions of TNF‐α, IL‐6 and monocyte chemoattractant protein 1, demonstrating their anti‐inflammatory activity in adipose tissue. F4/80 expression is an indicator of the recruitment of macrophages induced by dead adipocytes, and its increased expression in adipose tissue was also down‐regulated by oral administration of metformin and resveratrol. TUDCA administration inhibited inflammatory gene expressions, suggesting the involvement of ER stress in adipose inflammation.
Metformin and resveratrol inhibited palmitate (PA)‐induced HIF‐1α and LOX expression in adipose tissue
To determine whether HFD‐induced fibrosis is involved in the changes in HIF‐1α, we stimulated adipose tissue from normal mice with PA and found that the HIF‐1α inhibitor PX‐478 inhibited the gene and protein expressions of HIF‐1α and down‐regulated the expression of LOX (Figure 4A, B). These results support the hypothesis that lipid challenge is responsible for hypoxia‐induced fibrosis in adipose tissue. Similar to their effects in HFD‐fed mice, metformin and resveratrol as well as TUDCA inhibited PA‐induced HIF‐1α and LOX expression (Figure 4A, B).
Figure 4.

Metformin (Met) and resveratrol (Res) inhibited palmitate (PA)‐induced HIF‐1α and LOX expression in adipose tissue. Adipose tissues from normal mice were pretreated with Met, Res, TUDCA or PX‐478 at given concentrations and then incubated with PA for 24 h. (A) mRNA expressions of HIF‐1α and LOX in adipose tissue were measured by Q‐PCR, and (B) HIF‐1α protein expression was assessed by western blot. Data are expressed as mean ± SD of five mice per group. *P < 0.05 versus PA‐only treatment; # P < 0.05 versus the indicated treatment.
Metformin and resveratrol inhibited HIF‐1α expression and suppressed ER stress in adipose tissue exposed to hypoxia
Metformin and resveratrol inhibited the induction of HIF‐1α and fibrosis in adipose tissue of HFD‐fed mice. To further confirm that these effects are involved in their prevention of hypoxia, we investigated the effects of metformin and resveratrol in adipose tissue exposed to hypoxia. Incubation of adipose under hypoxic conditions (1% O2) resulted in the accumulation of HIF‐1α protein in adipose tissue, and this effect was reversed by pretreatment with metformin and resveratrol (Figure 5A). Meanwhile, we also observed ER stress in adipose tissue, as indicated by increased IRE‐1α and eIF‐2α phosphorylation in response to hypoxia. Metformin and resveratrol effectively reduced IRE‐1α and eIF‐2α phosphorylation, indicative of the suppression of ER stress in hypoxia (Figure 5B, C). As hypoxia is associated with ER stress, we wondered whether ER stress contributed to the induction of HIF‐1α; we found that the ER stress inhibitor TUDCA inhibited HIF‐1α expression, while the HIF‐1α inhibitor digoxin failed to suppress hypoxia‐induced IRE‐1α and eIF‐2α phosphorylation (Figure 5D, E). These results suggest that ER stress contributes to the induction of HIF‐1α under hypoxic conditions.
Figure 5.
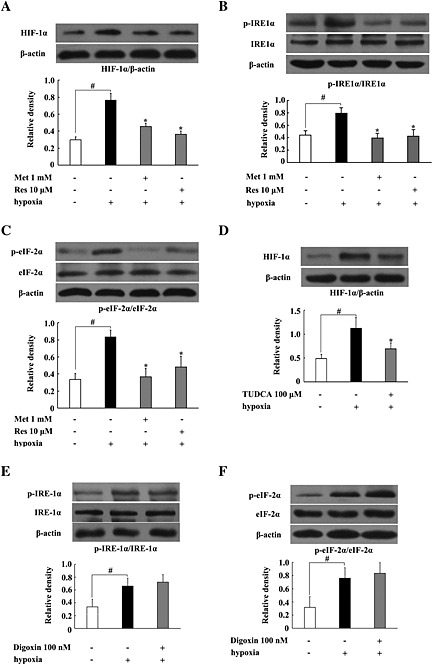
Metformin (Met) and resveratrol (Res) inhibited HIF‐1α expression and ER stress in adipose tissue exposed to hypoxia. (A–E) Epididymal adipose tissue from normal mice was pretreated with the indicated agents at given concentrations and then cultured under hypoxic conditions (1% O2) for 24 h. The HIF‐1α protein expression and the phosphorylation of IRE‐1α and eIF‐2α were detected by western blot. Data are expressed as mean ± SD of five mice per group. *P < 0.05 versus hypoxia‐only treatment; # P < 0.05 versus the indicated treatment.
Metformin and resveratrol inhibited fibrosis and inflammation in hypoxic adipose tissue
We next investigated the effects of metformin and resveratrol on fibrosis and inflammation in hypoxic adipose tissue. As shown in Figure 6A, upon hypoxic challenge, genes for ECM components, including Col3α, Col6α, elastin and LOX, increased, but these alterations were prevented by pretreatment with metformin and resveratrol.
Figure 6.

Metformin (Met) and resveratrol (Res) inhibited fibrosis and inflammation in hypoxic adipose tissue. Epididymal adipose tissue from normal mice was pretreated with Met or Res at the given concentrations and then cultured under hypoxic conditions (1% O2) for 24 h. (A) mRNA expressions of Col3α, Col6α, elastin and LOX were determined by Q‐PCR; (B) western blot was used to detect the phosphorylation of p65 protein; (C) mRNA expressions of TNF‐α and IL‐6 were measured by Q‐PCR. Data are expressed as mean ± SD of five mice per group. *P < 0.05 versus hypoxia‐only treatment; # P < 0.05 versus the indicated treatment.
Moreover, we observed that metformin and resveratrol suppressed NF‐κB activation by inhibiting hypoxia‐induced p65 phosphorylation (Figure 6B). Q‐PCR examination also showed that metformin as well as resveratrol reduced gene expressions for pro‐inflammatory cytokines TNF‐α and IL‐6 (Figure 6C). Consistent with their effects in HFD‐fed mice, these results indicate that metformin and resveratrol inhibit fibrosis and then suppress inflammation in hypoxic adipose tissue.
Metformin and resveratrol regulated HIF‐1α expression with or without the involvement of AMPK
As both metformin and resveratrol are potent AMPK activators, we wanted to know the possible involvement of AMPK activation in their effects. Exposure of adipose tissue of normal mice to hypoxia induced AMPK phosphorylation, and the increased AMPK phosphorylation was further enhanced by treatment with metformin and resveratrol (Figure 7A). HFD feeding attenuated AMPK phosphorylation in adipose tissue, whereas oral administration of metformin and resveratrol effectively restored the loss of AMPK phosphorylation (Figure 7B). These results demonstrate the positive role of metformin and resveratrol in the regulation of AMPK activity. We further investigated their effects in adipocytes transfected with AMPKA1/2‐specific siRNA to silence AMPK and observed that knockdown of AMPK blocked the inhibitory effect of resveratrol on hypoxia‐induced HIF‐1α expression, while the action of metformin remained unchanged (Figure 7C). The Q‐PCR assay also showed that ‘silencing’ of AMPK blocked the inhibitory effect of resveratrol, but not that of metformin, on gene expressions of HIF‐1α and LOX in stressed cells (Figure 7D). These results indicate that resveratrol and metformin affect hypoxia‐induced induction of HIF‐1α in different ways, AMPK‐dependent or ‐independent.
Figure 7.

Effects of metformin (Met) and resveratrol (Res) on AMPK. (A) Epididymal adipose tissue from normal mice was pretreated with Met and Res and then exposed to 1% O2 for 24 h; (B) mice were simultaneously fed a HFD for 7 days and administered Met or Res by oral gavage. Western blot was used to detect the phosphorylation of AMPK. (C, D) 3T3‐L1 cells were transfected with AMPKA1/2 (AMPKα1/2)‐specific siRNA to silence AMPK and then incubated with Met and Res under 1% O2 for 24 h. HIF‐1α protein expression was determined by western blot (C), and mRNA expressions of HIF‐1α and LOX were measured by Q‐PCR (D). Data are expressed as mean ± SD of five mice per group or n = 5 in quintuplicate for the cell line experiment. *P < 0.05 versus hypoxia or HFD feeding‐only treatment; # P < 0.05 versus the indicated treatment. NCD, normalchow diet.
Effects of metformin and resveratrol on ATP production in adipocytes
To explore the potential mechanism through which metformin and resveratrol affected HIF‐1α accumulation, we observed their effects on intracellular ATP production and oxygen tension in adipocytes. As shown in Figure 8A, incubation of adipocytes with metformin reduced ATP production, whereas the ATP production was unaffected by resveratrol treatment. Pimonidazole staining showed that metformin, but not resveratrol, effectively prevented the reduction in oxygen tension in adipocytes under the hypoxic conditions (Figure 8B). the AMPK activator AICAR failed to influence the lower oxygen tension in adipocytes exposed to 1% O2. Interestingly, metformin and resveratrol as well as AICAR effectively attenuated the reduction in oxygen tension in adipocytes evoked by PA stimulation (Figure 8C). PA stimulation enhanced OCR in adipocytes, but the increased OCR was reduced by metformin and resveratrol (Figure 8D), suggesting that metformin and resveratrol reduce oxygen consumption in adipocytes.
Figure 8.

Effects of metformin (Met) and resveratrol (Res) on ATP production and hypoxia in adipocytes. (A) 3T3‐L1 cells were incubated with Met or Res under normoxia for 4 h. ATP was assayed by an ATP Assay Kit; (B, C) 3T3‐L1 cells were exposed to hypoxia (1% O2) (B) or palmitate (PA) (C) in the presence of Met, Res or AICAR, and hypoxia staining was viewed with the hypoxia probe pimonidazole at a 200× magnification; (D) OCR was measured in 3T3‐L1 cells under basal conditions and after exposure to PA in the presence of Met and Res using an XFe96 Extracellular Flux Analyzer. Data are expressed as mean ± SD (n = 5 in quintuplicate) for cell line experiment. # P < 0.05 versus the indicated treatment. FCCP, Carbonyl cyanide 4‐(trifluoromethoxy)phenylhydrazone.
Resveratrol inhibited HIF‐1α expression by an effect on SIRT1
Resveratrol is able to activate SIRT1 (Lagouge et al., 2006), and therefore, we investigated the possible involvement of this action in the effect of resveratrol on HIF‐1α. Hypoxia attenuated SIRT1 expression in adipose tissue, whereas resveratrol, but not metformin, increased SIRT1 expression in response to a hypoxic insult (Figure 9A). Moreover, the AMPK inhibitor compound C blocked the enhancing action of resveratrol on SIRT1 expression, implying the role of AMPK in SIRT1 activation (Figure 9B). The SIRT1 inhibitor nicotinamide and proteasomal inhibitor MG‐132 diminished the inhibitory effect of resveratrol on HIF‐1α protein expression, suggesting that resveratrol exhibited its inhibitory effect on HIF‐1α accumulation by promoting proteasomal HIF‐1α degradation in a manner relative to the regulation of SIRT1 activity (Figure 9C).
Figure 9.

Effect of resveratrol (Res) on the expression of SIRT1. Epididymal adipose tissue from normal mice was pretreated with the indicated agents and then cultured under hypoxic conditions (1% O2) for 24 h. Protein expression of SIRT1 and HIF‐1α abundance was determined by western blot. Data are expressed as mean ± SD of five mice per group. *P < 0.05 versus hypoxia‐only treatment; # P < 0.05 versus the indicated treatment. Met, metformin; NA, niacinamide.
Discussion
Intra‐adipose tissue hypoxia and the activation of HIF‐1α in obesity contribute to insulin resistance and type 2 diabetes (Jiang et al., 2011; Krishnan et al., 2012). In contrast to the supposition that hypoxia in obesity is due to fat expansion, a recent study demonstrated that PA stimulation triggers hypoxia in adipose tissue by increasing oxygen consumption (Lee et al., 2014). Consistent with this finding, in the present study, we successfully induced hypoxia in adipocytes by feeding mice a HFD for a short time (7 days) and found that metformin and resveratrol effectively prevented hypoxia and inhibited fibrosis in adipose tissue. Because metformin has been widely used for treating type 2 diabetes and the anti‐diabetic effect of resveratrol has been well‐characterized, these results suggest the possibility that the preventing the reduction in oxygen in adipose tissue may be a potential therapeutic strategy to counteract lipid disorder‐induced insulin resistance.
It is generally accepted that hypoxia in obese adipose tissue is due to increased adipocyte size or the expansion of fat mass. In contrast, in the present study, we showed that short‐term HFD feeding (7 days) induced adipose hypoxia with no significant alteration occurring in adipocyte size. Short‐term HFD feeding elevated the levels of FFAs and TC in the blood, while other metabolic parameters remained at basal levels; therefore, this model is suitable for us to examine the specific role of lipid disorders in adipose hypoxia. Consistent with results from a recent study demonstrating that PA induces hypoxia in adipose tissue by increasing oxygen consumption in adipocytes, our findings suggest that lipid‐induced hypoxia in adipose tissue is an early event in the course of obesity responsible for adipose dysfunction.
As a cellular stress, hypoxia induces ER stress, and the impact of hypoxia‐associated ER stress in heart and brain ischaemic injury has been well‐documented. In obesity, hypoxia and ER stress are also present in adipose tissue independently (Hosogai et al., 2007). In the present study, HFD feeding as well as hypoxia treatment induced ER stress, and the ER stress inhibitor TUDCA prevented the reduced oxygen tension in adipose tissue, indicating the involvement of ER stress in hypoxic insult. TUDCA attenuated HIF‐1α expression in response to hypoxia, while the HIF‐1α inhibitor digoxin failed to suppress ER stress markers, indicating that ER stress contributed to hypoxia‐induced HIF‐1α accumulation. Although it has been demonstrated that PA challenge increases oxygen consumption in a mitochondrial pathway (Lee et al., 2014), HFD feeding‐induced hypoxia in adipose tissue should be a final result derived from the responses of the activated ER stress, oxidative stress and inflammation, during which increased oxygen consumption is required. In fact, both ER stress and HIF‐1α induction are the stress response to the lower oxygen tension in adipose tissue, and in this context, the inhibitory action of metformin and resveratrol in ER stress and hypoxia in adipose tissue was an attempt to restore cellular homeostasis.
In response to hypoxia, the induction of HIF‐1α is an adaptive response, aimed at activating an angiogenic programme, whereas in adipose tissue, HIF‐1α fails to activate an effective pro‐angiogenic response (Halberg et al., 2009; Sun et al., 2013b). Instead, it activates an alternative transcriptional programme encoding the synthesis of ECM components, leading to fibrosis in adipose tissue (Halberg et al., 2009). Indeed, we found that HFD feeding or hypoxia treatment increased the gene expressions of ECM components, including Col3α, Col6α, elastin and LOX, in adipose tissue. The fibrotic collagens III and VI (Col3 and Col6) are the main constituents of ECM in adipose tissue (Halberg et al., 2009), while elastin is a key ECM protein that is critical for the elasticity and resilience of the tissue. More importantly, LOX facilitates the cross‐linking and stabilization of elastin and collagen in the extracellular space and, thereby, increases insoluble matrix deposition in the tissue (Kagan and Li, 2003). Metformin and resveratrol suppressed HIF‐1α activation, and as a subsequent result, both agents effectively inhibited gene expressions for these ECM components. Consistent with this effect on these genes, the reduced Masson's staining further confirmed the inhibitory effects of metformin and resveratrol on ECM deposition in the extracellular space. In addition to the regulation of ECM synthesis, HIF‐1α induction can evoke NF‐κB‐dependent inflammation (Rius et al., 2008). Oral administration of metformin and resveratrol inhibited pro‐inflammatory cytokine expression in adipose tissue of HFD‐fed mice, demonstrating their anti‐inflammatory activity. Metformin and resveratrol inhibited fibrosis in adipose tissue and improved the flexibility of ECM and thereby prevented cell injury or apoptosis in fat expansion. As F4/80 is an indicator for the recruitment of macrophages, metformin and resveratrol inhibited F4/80 expression in adipose tissue, implying that the anti‐fibrotic action of metformin and resveratrol contributes to the reduction in macrophage recruitment and blocks the inflammatory crosstalk between adipocytes and macrophages in adipose tissue. Metformin and resveratrol demonstrated a similar regulation of pro‐inflammatory cytokines and ECM components in adipose tissue incubated in 1% O2, indicating that their effects in HFD‐fed mice was an action related to the protection against hypoxia insult. Given the important role of adipose inflammation in the initiation and development of insulin resistance, these results show that inhibition of hypoxia‐associated fibrosis in adipose tissue should contribute to preventing inflammation and insulin resistance in the early course of obesity.
Metformin and resveratrol promote AMPK activity, and this action contributes to their inhibitory effects on inflammation (Hattori et al., 2006; Sun et al., 2014). As an energy sensor, AMPK regulates cellular homeostasis and, therefore, we wanted to know whether metformin and resveratrol inhibited HIF‐1α induction by affecting AMPK under hypoxic conditions. Incubation of adipocytes in 1% O2 lowed oxygen tension and led to hypoxia; the AMPK activator AICAR failed to prevent this effect. Although the reduced ratio of ATP to AMP is able to promote AMPK activation, this effect occurs at a step before the AMPK activation and, therefore, explained why AMPK activation was not involved in the attenuation adipose hypoxia by metformin and resveratrol. In addition, it has been demonstrated that AMPK is not required for the hypoxic activation of HIF‐1α (Emerling et al., 2007). In fact, AICAR promotes AMPK activation by mimicking the effects of AMP on AMPK in the form of ZMP without the altering intracellular oxygen tension. Consistent with this, we observed that resveratrol failed to influence oxygen tension in adipocytes under the hypoxic condition. Different from AICAR and resveratrol, metformin treatment effectively prevented the hypoxic state in adipocytes. It is well‐known that metformin decreases cellular respiration by a mild and specific inhibition of the respiratory chain complex I in an AMPK‐independent manner (Owen et al., 2000). It has been reported that metformin inhibits ATP production and reduces oxygen consumption by inhibiting mitochondrial complex I and, thereby, prevents hypoxia and HIF‐1α accumulation in renal proximal tubular epithelial cells (Takiyama et al., 2011). In support of this view, we observed that metformin, but not resveratrol, reduced ATP production and prevented the reduction in oxygen tension in adipocytes. Knockdown of AMPKα with siRNA did not affect the inhibitory effect of metformin on HIF‐1α expression, further indicating that metformin inhibited hypoxia‐induced HIF‐1α induction, independently of the AMPK pathway. Interestingly, we found that PA stimulation in adipocytes increased OCR, leading to low oxygen tension. Metformin and resveratrol reduced OCR, and as a result of the limited oxygen consumption, they effectively prevented hypoxia in adipocytes. These results also explain why both metformin and resveratrol demonstrated a similar effect on the prevention of hypoxia and HIF‐1α accumulation in adipose tissue of HFD‐fed mice.
In contrast to the action of metformin, ‘silencing’ of AMPKα with siRNA blocked the inhibitory effect of resveratrol on HIF‐1α expression in hypoxic adipocytes. Because AMPK activation is not involved in the modulation of oxygen tension, we wanted to know how resveratrol regulated HIF‐1α expression by affecting AMPK activity. Resveratrol is a multifunctional compound. In addition to affecting AMPK, it has the ability to activate SIRT1 (Lagouge et al., 2006). As cellular energy sensors, AMPK and SIRT1 both regulate each other and share many common target molecules (Ruderman et al., 2010). In our previous work, we showed that resveratrol inhibited inflammation in adipose tissue in a manner dependent on AMPK and SIRT1 (Sun et al., 2014). HIF‐1α is constantly synthesized and rapidly degraded through the proteasomal system, and SIRT1 is shown to be required for the efficient degradation of HIF‐1α (Gomes et al., 2013). The SIRT1 inhibitor nicotinamide and proteasomal inhibitor MG‐132 diminished the inhibitory effects of resveratrol on hypoxic‐induced HIF‐1α activation, suggesting the possibility that resveratrol reduced HIF‐1α accumulation by promoting proteasomal degradation by an effect on SIRT1. In the present study, the AMPK inhibitor compound C attenuated the enhancing effect of resveratrol on SIRT1 activity, implying a possible role of AMPK in SIRT1 activation; this is probably the reason that AMPK has a role in the effect of resveratrol on HIF‐1α.
In the current study, we showed that short‐term HFD feeding induces hypoxic HIF‐1α activation and fibrosis in adipose tissue without a significant increase in fat, demonstrating the early cause for lipid disorder‐induced adipose dysfunction. Metformin inhibited the activation of HIF‐1α by preventing hypoxia in adipose tissue, while resveratrol promoted HIF‐1α degradation by the regulation of SIRT1. Although the mechanism is different, metformin and resveratrol equally inhibited HIF‐1α activation‐induced fibrosis and inflammation in adipose tissue. These results provided a novel insight into the beneficial effects of metformin and resveratrol on the regulation of adipose function in obesity.
Author contributions
F.H. designed the research. X.L. performed the experiments, analysed the data and drafted the manuscript. J.L., L.W., A.L. and Z.Q. performed the experiments and collected data for the revision. F.H. edited the manuscript. L.Q., J.K., K.L. and B.L. contributed to the discussion and review of the manuscript.
Conflict of interest
The authors declare no conflicts of interest.
Declaration of transparency and scientific rigour
This Declaration acknowledges that this paper adheres to the principles for transparent reporting and scientific rigour of preclinical research recommended by funding agencies, publishers and other organizations engaged with supporting research.
Supporting information
Supporting Information
Table S1 The primer sequences of products of PCR.
Figure S1 Effect of metformin (Met) and resveratrol (Res) on blood lipids, glucose, body weight gain and plasma insulin level in HFD‐fed mice. Mice were fed with HFD for 7 days simultaneously with administration of Met, Res or TUDCA by oral gavage. (A) Nonesterified fatty acid, TC, triglyceride and the glucose in the blood; (B) body weight gain (left) and plasma insulin level (right) in HFD‐fed mice. The results were expressed as the mean ± SD (n = 6). *P < 0.05 versus HFD feeding‐only treatment; # P < 0.05 versus the indicated treatment. NCD.
Acknowledgements
This work is supported by Jiangsu Collaborative Innovation Center of Chinese Medicinal Resources Industrialization and Qing Lan Project in Jiangsu Province.
Li, X. , Li, J. , Wang, L. , Li, A. , Qiu, Z. , Qi, L. , Kou, J. , Liu, K. , Liu, B. , and Huang, F. (2016) The role of metformin and resveratrol in the prevention of hypoxia‐inducible factor 1α accumulation and fibrosis in hypoxic adipose tissue. British Journal of Pharmacology, 173: 2001–2015. doi: 10.1111/bph.13493.
References
- Alexander SP, Davenport AP, Kelly E, Marrion N, Peters JA, Benson HE et al. (2015a). The concise guide to PHARMACOLOGY 2015/16: G protein‐coupled receptors. Br J Pharmacol 172: 5744–5869. [DOI] [PMC free article] [PubMed] [Google Scholar]
- Alexander SPH, Fabbro D, Kelly E, Marrion N, Peters JA, Benson HE et al. (2015b). The Concise Guide to PHARMACOLOGY 2015/16: Enzymes. Br J Pharmacol 172: 6024–6109. [DOI] [PMC free article] [PubMed] [Google Scholar]
- Bai J, Zhang N, Hua Y, Wang B, Ling L, Ferro A et al. (2013). Metformin inhibits angiotensin II‐induced differentiation of cardiac fibroblasts into myofibroblasts. PLoS One 8: e72120. [DOI] [PMC free article] [PubMed] [Google Scholar]
- Bai Y, Lu H, Wu C, Liang Y, Wang S, Lin C et al. (2014). Resveratrol inhibits epithelial–mesenchymal transition and renal fibrosis by antagonizing the hedgehog signaling pathway. Biochem Pharmacol 92: 484–493. [DOI] [PubMed] [Google Scholar]
- Brasnyó P, Molnár GA, Mohás M, Markóal L, Laczyal B, Cseh J et al. (2011). Resveratrol improves insulin sensitivity, reduces oxidative stress and activates the Akt pathway in type 2 diabetic patients. Brit J Nutr 106: 383–389. [DOI] [PubMed] [Google Scholar]
- Chen T, Li J, Liu J, Li N, Wang S, Liu H et al. (2015). Activation of SIRT3 by resveratrol ameliorates cardiac fibrosis and improves cardiac function via TGF‐β/Smad3 pathway. Am J Physiol‐Heart C 308: H424–H434. [DOI] [PubMed] [Google Scholar]
- Curtis MJ, Bond RA, Spina D, Ahluwalia A, Alexander SPA, Giembycz MA et al. (2015). Experimental design and analysis and their reporting: new guidance for publication in BJP. Br J Pharmacol 172: 3461–3471. [DOI] [PMC free article] [PubMed] [Google Scholar]
- Di Pascoli M, Diví M, Rodríguez‐Vilarrupla A, Rosado E, Gracia‐Sancho J, Vilaseca M et al. (2013). Resveratrol improves intrahepatic endothelial dysfunction and reduces hepatic fibrosis and portal pressure in cirrhotic rats. J Hepatol 58: 904–910. [DOI] [PubMed] [Google Scholar]
- Emerling BM, Viollet B, Tormos KV, Chandel NS (2007). Compound C inhibits hypoxic activation of HIF‐1 independent of AMPK. FEBS Lett 581: 5727–5731. [DOI] [PMC free article] [PubMed] [Google Scholar]
- Gomes AP, Price NL, Ling AJ, Moslehi JJ, Montgomery MK, Rajman L et al. (2013). Declining NAD+ induces a pseudohypoxic state disrupting nuclear–mitochondrial communication during aging. Cell 155: 1624–1638. [DOI] [PMC free article] [PubMed] [Google Scholar]
- Halberg N, Khan T, Trujillo ME, Wernstedt‐Asterholm I, Attie AD, Sherwani S et al. (2009). Hypoxia‐inducible factor 1α induces fibrosis and insulin resistance in white adipose tissue. Mol Cell Biol 29: 4467–4483. [DOI] [PMC free article] [PubMed] [Google Scholar]
- Hattori Y, Suzuki K, Hattori S, Kasai K (2006). Metformin inhibits cytokine‐induced nuclear factor κB activation via AMP‐activated protein kinase activation in vascular endothelial cells. Hypertension 47: 1183–1188. [DOI] [PubMed] [Google Scholar]
- Hosogai N, Fukuhara A, Oshima K, Miyata Y, Tanaka S, Segawa K et al. (2007). Adipose tissue hypoxia in obesity and its impact on adipocytokine dysregulation. Diabetes 56: 901–911. [DOI] [PubMed] [Google Scholar]
- Jiang C, Qu A, Matsubara T, Chanturyia T, Jou W, Gavrilova O et al. (2011). Disruption of hypoxia‐inducible factor 1 in adipocytes improves insulin sensitivity and decreases adiposity in high‐fat diet‐fed mice. Diabetes 60: 2484–2495. [DOI] [PMC free article] [PubMed] [Google Scholar]
- Kagan HM, Li W (2003). Lysyl oxidase: properties, specificity, and biological roles inside and outside of the cell. J Cell Biochem 88: 660–672. [DOI] [PubMed] [Google Scholar]
- Khan T, Muise ES, Iyengar P, Wang ZV, Chandalia M, Abate N et al. (2009). Metabolic dysregulation and adipose tissue fibrosis: role of collagen VI. Mol Cell Biol 29: 1575–1591. [DOI] [PMC free article] [PubMed] [Google Scholar]
- Kilkenny C, Browne W, Cuthill IC, Emerson M, Altman DG (2010). Animal research: reporting in vivo experiments: the ARRIVE guidelines. Br J Pharmacol 160: 1577–1579. [DOI] [PMC free article] [PubMed] [Google Scholar]
- Kim H, Moon SY, Kim JS, Baek CH, Kim M, Min JY et al. (2015). Activation of AMP‐activated protein kinase inhibits ER stress and renal fibrosis. Am J Physiol‐Renal 308: F226–F236. [DOI] [PubMed] [Google Scholar]
- Krishnan J, Danzer C, Simka T, Ukropec J, Walter KM, Kumpf S et al. (2012). Dietary obesity‐associated Hif1α activation in adipocytes restricts fatty acid oxidation and energy expenditure via suppression of the Sirt2‐NAD+ system. Genes Dev 26: 259–270. [DOI] [PMC free article] [PubMed] [Google Scholar]
- Lagouge M, Argmann C, Gerhart‐Hines Z, Meziane H, Lerin C, Daussin F et al. (2006). Resveratrol improves mitochondrial function and protects against metabolic disease by activating SIRT1 and PGC‐1α. Cell 127: 1109–1122. [DOI] [PubMed] [Google Scholar]
- Lee CG, Carr MC, Murdoch SJ, Mitchell E, Woods NF, Wener MH et al. (2009). Adipokines, inflammation, and visceral adiposity across the menopausal transition: a prospective study. J Clin Endocrinol Metab 94: 1104–1110. [DOI] [PMC free article] [PubMed] [Google Scholar]
- Lee YS, Kim JW, Osborne O, Oh da Y, Sasik R, Schenk S et al. (2014). Increased adipocyte O2 consumption triggers HIF‐1α, causing inflammation and insulin resistance in obesity. Cell 157: 1339–1352. [DOI] [PMC free article] [PubMed] [Google Scholar]
- McGrath JC, Lilley E (2015). Implementing guidelines on reporting research using animals (ARRIVE etc.): new requirements for publication in BJP. Br J Pharmacol 172: 3189–3193. [DOI] [PMC free article] [PubMed] [Google Scholar]
- Owen MR, Doran E, Halestrap AP (2000). Evidence that metformin exerts its anti‐diabetic effects through inhibition of complex I of the mitochondrial respiratory chain. Biochem J 348: 607–614. [PMC free article] [PubMed] [Google Scholar]
- Ozturk ZA, Kadayifci A (2014). Insulin sensitizers for the treatment of non‐alcoholic fatty liver disease. World J Hepatol 6: 199–206. [DOI] [PMC free article] [PubMed] [Google Scholar]
- Pawson AJ, Sharman JL, Benson HE, Faccenda E, Alexander SP, Buneman OP et al. (2014). The IUPHAR/BPS guide to PHARMACOLOGY: an expert‐driven knowledge base of drug targets and their ligands. Nucleic Acids Res 42: D1098–D1106. [DOI] [PMC free article] [PubMed] [Google Scholar]
- Rius J, Guma M, Schachtrup C, Akassoglou K, Zinkernagel AS, Nizet V et al. (2008). NF‐kappaB links innate immunity to the hypoxic response through transcriptional regulation of HIF‐1alpha. Nature 453: 807–811. [DOI] [PMC free article] [PubMed] [Google Scholar]
- Ruderman NB, Xu XJ, Nelson L, Cacicedo JM, Saha AK, Lan F et al. (2010). AMPK and SIRT1: a long‐standing partnership? Am J Physiol‐Endoc M 298: E751–E760. [DOI] [PMC free article] [PubMed] [Google Scholar]
- Semenza GL (2012). Hypoxia‐inducible factors in physiology and medicine. Cell 148: 399–408. [DOI] [PMC free article] [PubMed] [Google Scholar]
- Sun K, Halberg N, Khan M, Magalang UJ, Scherer PE et al. (2013a). Selective inhibition of hypoxia‐inducible factor 1α ameliorates adipose tissue dysfunction. Mol Cell Biol 33: 904–917. [DOI] [PMC free article] [PubMed] [Google Scholar]
- Sun K, Tordjman J, Clément K (2013b). Fibrosis and adipose tissue dysfunction. Cell Metab 18: 470–477. [DOI] [PMC free article] [PubMed] [Google Scholar]
- Sun Y, Li J, Xiao N, Wang M, Kou J, Qi L et al. (2014). Pharmacological activation of AMPK ameliorates perivascular adipose/endothelial dysfunction in a manner interdependent on AMPK and SIRT1. Pharmacol Res 89: 19–28. [DOI] [PubMed] [Google Scholar]
- Takiyama Y, Harumi T, Watanabe J, Fujita Y, Honjo J, Shimizu N et al. (2011). Tubular injury in a rat model of type 2 diabetes is prevented by metformin: a possible role of HIF‐1α expression and oxygen metabolism. Diabetes 60: 981–992. [DOI] [PMC free article] [PubMed] [Google Scholar]
- Trayhurn P (2013). Hypoxia and adipose tissue function and dysfunction in obesity. Physiol Rev 93: 1–21. [DOI] [PubMed] [Google Scholar]
- Xiao H, Ma X, Feng W, Fu Y, Lu Z, Xu M et al. (2010). Metformin attenuates cardiac fibrosis by inhibiting the TGF β1–Smad3 signalling pathway. Cardiovasc Res 87: 504–513. [DOI] [PubMed] [Google Scholar]
Associated Data
This section collects any data citations, data availability statements, or supplementary materials included in this article.
Supplementary Materials
Supporting Information
Table S1 The primer sequences of products of PCR.
Figure S1 Effect of metformin (Met) and resveratrol (Res) on blood lipids, glucose, body weight gain and plasma insulin level in HFD‐fed mice. Mice were fed with HFD for 7 days simultaneously with administration of Met, Res or TUDCA by oral gavage. (A) Nonesterified fatty acid, TC, triglyceride and the glucose in the blood; (B) body weight gain (left) and plasma insulin level (right) in HFD‐fed mice. The results were expressed as the mean ± SD (n = 6). *P < 0.05 versus HFD feeding‐only treatment; # P < 0.05 versus the indicated treatment. NCD.