

Abstract
Background and Purpose
In pulmonary hypertension (PH), similar to cancer, there is altered energy metabolism, apoptosis resistance and cellular proliferation leading to pulmonary vascular remodelling. Proliferating cells exhibit higher rate of de novo fatty acid synthesis to provide lipids for membrane formation and energy production. As inhibition of de novo fatty acid synthesis proved protective in cancer experimentally, therefore, it was hypothesized that modulation of de novo fatty acid synthesis by inhibition of fatty acid synthase (FAS) may prove beneficial for PH.
Experimental Approach
For in vitro studies, human pulmonary artery smooth muscle cells (HPASMCs) were exposed to hypoxia and to induce PH in vivo, rats were treated with monocrotaline (MCT). FAS was inhibited by siRNA (60 nM) and C75 (2 mg·kg−1, i.p. once a week for 5 weeks) in in vitro and in vivo studies respectively.
Results
Increased expression and activity of FAS were observed in hypoxic HPASMCs and lungs of MCT‐treated rats. Inhibition of FAS increased apoptosis and glucose oxidation, but decreased proliferation and markers of autophagy, glycolysis and insulin resistance in hypoxic HPASMCs. It also improved the mitochondrial functions as evident by increased level of ATP and restoration of normal level of ROS and membrane potential of mitochondria. In MCT‐treated rats, FAS inhibition decreased right ventricular pressure, hypertrophy, pulmonary vascular remodelling (increased apoptosis and decreased proliferation of cells) and endothelial dysfunction in lungs.
Conclusions
Our results demonstrate that FAS activity is modulated in PH, and its inhibition may provide a new therapeutic approach to treat PH.
Abbreviations
- AMPK
AMP‐activated protein kinase
- C75
FAS inhibitor
- CPT‐1
carnitine palmitoyltransferase I
- DBP
diastolic BP
- eNOS
endothelial NOS
- FAS
fatty acid synthase
- FAO
fatty acid oxidation
- FFA
free fatty acid
- GLUT‐1
glucose transporter 1
- GLY
glycolysis
- GO
glucose oxidation
- GSK3β
glycogen synthase kinase 3β
- HR
heart rate
- HIF‐1α
hypoxia‐inducible factor‐1α
- HPASMCs
human pulmonary arterial smooth muscle cells
- IR
insulin resistance
- LV + S
left ventricle plus septum
- MCT
monocrotaline
- mROS
mitochondrial ROS
- MBP
mean BP
- PDH
pyruvate dehydrogenase
- PE
phenylephrine
- PH
pulmonary hypertension
- RV
right ventricle
- RVH
right ventricular hypertrophy
- RVP
right ventricular pressure
- SBP
systolic BP
- siRNA
short interfering RNA
Tables of Links
| TARGETS | |
|---|---|
| Other protein targets a | Enzumes c |
| Bax | Akt (PKB) |
| Bcl2 | AMPK |
| Nuclear hormone receptors b | Caspase 3 |
| PPARγ | Endothelial NOS |
| Transporters d | Fatty acid synthase (FAS) |
| GLUT1 | GSK3β |
| HIF‐1α | |
| Malonyl‐CoA decarboxylase | |
| mTOR | |
| PDH kinase |
These Tables list key protein targets and ligands in this article which are hyperlinked to corresponding entries in http://www.guidetopharmacology.org, the common portal for data from the IUPHAR/BPS Guide to PHARMACOLOGY (Pawson et al., 2014) and are permanently archived in the Concise Guide to PHARMACOLOGY 2015/16 (a,b,c,dAlexander et al., 2015a, 2015b, 2015c, 2015d).
Introduction
Pulmonary hypertension (PH) is known to be caused by severe pulmonary vasoconstriction leading to right ventricle failure. However, in recent years, our understanding of the pathogenesis of PH has undergone a major paradigm shift when Voelkel et al. (1998) first suggested that PH shares its pathophysiology with cancer (Voelkel et al., 1998). Like cancer, PH shows deregulated angiogenesis, high expression of cellular growth factors, a strong resistance to apoptosis and altered energy metabolism (Tuder et al., 2012; Cottrill and Chan, 2013). As a result of altered energy metabolism in pulmonary vasculature cells during PH, there is a shift from oxidative phosphorylation towards increased glycolysis, an event termed the ‘Warburg Effect’(Tuder et al., 2012). This altered energy metabolism is also associated with insulin resistance (IR), and in PH, there are several reports of the existence of IR‐like conditions in pulmonary vessels (Zamanian et al., 2009; West et al., 2013).
Lipid metabolism is altered in rapidly proliferating cells, and increased fatty acid oxidation (FAO) is associated with cancer cell survival (Hoehn et al., 2008). In PH, targeting FAO by inhibiting malonyl CoA decarboxylase (MCD) or 3‐ketoacyl CoA thiolase proved protective, because it resulted in inhibition of FAO and promoted glucose oxidation (GO) (Sutendra et al., 2010). In order to sustain their high proliferation rate, cells rely not only on glycolysis but also on an altered lipid metabolism. Therefore, they use a high rate of de novo fatty acid synthesis to deliver lipids for the formation of cell membranes and energy production via β‐oxidation (Flavin et al., 2010). In addition, lipids (free fatty acids, FFAs) have also been found to modulate fundamental processes, which determine cell survival like apoptosis and autophagy (Komiya et al., 2010; Tan et al., 2012; Chen et al., 2013).
In various cancers, increased de novo fatty acid synthesis is associated with a higher expression of fatty acid synthase (FAS), a key enzyme involved in the production of long‐chain fatty acids (Flavin et al., 2010). Normal cells have low levels of expression and activity of FAS, which are tightly regulated by growth factors (Menendez and Lupu, 2007). Inhibition of FAS by short interfering RNA (siRNA) leads to effective suppression of proliferation and increased apoptosis in cancer cells (Bandyopadhyay et al., 2005; Van de Sande et al., 2005; Bandyopadhyay et al., 2006; Knowles et al., 2008). In animal models of cancer, FAS inhibition by epigallocatechin gallate and orlistat provided protection against tumour growth and proliferation by inducing apoptotic cell death (Weir et al., 2005; Menendez and Lupu, 2007; Kilkenny et al., 2010). Inhibition of FAS by C75 and C93 also resulted in reduced numbers and sizes of tumours in lung cancer (Orita et al., 2008), a xenograft cancer model (Dromparis and Michelakis, 2013) and in mammary cancer in neu‐N transgenic mice (Cottrill and Chan, 2013).
Although PH shares various aspects of its pathophysiology with cancer, as discussed above, like proliferation, apoptosis resistance and altered energy metabolism, so far no study has explored the role of FAS in PH. Our study showed increased expression and activity of FAS in hypoxic human pulmonary artery smooth muscle cells (HPASMCs) and in lungs of pulmonary hypertensive rats, and its inhibition proved protective as it decreased right ventricular pressure (RVP) and hypertrophy and pulmonary vascular remodelling.
Methods
Cell culture
HPASMCs were procured from Cascades Biologicals (Carlsbad, CA, USA) and maintained in their prescribed medium 231 supplemented with smooth muscle growth supplement (Invitrogen, Carlsbad, CA, USA). Hypoxia was induced by exposing the cells to 4% O2 with 4% CO2 and 92% N2 for 72 h at 37°C. FAS SMARTpool siRNA, (catalogue number L‐003954‐00) and scrambled control siRNA were purchased from Dharmacon (Lafayette, CO, USA). Cells were treated with these siRNA at 60 nM for 24 h in hypoxic conditions. After 24 h, the medium was changed, and hypoxic exposure was further continued up to 72 h. In each test, cells were randomly assigned across treatment groups.
Animal studies
Male Sprague–Dawley rats (SD, 300–320 g) were procured from the National Laboratory Animal Centre (NLAC) of CSIR‐Central Drug Research Institute, Lucknow, India. Experiments were performed according to international ethical standards and approved by the Institutional Animals Ethics Committee (IAEC) [IAEC/2013/03] and Committee for the Purpose of Control and Supervision of Experiments on Animals (CPCSEA), India. The animals were housed in polypropylene cages (three animals per cage) on husk bedding. Food and water were available to rats ad libitum (room temperature 24–27°C and humidity 60–65%, 12 h light and dark cycle). Animal studies are reported in compliance with the ARRIVE guidelines (Kilkenny et al., 2010; McGrath and Lilley, 2015).
The male SD rat is widely accepted as an animal model of PH, induced by MCT. The SD rats received a single s.c. injection of MCT (60 mg·kg−1) at day 0 to induce severe PH by 35th day (Kaur et al., 2015a). MCT was dissolved in 0.5 N HCl, and then pH was maintained at 7.4 with 0.5 N NaOH. For preventive studies, a group of randomly selected MCT‐injected rats received the FAS inhibitor, C75, (2 mg·kg−1, i.p. once in a week, dissolved in 8% DMSO) (Gabrielson et al., 2001) for 5 weeks. For therapeutic studies, randomly selected MCT‐injected rats received C75 (2 mg·kg−1, i.p. once in a week) from days 21 to 35 (Kaur et al., 2015a). In each test, animals were randomly assigned across treatment groups.
Assessment of right ventricular pressure (RVP) and systemic haemodynamic parameters
RVP and systemic haemodynamic parameters like systolic BP (SBP), diastolic BP (DBP), mean BP (MBP) and heart rate (HR) were measured by the PowerLab data acquisition system (DAS) (4/25, ADInstrument, Bella Vista, Sydney, Australia) as described previously (Kaur et al., 2015a). Briefly, rats were anaesthetized with urethane (1.5 gm·kg−1; i.p.) and placed on an isothermal pad to maintain normal body temperature during surgical procedures. The systemic haemodynamic parameters were recorded by inserting a fluid‐filled catheter, attached by a 25‐gauge blunted needle to a pressure transducer coupled to a DAS, into the left carotid artery. RVP was assessed by inserting a fluid‐filled catheter into the RV, which in turn, was attached to a 25‐gauge blunted needle to a pressure transducer coupled to a DAS. All animals were allowed to stabilize before the final readings were recorded.
Measurement of organ weight
Following the measurement of the RVP, animals were killed; the wall of the RV, left ventricular (LV) wall and ventricular septum (S) were separated from the rats’ hearts. The Fulton index (RV/LV + S), a marker of hypertrophy, was determined (Kaur et al., 2015a, 2015b).
Histological analysis
After the haemodynamic parameters had been measured, rat lungs were quickly isolated and fixed with 4% paraformaldehyde. The fixed lungs were then sliced mid‐sagittally and embedded in paraffin for haematoxylin and eosin staining or in ice‐cold 20% sucrose overnight to mount using optimal cutting temperature compound for immunofluorescences. The 7 μm sections were cut and stained with haematoxylin and eosin for the study of pulmonary vascular remodelling and cardiac hypertrophy. The heart section images were examined with the software LASV (Leica, Wetzlar, Germany). Immunohistochemistry and immunocytofluorescent staining with antibodies against α‐smooth muscle actin (α‐SMA), FAS (Abcam, Cambridge, UK) and p62 (Sigma, St Louis, MO, USA) were performed as previously described (Li et al., 2014). Images were examined with a Leica microscope (DM 6000; Leica Microsystems, Wetzlar, Germany).
Estimation of levels of FFA, malonyl CoA, FAS and pyruvate dehydrogenase activity
FFA, that is, the palmitate level was estimated in vitro by use of a commercially available kit procured from EnzyChrom (Bioassay Systems LLC, Hayward, CA, USA). The level of malonyl CoA was estimated by a commercially available kit from CUSABIO Life Sciences (College Park, MD, USA), according to the manufacturer's protocol in in vitro studies. FAS activity was determined by using a protocol previously described for use both in HPASMCs and lung tissue of rats (Liu et al., 2013). Pyruvate dehydrogenase (PDH) activity was estimated in mitochondria by use of a commercially available kit from Abcam according to the manufacturer's protocol.
Estimation of mitochondrial ROS
Mitochondrial ROS (mROS) was estimated by mitosox (Invitrogen) in in vitro studies as described previously (Mukhopadhyay et al., 2007). After the 72 h hypoxic exposure, cells were incubated with 5 μM mitosox for 30 min. Following this, cells were trypsinized and analysed using flow cytometry.
ATP estimation and assessment of mitochondrial membrane potential
ATP levels were estimated in vitro to check the mitochondrial function by using a commercially available kit (Abcam) according to the manufacturer's protocol in HPASMCs. To find out the membrane potential, tetramethylrhodamine methyl ester (TMRM, Invitrogen) staining was used in vitro as described previously (Sutendra et al., 2010). In in vivo studies, mitochondrial membrane potential (▲Ψm) was assessed by use of JC‐1 dye (Calbiochem, San Diego, USA) as described previously (Kaur et al., 2015a).
Assessment of apoptosis
For in vitro studies, annexin V (Invitrogen) staining was used to detect the apoptosis as described previously (Engeland et al., 2001). Caspase 3 activity was also estimated, to confirm these apoptosis results, by use of a commercially available kit according to the manufacturer's protocol (Biovision, Milpitas, CA, USA) (Kaur et al., 2015a). Apoptosis was studied in the optimal cutting temperature‐embedded sections of lungs by using a commercially available kit (DeadEnd Fluorometric TUNEL System; Promega, Madison, WI, USA). The sections were mounted with cover slips in an aqueous mounting medium (Ultracruz mounting medium, Sigma, St Louis, MO, USA) containing anti‐fade agent and DAPI to stain the nuclei. The images were then examined with a Leica microscope, (Leica Microsystems), and positively stained cells were counted by using image j software (1.48 version, NIH, US).
Palmitate treatment
To validate the involvement of FAS in PH pathophysiology, we carried out separate experiments with palmitate, which is the end product of the reaction catalysed by FAS to assess its effect on apoptosis and autophagy. The normal HPASMCs were treated with palmitate (500 μM) for 24 h. Palmitate was conjugated to 20% fatty acid‐free BSA in culture medium at fivefold the final concentration. BSA/palmitate or BSA (control) was heated at 50°C for 20 min, cooled to 37°C and diluted five times with culture medium before being subjected to filter sterilizing (Hoehn et al., 2008).
Assessment of pulmonary endothelial function
The heart and lungs were rapidly removed, and two segments of the extra lobar pulmonary artery were dissected from each rat (n = 8 pulmonary arterial rings, one ring was taken from each animal of each group). The pulmonary arterial rings (transverse 4 mm wide) were suspended between two hooks and equilibrated for 90 min in organ baths containing Krebs solution, maintained at 37°C and continuously oxygenated. The pulmonary arterial rings were kept under a constant tension of 1 g throughout the experiment. The response was measured before and after the experimental protocol in each pulmonary ring. Isometric measurements were recorded with force transducers (FSG‐01; Experimetria, Budapest, Hungary) using a S.P.E.L. solution pack from Experimental Laboratories ADVANCE ISOSYS data acquisition and analysis software (Charles‐River Laboratories, Hungary/Germany, Experimetria Ltd., Budapest, Hungary). The pulmonary arterial rings were exposed to KCl (80 mM) solution to check the maximum tissue contractility and viability. After this, the pulmonary arterial rings were contracted with phenylepherine (PE) (1 nM–100 μM) to obtain a concentration‐response curve. The functionality of the pulmonary artery endothelium was checked by obtaining an acetylcholine (300 nM–3 mM)‐induced relaxation response in PE (1 μM)‐preconstricted pulmonary rings. The relaxant responses of acetylcholine were plotted as a % of relaxation (Kaur et al., 2015b).
Western blot studies
Cells/tissues were homogenized and sonicated in cell lysis buffer containing protease and phosphatase inhibitors to extract whole cell lysate, nuclear, mitochondrial and cytosolic fractions as described previously (Dimauro et al., 2012). Then 40–60 μg of protein was used to perform the expression studies of FAS, carnitine palmitoyltransferase I (CPT‐1), PDH, p‐glycogen synthase kinase 3 (GSK3β), GSK3β (Abcam), PPARγ, LC3B, p‐AMP‐activated protein kinase (AMPK), AMPK, pAkt, Akt, p‐mTOR, mTOR, hypoxia‐inducible factor‐1α (HIF‐1α), p‐endothelial NOS (eNOS), eNOS (Cell Signalling Technology, USA), PCNA, glucose transporter‐1 (GLUT‐1) (Santa Cruz Biotechnology, Dallas, TX, USA), p62 and actin (Sigma). The immunoreactive bands were visualized by enhanced chemiluminescence detection (GE Healthcare, Little Chalfont, UK). The band intensity was measured by myimage analysis software (Thermo Scientific; Thermo Fisher Scientific, Waltham, MA, USA) using spot densitometry analysis.
Statistical analysis
The results are presented as means ± SEM, and data were collected in a blinded fashion. Data were tested for normality using the Kolmogorov–Smirnov method. For two‐variable sets of data, Student's t‐test was used. To confirm the validity of the results for sets of data, one‐way ANOVA followed by Bonferroni post hoc test were performed by using prism 5.0 (GraphPad Software, USA) if F‐test of variance had achieved the necessary level of statistical significance (i.e. P < 0.05). In all cases, P values <0.05 were considered significant. In accordance with journal policy when n < 5, statistical analyses were not performed. In in vitro studies where at least one group was n = 3 (hypoxia + Scr.siRNA), ANOVA was performed, and the said group was not included in the post hoc comparisons. The data and statistical analysis comply with the recommendations on experimental design and analysis in pharmacology (Curtis et al., 2015).
Chemicals
Monocrotaline (MCT) and most of the other chemicals were obtained from Sigma (St Louis, MO, USA) unless otherwise specified.
Results
Hypoxia increases FAS activity, expression and proliferation in HPASMCs
The duration of 72 h was found to be optimal for hypoxic exposure of HPASMCs, which increased the expression of PCNA, cell number and HIF‐1α (P < 0.05), the characteristic hallmarks of proliferation and hypoxic milieu of cells in PH (data not shown).
Increased de novo fatty acid synthesis was evident by increased expression and activity of FAS in hypoxic HPASMCs (Figure 1A, B and C). Treatment with FAS siRNA significantly reduced the expression and activity (P < 0.05) of FAS, whereas scrambled siRNA did not have any effect. FAS is responsible for the conversion of malonyl CoA into FFAs (palmitate). Hypoxia, due to increased FAS activity, resulted in increased level of FFAs (palmitate) and decreased malonyl CoA level, which were significantly reversed (P < 0.05) by FAS inhibition in hypoxic HPASMCs (Figure 1D and E).
Figure 1.
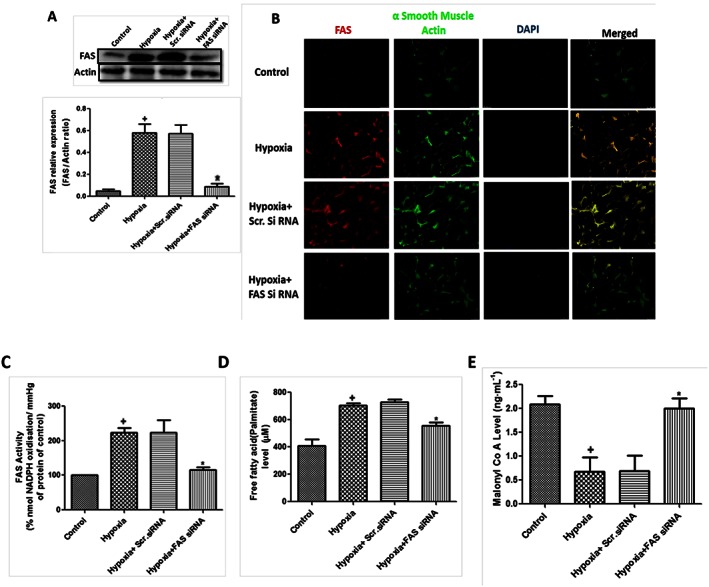
Hypoxia increases de novo fatty acid synthesis and FAS in HPASMCs. (A) Effect of FAS inhibition in hypoxia‐exposed HPASMCs. Quantification of FAS/actin ratio and a representative western blot in primary cultures of HPASMCs (n = 6 in each group, except hypoxia + Scr.siRNA group where n = 3); (B) representative picture of immunocytochemistry of FAS in hypoxic HPASMCs (5×, n = 5 in each group); (C) activity of FAS in hypoxic HPASMCs (n = 6 in each group, except hypoxia + Scr.siRNA group only where n = 3); (D) decreased FFA level (palmitate) in FAS siRNA‐treated hypoxic HPASMCs (n = 6 in each group, except hypoxia + Scr.siRNA group only where n = 3); and (E) level of malonyl CoA in hypoxic HPASMCs (n = 6). + P < 0.05 versus control, * P < 0.05 versus hypoxia.
Proliferation in PASMCs is one the reason behind pulmonary vascular remodelling in pulmonary artery during PH. There was a significant increase in cell count and PCNA expression following 72 h hypoxic exposure, which was significantly attenuated by inhibition of FAS (Figure 2A, B and C).
Figure 2.
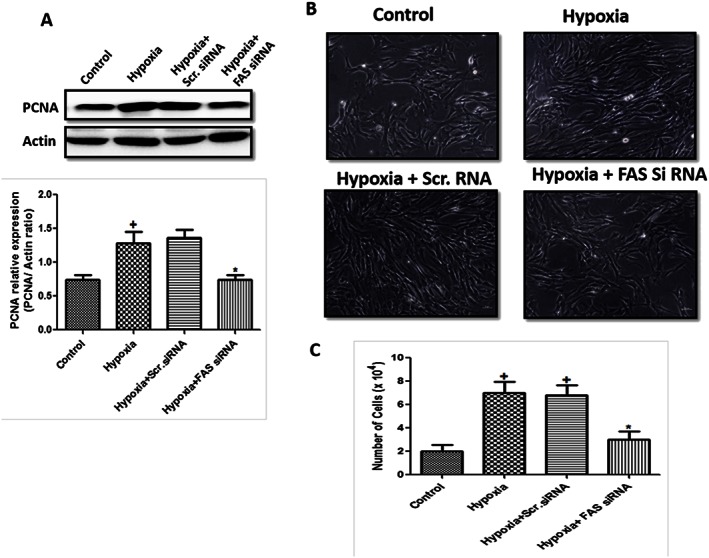
Effect of FAS inhibition on proliferation in hypoxic HPASMCs. (A) Quantification of PCNA/actin ratio and a representative western blot in primary cultures of HPASMCs (n = 6 in each group, except hypoxia + Scr.siRNA group only where n = 3); (B) representative picture of hypoxic HPASMCs (10×, n = 5 in each group); and (C) cell count (n = 6 in each group). + P < 0.05 versus control, * P < 0.05 versus hypoxia.
Metabolic dysfunction occurs in hypoxic HPASMCs
Following hypoxia, there was a disturbed glucose metabolism in HPASMCs as evident by decreased expression and activity of PDH, the rate‐limiting enzyme for GO (Figure 3A and B). The markers for glycolysis, that is, hexokinase 2, pGSK3β (Y216) and GLUT‐1, were also increased in hypoxic HPASMCs (Figure 3C). Consistent with Randle cycle, the reciprocal relationship between GO and FAO (Fang et al., 2012) was reflected in our study as evident by increased expression of CPT‐1, the marker of FAO (Figure 3A). Inhibition of FAS significantly ameliorated these metabolic changes by increasing GO marker and decreasing FAO markers. This was inferred from increased expression and activity of PDH (P < 0.05) and decreased expression of GLUT‐1, hexokinase 2, pGSK3β and CPT‐1 (P < 0.05, Figure 3A, B and C). Our study confirms, and corroborates other previous studies, that the metabolic alteration occurs in PH (Sutendra et al., 2010; Fang et al., 2012) and inhibiting FAS shifts the metabolism towards GO.
Figure 3.
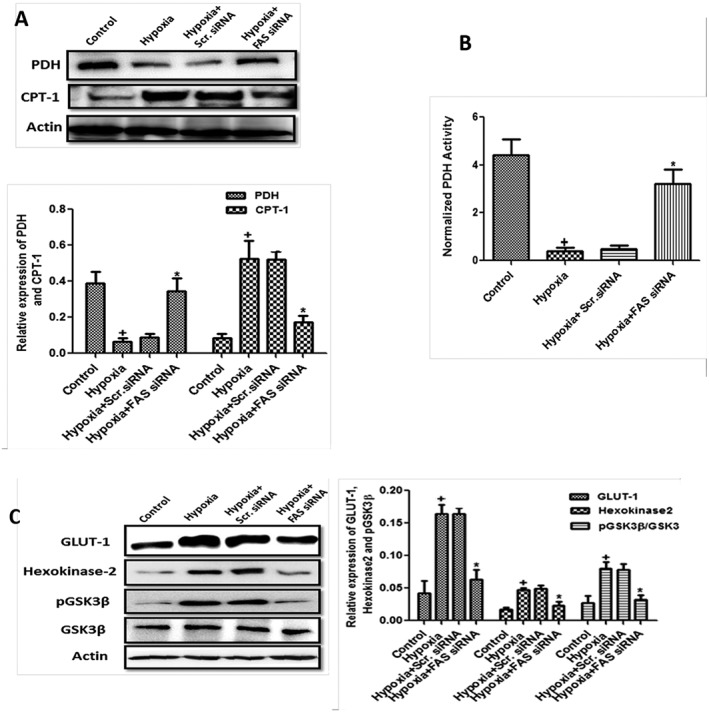
Metabolic dysfunction occurs in hypoxia‐exposed HPASMCs. (A–B) Quantification of PDH/actin and CPT‐1/actin ratio and representative western blot in primary cultures of HPASMCs and PDH activity and (C) quantification of GLUT‐1/actin, hexokinase 2/actin and pGSK3β/GSK3β ratios and a representative western blot in primary cultures of HPASMCs (n = 6 in each group, except hypoxia + Scr.siRNA group only where n = 3). + P < 0.05 versus control, * P < 0.05 versus hypoxia.
Involvement of FAS in mitochondrial function and insulin resistance in hypoxic HPASMCs
In response to hypoxia, there is a change in mitochondrial membrane potential and production of mROS in PH (Sutendra et al., 2010). There was a decreased mROS as evident by decreased mitosox positive cells (Figure 4A) and mitochondrial hyperpolarization evident by increase red colour fluorescence in hypoxic HPASMCs (Figure 4B). The inhibition of FAS in hypoxic HPASMCs brought mROS up to the normal control (P < 0.05). The treatment also attenuated the mitochondrial hyperpolarization, thus improving mitochondrial health.
Figure 4.

The mitochondrial dysfunction and insulin resistance in hypoxic HPASMCs. (A) Representative fluorescence‐activated cell sorter (FACS) dot plots of HPASMCs stained with mitosox. The red quadrants represent HPASMCs positive for mitosox (n = 6 in each group); (B) representative picture of TMRM staining in HPASMCs exposed to hypoxia and treated with either FAS siRNA or scrambled siRNA (5×, n = 5 in each group); and (C) treatment of FAS siRNA improves the insulin resistance. Quantification of pAMPK/AMPK, pAkt/Akt and PPARγ/actin ratios and a representative western blot in primary cultures of HPASMCs (n = 6 in each group, except hypoxia + Scr.siRNA group only where n = 3). + P < 0.05 versus control, * P < 0.05 versus hypoxia.
Metabolic dysregulation and IR are now associated in pulmonary vascular disease; therefore, we studied IR in this work. There was modulation of expression of IR markers as shown by increased expression of pAMPK and decreased expression of pAkt and PPARγ in hypoxic HPASMCs which was significantly attenuated by FAS inhibition (Figure 4C). To further validate the role of FAS in IR, experiments were carried out with palmitate, the end product of FAS catalysed reaction in hypoxic HPASMCs. The 24 h treatment with palmitate increased the expression of pAMPK and decreased pAKT as compared with control (Figure S1) indicating that FAS modulates IR. Our studies underlined that altered de novo fatty acid synthesis, mitochondrial dysfunction and IR occur in hypoxic conditions, which may be responsible for the metabolic dysfunction in PH.
FAS modulates apoptosis and autophagy in hypoxic HPASMCs
Previous work suggested the occurrence of apoptosis resistance in the pulmonary vascular remodelling of PH (Jin and Choi, 2012); therefore, we also checked the effect of FAS inhibition on apoptosis in hypoxic HPASMCs. There was increased expression of BCl2, an anti‐apoptotic gene, and decreased expression of Bax, the pro‐apoptotic marker, in hypoxic HPASMCs, which was significantly reversed by FAS inhibition. There was also decreased activity and expression of caspase 3 in hypoxic HPASMCs, which was significantly attenuated by inhibition of FAS (Figure 5A and B). Similar results were obtained with annexin V staining in HPASMCs. There were increased annexin V positive HPASMCs following FAS inhibition as compared with hypoxia‐exposed cells signifying the increased apoptosis (Figure 5C).
Figure 5.
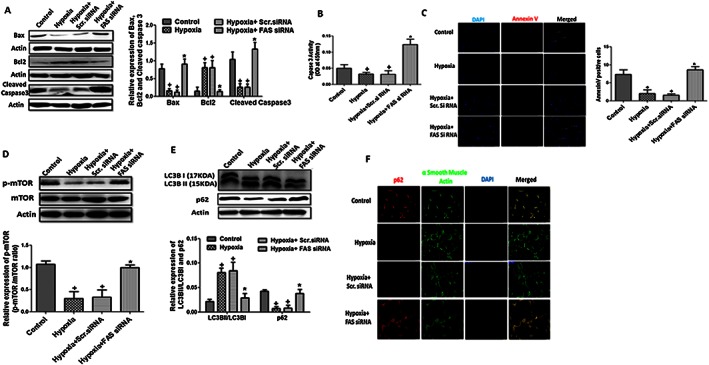
Apoptosis and autophagy in hypoxia‐exposed HPASMCs. (A–B) A representative western blot and quantification of Bax/actin, Bcl2/actin and cleaved caspase 3/actin ratios and caspase 3 activity in hypoxia‐exposed HPASMCs (n = 6 in each group, except hypoxia + Scr.siRNA group only where n = 3); (C) representative pictures of annexin V staining in hypoxic HPASMCs and quantification of annexin V positive cells (5×, n = 5 in each group). (D–E) Quantification of p‐mTOR/mTOR, LC3BII/LC3BI and p62/actin ratios and a representative western blot in primary cultures of HPASMCs (n = 6 in each group, except hypoxia + Scr.siRNA group only where n = 3); (F) representative picture of immunocytochemistry of autophagy flux marker p62 (5×, n = 5 in each group). + P < 0.05 versus control, * P < 0.05 versus hypoxia).
Autophagy serves as an important regulator for cellular metabolic abilities, and previous work suggested the relation between autophagy and apoptosis in the pulmonary vascular remodelling during PH (Jin and Choi, 2012). mTOR plays a pivotal role in autophagy signalling as its inhibition increases autophagy. We observed a decreased expression of p‐mTOR in hypoxic HPASMCs, which was significantly attenuated by FAS inhibition (Figure 5D). Autophagy was further evidenced by increased LC3BII/I expression ratio and decreased expression of p62, a marker of autophagy flux, following hypoxia. Autophagy markers were reversed (P < 0.05) by FAS inhibition in hypoxic HPASMCs (Figure 5E and F).
To validate the role of FAS in the autophagy and apoptosis, separate experiments were performed with palmitate. We treated the normal HPASMCs with palmitate, a product of FAS catalysed reaction and observed a decreased expression of p62, Bax, caspase 3 and increased expression of LC3BII and BCl2 as compared with control (Figures S2 and S3). These studies confirmed that hypoxia modulates autophagy and apoptosis and FAS inhibition decreased autophagy and increased apoptosis in hypoxic HPASMCs.
FAS inhibition protects against MCT‐induced pulmonary hypertension in rats
To validate in vitro observations, we further used a rat model of PH by single administration of MCT for 5 weeks. There was increased expression and activity of FAS in lungs, which was significantly attenuated (P < 0.05) by the treatment of C75, a FAS inhibitor (Figure 6A, B and C). Five weeks following treatment with MCT, rats showed significant increase in RVP, a characteristic marker for PH, as compared with control rats, which was significantly reversed by FAS inhibition (Figure 6D). Further, we also checked the therapeutic effect of FAS inhibition on PH. After 3 weeks of administration of MCT, C75 significantly prevented the increase in the RVP (P < 0.05) in therapeutic rat model of PH (Figure 6E). The percentage arterial oxygen saturation decreased significantly 35 days following the administration of MCT as compared with control, which was improved by FAS inhibition (Figure 6F). However, systemic haemodynamic parameters (SBP, DBP, MBP and HR) remained unchanged in all the groups (Table S1).
Figure 6.
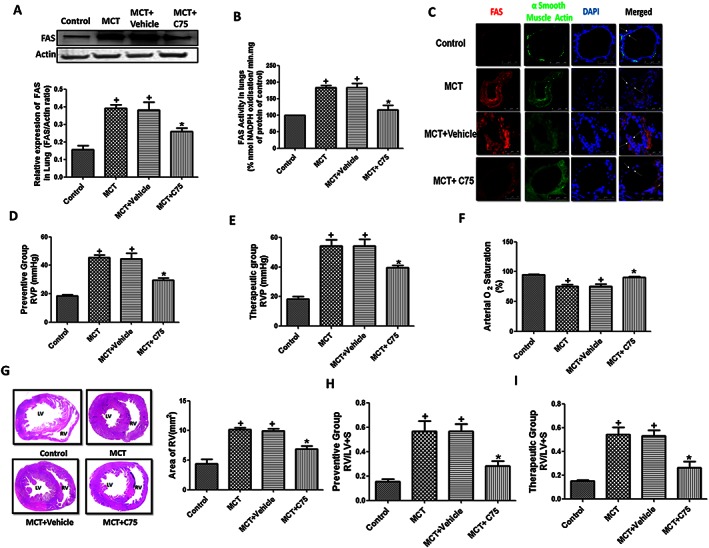
Involvement of FAS in MCT‐induced pulmonary hypertension in rats. (A–C) A representative western blot and quantification of FAS/actin ratio, activity of FAS and immunohistochemistry in the lung tissue of MCT‐treated rats (n = 6 rats in each group); (D–E) preventive and therapeutic treatment with C75 attenuated the increased RVP in MCT‐induced PH (n = 12 rats in each group); (F) arterial oxygen saturation (n = 12 rats in each group); (G) representative images of haematoxylin and eosin staining of heart for cardiac hypertrophy were taken at 4× and area of RV quantified (mm2) (n = 6 rats in each group); (H‐I) preventive and therapeutic group RVH measured by Fulton index. (n = 12 rats in each group). + P < 0.05 versus control, * P < 0.05 versus MCT.
Right ventricle hypertrophy (RVH) is closely associated with pathophysiology of PH. There was an increased RVH in MCT treated rats as evident by histological studies (Figure 6G) and increased Fulton index (Figure 6H), which were significantly attenuated by FAS inhibition. Therapeutic treatment by C75 also decreased the RVH in rats by decreasing RV/LV + S ratio (P < 0.05) (Figure 6I). Taken together, our data signifies that increased activation of FAS is involved in MCT‐induced PH.
Involvement of FAS in pulmonary endothelial function in MCT‐treated rats
Acetylcholine‐induced vasorelaxation was significantly decreased in phenyepherine‐constricted pulmonary arterial rings of MCT‐treated rats as compared with the control. C75 treatment caused a significant increase in vasorelaxation in pulmonary vessels as compared with the MCT group and showed improvement in endothelial function in MCT‐treated rats (Figure 7A). There was a significant decrease in the expression of p‐eNOS in lungs of MCT‐treated rats, which was significantly increased in C75‐treated rats (Figure 7B).
Figure 7.
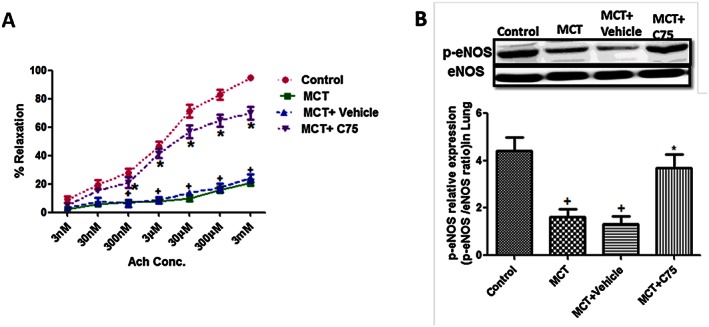
Involvement of FAS in endothelial dysfunction. (A) Inhibition of FAS improves acetylcholine‐induced vasorelaxation in phenylepherine precontracted rings from pulmonary artery of MCT‐treated rats (n = 8 rats in each group); (B) representative western blot and quantification of p‐eNOS/eNOS ratio in lungs of MCT‐treated rats (n = 6 rats in each group). + P < 0.05 versus control, * P < 0.05 versus MCT.
Involvement of FAS in mitochondrial function, apoptosis and autophagy in MCT‐treated rats
Hyperpolarization of mitochondrial membrane is associated with decreased aggregates of JC‐1 represented by green fluorescence at 530 nm. The ratio of JC‐1 aggregate to total number of events increased significantly in C75‐treated groups as compared with MCT‐treated rats demonstrating the better preservation of mitochondrial membrane potential in in vivo studies (Figure 8A). Mitochondrial dysfunction was further manifested in the form of exhaustion of ATP levels in MCT‐challenged rats as compared with control rats, which was improved by FAS inhibition (Figure 8B). All these findings indicated the involvement of FAS in mitochondrial dysfunction, and its inhibition improved the mitochondrial function in MCT‐induced PH.
Figure 8.
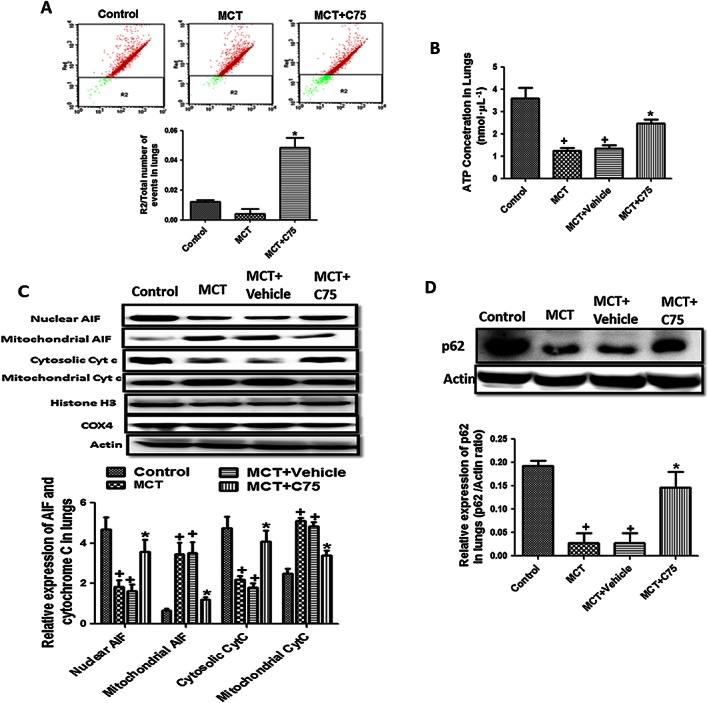
Involvement of FAS in mitochondrial dysfunction, apoptosis and autophagy. (A) Representative FACS dot plots of cells isolated from lungs tissue stained with JC‐1. Ratio of JC‐1 aggregates R2 to total number of events; (B) ATP level in lung tissue of MCT‐treated rats; (C) inhibition of FAS increased the apoptosis marker in lung tissue of MCT‐treated rats. Representative western blot and quantification of cytochrome c and apoptosis inducing factor (AIF) in nucleus, cytosol and mitochondrial fraction of lung tissue in MCT‐treated rats; and (D) representative western blot and quantification of p62/actin in lung tissue of MCT‐treated rats. (n = 6 rats in each group in each parameter). + P < 0.05 versus control, * P < 0.05 versus MCT.
Hyperpolarization of mitochondrial membrane is also responsible for the apoptosis resistance. There was an increase in the expression of apoptosis inducing factor (AIF), necessary for caspase‐independent apoptosis, and cytochrome c, an initiator of caspase‐dependent apoptosis in the mitochondria of MCT treated rats indicating apoptosis resistance. Inhibition of FAS by C75 allowed the translocation of AIF and cytochrome c from mitochondria to nucleus and cytosol, respectively, to induce apoptosis (Figure 8C). Further, treatment with C75 significantly increased the apoptosis represented by increased number of TUNEL positive cells as compared with MCT‐challenged rats (Figure S4) supporting the outcome of the in vivo expression studies.
Regarding autophagy, the results of in vivo studies were in sync with that of in vitro studies. There was a decreased expression of p62 indicating increased autophagy flux in the lung tissue of MCT‐treated rats, which was significantly reversed (P < 0.05) by FAS inhibition (Figure 8D). The immunohistochemistry results also proved that there was a down‐regulation of p62 in smooth muscle cell layer of pulmonary artery in MCT‐treated rats, which was increased by FAS inhibition due to inhibition of autophagy (Figure S5).
Taken altogether, our in vivo results support the in vitro findings that increased FAS activity is responsible for apoptosis resistance and autophagy and inhibition of FAS reverses these changes in MCT model of PH.
FAS determines pulmonary vascular remodelling and proliferation in MCT‐treated rats
MCT‐induced PH is characterized by pulmonary vascular remodelling. Muscularization of pulmonary arterioles increased in rats after 35 days following MCT exposure. Treatment with C75 significantly reversed the degree of muscularization of distal pulmonary arteries with diameter >100 and 100–250 μm as compared with MCT‐treated rats (Figure 9A, B and C).
Figure 9.
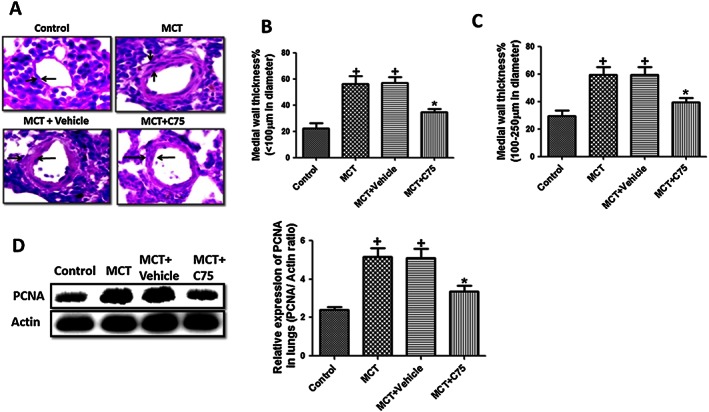
Involvement of FAS in pulmonary vascular remodelling and proliferation in MCT‐induced pulmonary hypertension in rats. (A‐C) Treatment with C75 (2 mg·kg−1, once in a week for 5 weeks) decreased the pulmonary vascular remodelling in MCT‐treated rats (10×, n = 8 rats in each group). Quantification of medial wall thickness of pulmonary artery <100 μm (n = 30 artery in each group) and 100–250 μm (n = 30 artery in each group); (D) a representative western blot, quantification of PCNA/actin ratio in lungs of MCT‐treated rats (n = 6 rats in each group). + P < 0.05 versus control, * P < 0.05 versus MCT.
Pulmonary vascular remodelling associated with PH is marked by increased PCNA, a marker of cell proliferation. There was a decreased expression (P < 0.05) of PCNA in FAS inhibitor group of rats (Figure 9 D). All these findings indicate that inhibition of FAS decreased pulmonary vascular remodelling in MCT‐induced PH.
Discussion
There is accumulating evidence showing that metabolic dysfunction may be a novel target for understanding the pathophysiology of PH (Dromparis et al., 2010; Sutendra et al., 2010). There are reports of altered lipid metabolism in PH, but so far, no study in PH has explored the involvement of FAS, an enzyme involved in de novo fatty acid synthesis and whose inhibition has been found to be protective, experimentally, in cancer. In the present study, we have shown that the increased de novo fatty acid synthesis plays an important role in altering energy metabolism, autophagy, apoptosis and contributes to the progression of PH. There was an increased activity and expression of FAS in hypoxic HPASMCs and in the rat model of PH, and its inhibition, by gene silencing or by use of a pharmacological inhibitor, decreased the proliferation, apoptosis‐resistance responsible for pulmonary vascular remodelling and also shifted the metabolism from FAO to GO.
The pathophysiology of PH is similar to cancer (Rai et al., 2008) as there is an extensive proliferation of PASMCs responsible for pulmonary vascular remodelling (Dimauro et al., 2012) and altered lipid metabolism (Thupari et al., 2001; Menendez and Lupu, 2007). Previous studies have also shown that hypoxia acts as stimulant for the proliferation of PASMCs (Cooper and Beasley, 1999; Kadowaki et al., 2007). Herein, we showed that the expression and activity of FAS, an enzyme important for fatty acid synthesis, were increased in proliferating hypoxic HPASMCs and lungs of pulmonary hypertensive rats. In proliferating cancer cells, increased FAS activity and expression have also been reported, and pharmacological inhibition of FAS decreased the proliferation of cells (Lee et al., 2009; Do et al., 2013; Veigel et al., 2015). Similar results were found in our study where inhibition of FAS reduced the cell proliferation in hypoxic HPASMCs. However, the reaction catalysed by FAS results in the conversion of malonyl CoA into palmitate. Following hypoxia, there was a decrease in the level of malonyl CoA and increase in the level of palmitate indicating increased FAS activity in our study. Inhibition of FAS resulted in increased malonyl CoA and decreased palmitate. Furthermore, hypoxia led to increased CPT‐1 expression, an enzyme responsible for the transport of FFA to mitochondria for β oxidation (Kantor et al., 2000), and FAS inhibition decreased its expression. Malonyl CoA may be causing this decrease in CPT‐1 expression. In cancerous cells, like the results of our study, inhibition of FAS increased the level of malonyl CoA (Thupari et al., 2001), which is known to inhibit CPT‐1 expression (Flavin et al., 2010).
Increased glucose uptake and glycolysis are the characteristic features of metabolic dysfunction occurring in pulmonary vasculature in PH (Pastorino et al., 2005; Xu et al., 2007). Increased pGSK3β/GSK3β and hexokinase 2 in hypoxic HPASMCs, as in our study, indicated an increased glycolysis (Zamzami and Kroemer, 2001; Sutendra et al., 2010), which was significantly attenuated by inhibition of FAS. This finding is supported by the study of Bhatt et al. (2012), who showed that inhibition of FAS decreased the glycolytic flux in non‐Hodgkin lymphoma (Bhatt et al., 2012). In our study, there was decreased expression and activity of PDH, an enzyme that promotes the coupling of GLY to GO, which further indicates the decreased GO (Sutendra et al., 2010). FAS inhibition significantly increased the activity and expression of PDH. Various studies had shown that reversal of PDH inhibition abolished the glycolytic shift and attenuated the PH (Michelakis et al., 2002; McMurtry et al., 2004; Guignabert et al., 2009).
Metabolic dysfunction is associated with IR, and there are several reports of the existence of IR like conditions (activated AMPK and decreased Akt) in HPASMCs in pulmonary vessels of patients and mice with PH (Zamanian et al., 2009; West et al., 2013) and AMPK inhibition has been found to be beneficial in PH (Ibe et al., 2013). Herein, we showed that the expression of IR markers was altered as there was an increase in pAMPK and decrease in pAkt and PPARγ in hypoxic HPASMCs. Previous reports have suggested that PPARγ also reduces vascular SMC proliferation and migration (Law et al., 2000) and decreased expression of PPARγ has been found in human PAH and in several experimental models of PH (Ameshima et al., 2003; Tian et al., 2009). In the present studies, these IR‐like conditions were improved by FAS inhibition as it decreased the expression of AMPK and increased that of Akt and PPARγ.
Increased HIF‐1α expression, due to the prevailing hypoxic conditions, also contributes to the pathophysiology of PH, because it regulates a number of genes involved in cell proliferation, DNA repair, metabolism (Bandyopadhyay et al., 2005), mitochondrial function and ROS production in remodelled pulmonary vasculature (McMurtry et al., 2004; Cottrill and Chan, 2013). There was increased HIF‐1α expression in hypoxic HPASMCs, which was inhibited following FAS inhibition in our study. HIF‐1α inhibition is protective, as acriflavin and digoxin, which inhibit HIF‐1α translation, prevent the development of hypoxic PH in mice (McGrath et al., 2010). Decreased expression of HIF‐1α following FAS inhibition may also have contributed to the increased PDH expression and activity in our study because HIF‐1α activates PDH kinase, an enzyme responsible for degradation of PDH (Kim et al., 2006).
Mitochondria are the metabolic sensors of the cell and, as such, determine both ATP production and apoptosis (Dromparis and Michelakis, 2013). A disturbance in mitochondrial ROS generation and energy production are the hallmarks of PH (Pak et al., 2013). Hypoxic exposure induced mitochondrial hyperpolarization and a decrease in mROS in our studies. Previous studies have reported similar findings in response to hypoxia; normal PASMCs that show mitochondrial hyperpolarization and decreased mROS would result in vasocontraction (Weir et al., 2005; Sutendra et al., 2010). FAS inhibition elevated the mROS up to the normal level indicating improved mitochondrial functions. Furthermore, an improved mitochondrial function was indicated by the increased ATP level following FAS inhibition. Another feature of mitochondrial impairment is the hyperpolarization of mitochondrial membrane. In our study, FAS inhibition restored the mitochondrial membrane potential, as indicated by the JC‐1 experiment, and increased the translocation of AIF and cytochrome c from mitochondria indicating the induction of apoptosis. These in vivo results were also supported by the results of the in vitro studies in which there was an increased expression of the anti‐apoptotic gene Bcl2 and decreased expression of pro‐apoptotic gene Bax in proliferating HPASMCs, and these effects were significantly reversed by FAS inhibition. Other studies have also shown that inhibition of FAS activity results in increased apoptosis of cancer cells (Kuhajda et al., 1994; Kuhajda, 2000; Do et al., 2013).
Like apoptosis, another phenomena that regulates cell survival is autophagy. Studies by Lee et al. (2011) and Long et al. (2013) showed an increased autophagy in lungs of mice exposed to chronic hypoxia and patients with PH (Lee et al., 2011). Further, palmitate, the product of FAS, has been shown to induce autophagy (Chen et al., 2013; Veigel et al., 2015). Therefore, role of FAS in autophagy was explored in our study. We found that autophagy was increased in our experiments, as evident by decreased expression of p‐mTOR and p62 and by increased expression of LC3BII/I. The involvement of FAS in autophagy was demonstrated by the finding that FAS inhibition increased the expression of p‐mTOR and p62 and decreased LC3BII/I expression indicating the reversal of autophagy. Autophagy inhibition was beneficial in PH because it was found to decrease the proliferation and increase the apoptosis in PASMCs (Long et al., 2013).
To confirm the role of FAS in IR, apoptosis and autophagy, separate experiments with palmitate, which is the product of the reaction catalysed by FAS, were carried out. Treatment of normal HPASMCs with palmitate resulted in up‐regulation of markers of IR and autophagy and a down‐regulation of apoptosis. These results are also coroborated by findings in other studies as well (Hoehn et al., 2008; Chen et al., 2013; Veigel et al., 2015). These findings indicate that FAS modulates these cellular pathways.
Pulmonary vascular remodelling, which includes thickening of pulmonary vasculature, plays an important role in PH (Kaur et al., 2015b). Histopathological studies of lungs of MCT‐treated rats showed pulmonary vascular remodelling in our study. FAS also plays an important role in cell proliferation (Do et al., 2013; Veigel et al., 2015), which may be responsible for pulmonary vascular remodelling. In our study, inhibition of FAS significantly attenuated pulmonary vascular remodeling, as found previously, suggesting that inhibition of FAS decreased proliferation in cancer cells (Lee et al., 2009; Do et al., 2013; Veigel et al., 2015). Following pulmonary vascular remodelling in the lungs, there is an increase in RVP, leading to RVH and right heart failure, an important event in the pathogenesis of PH (Dimauro et al., 2012). In our study, there was an increase in RVP in pulmonary hypertensive rats, which was significantly reversed by FAS inhibition. The therapeutic treatment of rats with FAS inhibitors also reduced the RVP, proving the therapeutic value of FAS inhibition. In our study, we also found cardiac hypertrophy markers were decreased following both preventive and therapeutic FAS inhibition in MCT‐induced PH.
Endothelium have an important role in maintaining the vascular tone, and endothelium dysfunction in pulmonary vasculature is one of the hallmarks characteristic of PH (Cottrill and Chan, 2013). We found that the acetylcholine‐induced relaxation was impaired in pulmonary vessels isolated from MCT‐treated rats, and FAS inhibition by C75 improved endothelial dysfunction in isolated pulmonary artery. This improvement in endothelial function seems to be due to the decreased level of FFA following FAS inhibition, as observed in our experiments, because previous studies have shown that FFA caused endothelial dysfunction in aorta (Law et al., 2000; Ameshima et al., 2003). Also, there was reduced expression of eNOS in lungs of MCT‐challenged rats, which is in line with results from clinical studies (Do et al., 2013; Tian et al., 2009). Inhibition of FAS increased the expression of p‐eNOS in lungs indicating improved endothelial function. This increased expression of p‐eNOS is one of the factors responsible for the improvement in endothelial function following FAS inhibition because NO donors and overexpression of eNOS have been found to attenuate PH (Cottrill and Chan, 2013). Interestingly, FAS inhibition also improved oxygen saturation further demonstrating the protective effect induced by modulating FAS activity.
In conclusion, the results of the present study revealed that FAS is activated in proliferating HPASMCs and MCT‐treated lungs, and this induces pulmonary vascular remodelling, proliferation, apoptosis, metabolic and mitochondrial dysfunction (Figure 10). Inhibition of FAS, both preventive and therapeutic, decreased the pulmonary vascular remodelling and RVP. A number of studies have already revealed the involvement of FAS in proliferating cancer cells, and its inhibition is beneficial in cancer. Furthermore, a clinically used FAS inhibitor, orlistat, has been shown to have antitumour activity. Therefore, because PH shares its pathophysiology with cancer, these findings open up a new avenue where FAS inhibition can be used as a therapeutic target in PH.
Figure 10.
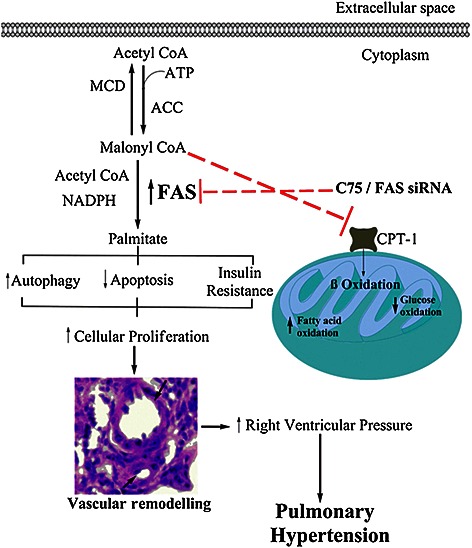
Proposed model of involvement of FAS in pathophysiology of PH. Elevated FAS activity increases level of free fatty acid, that is, palmitate, which leads to insulin resistance like condition in lungs during PH. As a result, AMPK activation and Akt inhibition suppresses the mTOR, which increases the autophagy. There is a decrease in the apoptosis also resulting in pulmonary vascular remodelling in PH. Inhibition of FAS decreased palmitate level and, on the other hand, increased level of malonyl CoA, which inhibits CPT‐1, responsible for fatty acid oxidation. ACC, acetyl CoA carboxylase. Inhibition is shown by red dotted lines ( ).
).
Author contributions
N.S. and A.M. participated in the design of the study, performed the experiments, did the statistical analysis and were involved in writing the manuscript. G.K. participated in the design of the study and in the statistical analysis. K.J. participated in the design of the study, drafting and writing of the manuscript. K.H., the corresponding author, participated in the design of the study and drafting and writing of the manuscript. All authors read and approved the final manuscript.
Conflict of interest
The authors declare no conflicts of interest.
Declaration of transparency and scientific rigour
This Declaration acknowledges that this paper adheres to the principles for transparent reporting and scientific rigour of preclinical research recommended by funding agencies, publishers and other organizations engaged with supporting research.
Supporting information
To validate the involvement of FAS on apoptosis and autophagy, palmitate experiments data were added. In addition, effect of FAS inhibition on apoptosis (TUNEL studies) and autophagy marker p62 in MCT‐treated rats were additionally added.
Table S1 Effect of C75 treatment on hemodynamic parameters in MCT treated rats.
Figure S1 Effect of 24 hour palmitate treatment (500 μM) on insulin resistance markers in normal HPASMCs. The representative western blot and quantification of pAMPK/AMPK and pAkt/Akt ratio in primary cultures of HPASMCs. (n=5 in each condition). *P<.05 vs. control.
Figure S2 Effect of 24 hour Palmitate treatment (500 μM) on autophagy markers in normal HPASMCs. A: Quantification of p62/actin and a representative western blot (n=5); B: representative picture of immunocytochemistry of autophagy marker p62 (n=3); C: quantification of LC3BII/LC3BI and a representative western blot (n=5). *P<0.05 vs. control.
Figure S3 Effect of 24 hour Palmitate treatment (500 μM) on apoptosis markers in normal HPASMCs. A‐ C: The representative western blot and quantification of BCl2/actin, Bax/actin and cleaved caspase3/actin ratio in primary cultures of HPASMCs. (n=5 in each condition). *P<0.05 vs. control.
Figure S4 Treatment with C75 increases the apoptosis in lung tissue of MCT treated rats. Representative TUNEL pictures and quantitative analysis of apoptotic cells expressed as a number of TUNEL positive cells per 0.5 mm2. (n=6). + P<0.05 vs. control, *P<0.05 vs. MCT.
Figure S5 Inhibition of FAS decreases autophagy. Representative picture of immunohistochemistry of autophagy marker p62 in lung tissue (n=6).
Supporting info item
Acknowledgements
This work was supported by financial grants of the Council of Scientific and Industrial Research (CSIR), CSIR network programs THUNDER (BSC0102), UNDO (BSC0103), New Delhi, India and Ramalingaswamy Fellowship (DBT, Govt. of India).
Singh, N. , Manhas, A. , Kaur, G. , Jagavelu, K. , and Hanif, K. (2016) Inhibition of fatty acid synthase is protective in pulmonary hypertension. British Journal of Pharmacology, 173: 2030–2045. doi: 10.1111/bph.13495.
References
- Alexander SPH, Kelly E, Marrion N, Peters JA, Benson HE, Faccenda E et al. (2015a). The Concise Guide to PHARMACOLOGY 2015/16: Overview. Br J Pharmacol 172: 5729–5143. [DOI] [PMC free article] [PubMed] [Google Scholar]
- Alexander SPH, Cidlowski JA, Kelly E, Marrion N, Peters JA, Benson HE et al. (2015b). The Concise Guide to PHARMACOLOGY 2015/16: Nuclear hormone receptors. Br J Pharmacol 172: 5956–5978. [DOI] [PMC free article] [PubMed] [Google Scholar]
- Alexander SPH, Fabbro D, Kelly E, Marrion N, Peters JA, Benson HE et al. (2015c). The Concise Guide to PHARMACOLOGY 2015/16: Enzymes. Br J Pharmacol 172: 6024–6109. [DOI] [PMC free article] [PubMed] [Google Scholar]
- Alexander SPH, Kelly E, Marrion N, Peters JA, Benson HE, Faccenda E et al. (2015d). The Concise Guide to PHARMACOLOGY 2015/16: Transporters. Br J Pharmacol 172: 6110–6202. [DOI] [PMC free article] [PubMed] [Google Scholar]
- Ameshima S, Golpon H, Cool CD, Chan D, Vandivier RW, Gardai SJ et al. (2003). Peroxisome proliferator‐activated receptor gamma (PPARgamma) expression is decreased in pulmonary hypertension and affects endothelial cell growth. Circ Res 92: 1162–1169. [DOI] [PubMed] [Google Scholar]
- Bandyopadhyay S, Pai SK, Watabe M, Gross SC, Hirota S, Hosobe S et al. (2005). FAS expression inversely correlates with PTEN level in prostate cancer and a PI 3‐kinase inhibitor synergizes with FAS siRNA to induce apoptosis. Oncogene 24: 5389–5395. [DOI] [PubMed] [Google Scholar]
- Bandyopadhyay S, Zhan R, Wang Y, Pai SK, Hirota S, Hosobe S et al. (2006). Mechanism of apoptosis induced by the inhibition of fatty acid synthase in breast cancer cells. Cancer Res 66: 5934–5940. [DOI] [PubMed] [Google Scholar]
- Bhatt AP, Jacobs SR, Freemerman AJ, Makowski L, Rathmell JC, Dittmer DP et al. (2012). Dysregulation of fatty acid synthesis and glycolysis in non‐Hodgkin lymphoma. Proc Natl Acad Sci U S A 109: 11818–11823. [DOI] [PMC free article] [PubMed] [Google Scholar]
- Chen YY, Sun LQ, Wang BA, Zou XM, Mu YM, Lu JM (2013). Palmitate induces autophagy in pancreatic beta‐cells via endoplasmic reticulum stress and its downstream JNK pathway. Int J Mol Med 32: 1401–1406. [DOI] [PubMed] [Google Scholar]
- Cooper AL, Beasley D (1999). Hypoxia stimulates proliferation and interleukin‐1alpha production in human vascular smooth muscle cells. Am J Physiol 277: H1326–H1337. [DOI] [PubMed] [Google Scholar]
- Cottrill KA, Chan SY (2013). Metabolic dysfunction in pulmonary hypertension: the expanding relevance of the Warburg effect. Eur J Clin Invest 43: 855–865. [DOI] [PMC free article] [PubMed] [Google Scholar]
- Curtis MJ, Bond RA, Spina D, Ahluwalia A, Alexander SP, Giembycz MA et al. (2015). Experimental design and analysis and their reporting: new guidance for publication in BJP. Br J Pharmacol 172: 3461–3471. [DOI] [PMC free article] [PubMed] [Google Scholar]
- Dimauro I, Pearson T, Caporossi D, Jackson MJ (2012). A simple protocol for the subcellular fractionation of skeletal muscle cells and tissue. BMC Res Notes 5: 513. [DOI] [PMC free article] [PubMed] [Google Scholar]
- Do MT, Hwang YP, Kim HG, Na M, Jeong HG (2013). Mollugin inhibits proliferation and induces apoptosis by suppressing fatty acid synthase in HER2‐overexpressing cancer cells. J Cell Physiol 228: 1087–1097. [DOI] [PubMed] [Google Scholar]
- Dromparis P, Michelakis ED (2013). Mitochondria in vascular health and disease. Annu Rev Physiol 75: 95–126. [DOI] [PubMed] [Google Scholar]
- Dromparis P, Sutendra G, Michelakis ED (2010). The role of mitochondria in pulmonary vascular remodeling. J Mol Med (Berl) 88: 1003–1010. [DOI] [PubMed] [Google Scholar]
- Engeland M, van den Eijnde SM, Aken T, Vermeij‐Keers C, Ramaekers FC, Schutte B et al. (2001). Detection of apoptosis in ovarian cells in vitro and in vivo using the annexin v‐affinity assay. Methods Mol Med 39: 669–677. [DOI] [PubMed] [Google Scholar]
- Fang YH, Piao L, Hong Z, Toth PT, Marsboom G, Bache‐Wiig P et al. (2012). Therapeutic inhibition of fatty acid oxidation in right ventricular hypertrophy: exploiting Randle's cycle. J Mol Med (Berl) 90: 31–43. [DOI] [PMC free article] [PubMed] [Google Scholar]
- Flavin R, Peluso S, Nguyen PL, Loda M (2010). Fatty acid synthase as a potential therapeutic target in cancer. Future Oncol 6: 551–562. [DOI] [PMC free article] [PubMed] [Google Scholar]
- Gabrielson EW, Pinn ML, Testa JR, Kuhajda FP (2001). Increased fatty acid synthase is a therapeutic target in mesothelioma. Clin Cancer Res 7: 153–157. [PubMed] [Google Scholar]
- Guignabert C, Tu L, Izikki M, Dewachter L, Zadigue P, Humbert M et al. (2009). Dichloroacetate treatment partially regresses established pulmonary hypertension in mice with SM22alpha‐targeted overexpression of the serotonin transporter. FASEB J 23: 4135–4147. [DOI] [PubMed] [Google Scholar]
- Hoehn KL, Hohnen‐Behrens C, Cederberg A, Wu LE, Turner N, Yuasa T et al. (2008). IRS1‐independent defects define major nodes of insulin resistance. Cell Metab 7: 421–433. [DOI] [PMC free article] [PubMed] [Google Scholar]
- Ibe JC, Zhou Q, Chen T, Tang H, Yuan JX, Raj JU et al. (2013). Adenosine monophosphate‐activated protein kinase is required for pulmonary artery smooth muscle cell survival and the development of hypoxic pulmonary hypertension. Am J Respir Cell Mol Biol 49: 609–618. [DOI] [PMC free article] [PubMed] [Google Scholar]
- Jin Y, Choi AM (2012). Cross talk between autophagy and apoptosis in pulmonary hypertension. Pulm Circ 2: 407–414. [DOI] [PMC free article] [PubMed] [Google Scholar]
- Kadowaki M, Mizuno S, Demura Y, Ameshima S, Miyamori I, Ishizaki T (2007). Effect of hypoxia and beraprost sodium on human pulmonary arterial smooth muscle cell proliferation: the role of p27kip1. Respir Res 8: 77. [DOI] [PMC free article] [PubMed] [Google Scholar]
- Kantor PF, Lucien A, Kozak R, Lopaschuk GD (2000). The antianginal drug trimetazidine shifts cardiac energy metabolism from fatty acid oxidation to glucose oxidation by inhibiting mitochondrial long‐chain 3‐ketoacyl coenzyme A thiolase. Circ Res 86: 580–588. [DOI] [PubMed] [Google Scholar]
- Kaur G, Singh N, Lingeshwar P, Siddiqui HH, Hanif K (2015a). Poly (ADP‐ribose) polymerase‐1: an emerging target in right ventricle dysfunction associated with pulmonary hypertension. Pulm Pharmacol Ther 30: 66–79. [DOI] [PubMed] [Google Scholar]
- Kaur G, Singh N, Samuel SS, Bora HK, Sharma S, Pachauri SD et al. (2015b). Withania somnifera shows a protective effect in monocrotaline‐induced pulmonary hypertension. Pharm Biol 53: 147–157. [DOI] [PubMed] [Google Scholar]
- Kilkenny C, Browne W, Cuthill IC, Emerson M, Altman DG (2010). Animal research: reporting in vivo experiments: the ARRIVE guidelines. Br J Pharmacol 160: 1577–1579. [DOI] [PMC free article] [PubMed] [Google Scholar]
- Kim JW, Tchernyshyov I, Semenza GL, Dang CV (2006). HIF‐1‐mediated expression of pyruvate dehydrogenase kinase: a metabolic switch required for cellular adaptation to hypoxia. Cell Metab 3: 177–185. [DOI] [PubMed] [Google Scholar]
- Knowles LM, Yang C, Osterman A, Smith JW (2008). Inhibition of fatty‐acid synthase induces caspase‐8‐mediated tumor cell apoptosis by up‐regulating DDIT4. J Biol Chem 283: 31378–31384. [DOI] [PMC free article] [PubMed] [Google Scholar]
- Komiya K, Uchida T, Ueno T, Koike M, Abe H, Hirose T et al. (2010). Free fatty acids stimulate autophagy in pancreatic beta‐cells via JNK pathway. Biochem Biophys Res Commun 401: 561–567. [DOI] [PubMed] [Google Scholar]
- Kuhajda FP (2000). Fatty‐acid synthase and human cancer: new perspectives on its role in tumor biology. Nutrition 16: 202–208. [DOI] [PubMed] [Google Scholar]
- Kuhajda FP, Jenner K, Wood FD, Hennigar RA, Jacobs LB, Dick JD et al. (1994). Fatty‐acid synthesis – a potential selective target for antineoplastic therapy. Proc Natl Acad Sci U S A 91: 6379–6383. [DOI] [PMC free article] [PubMed] [Google Scholar]
- Law RE, Goetze S, Xi XP, Jackson S, Kawano Y, Demer L et al. (2000). Expression and function of PPARgamma in rat and human vascular smooth muscle cells. Circulation 101: 1311–1318. [DOI] [PubMed] [Google Scholar]
- Lee JS, Lee MS, Oh WK, Sul JY (2009). Fatty acid synthase inhibition by amentoflavone induces apoptosis and antiproliferation in human breast cancer cells. Biol Pharm Bull 32: 1427–1432. [DOI] [PubMed] [Google Scholar]
- Lee SJ, Smith A, Guo L, Alastalo TP, Li M, Sawada H et al. (2011). Autophagic protein LC3B confers resistance against hypoxia‐induced pulmonary hypertension. Am J Respir Crit Care Med 183: 649–658. [DOI] [PMC free article] [PubMed] [Google Scholar]
- Li J, Dong L, Wei D, Wang X, Zhang S, Li H (2014). Fatty acid synthase mediates the epithelial‐mesenchymal transition of breast cancer cells. Int J Biol Sci 10: 171–180. [DOI] [PMC free article] [PubMed] [Google Scholar]
- Liu H, Wu X, Dong Z, Luo Z, Zhao Z, Xu Y et al. (2013). Fatty acid synthase causes drug resistance by inhibiting TNF‐alpha and ceramide production. J Lipid Res 54: 776–785. [DOI] [PMC free article] [PubMed] [Google Scholar]
- Long L, Yang X, Southwood M, Lu J, Marciniak SJ, Dunmore BJ et al. (2013). Chloroquine prevents progression of experimental pulmonary hypertension via inhibition of autophagy and lysosomal bone morphogenetic protein type II receptor degradation. Circ Res 112: 1159–1170. [DOI] [PubMed] [Google Scholar]
- McGrath JC, Drummond GB, McLachlan EM, Kilkenny C, Wainwright CL (2010). Guidelines for reporting experiments involving animals: the ARRIVE guidelines. Br J Pharmacol 160: 1573–1576. [DOI] [PMC free article] [PubMed] [Google Scholar]
- McGrath JC, Lilley E (2015). Implementing guidelines on reporting research using animals (ARRIVE etc.): new requirements for publication in BJP. Br J Pharmacol 172: 3189–3193. [DOI] [PMC free article] [PubMed] [Google Scholar]
- McMurtry MS, Bonnet S, Wu X, Dyck JR, Haromy A, Hashimoto K et al. (2004). Dichloroacetate prevents and reverses pulmonary hypertension by inducing pulmonary artery smooth muscle cell apoptosis. Circ Res 95: 830–840. [DOI] [PubMed] [Google Scholar]
- Menendez JA, Lupu R (2007). Fatty acid synthase and the lipogenic phenotype in cancer pathogenesis. Nat Rev Cancer 7: 763–777. [DOI] [PubMed] [Google Scholar]
- Michelakis ED, McMurtry MS, Wu XC, Dyck JR, Moudgil R, Hopkins TA et al. (2002). Dichloroacetate, a metabolic modulator, prevents and reverses chronic hypoxic pulmonary hypertension in rats: role of increased expression and activity of voltage‐gated potassium channels. Circulation 105: 244–250. [DOI] [PubMed] [Google Scholar]
- Mukhopadhyay P, Rajesh M, Yoshihiro K, Hasko G, Pacher P (2007). Simple quantitative detection of mitochondrial superoxide production in live cells. Biochem Biophys Res Commun 358: 203–208. [DOI] [PMC free article] [PubMed] [Google Scholar]
- Orita H, Coulter J, Tully E, Kuhajda FP, Gabrielson E (2008). Inhibiting fatty acid synthase for chemoprevention of chemically induced lung tumors. Clin Cancer Res 14: 2458–2464. [DOI] [PubMed] [Google Scholar]
- Pak O, Sommer N, Hoeres T, Bakr A, Waisbrod S, Sydykov A et al. (2013). Mitochondrial hyperpolarization in pulmonary vascular remodeling. Mitochondrial uncoupling protein deficiency as disease model. Am J Respir Cell Mol Biol 49: 358–367. [DOI] [PubMed] [Google Scholar]
- Pastorino JG, Hoek JB, Shulga N (2005). Activation of glycogen synthase kinase 3beta disrupts the binding of hexokinase II to mitochondria by phosphorylating voltage‐dependent anion channel and potentiates chemotherapy‐induced cytotoxicity. Cancer Res 65: 10545–10554. [DOI] [PubMed] [Google Scholar]
- Pawson AJ, Sharman JL, Benson HE, Faccenda E, Alexander SP, Buneman OP et al. (2014). The IUPHAR/BPS guide to PHARMACOLOGY: an expert‐driven knowledge base of drug targets and their ligands. Nucleic Acids Res 42: D1098–D1106. [DOI] [PMC free article] [PubMed] [Google Scholar]
- Rai PR, Cool CD, King JA, Stevens T, Burns N, Winn RA et al. (2008). The cancer paradigm of severe pulmonary arterial hypertension. Am J Respir Crit Care Med 178: 558–564. [DOI] [PMC free article] [PubMed] [Google Scholar]
- Sutendra G, Bonnet S, Rochefort G, Haromy A, Folmes KD, Lopaschuk GD et al. (2010). Fatty acid oxidation and malonyl‐CoA decarboxylase in the vascular remodeling of pulmonary hypertension. Sci Transl Med 2 : 44ra58. [DOI] [PubMed] [Google Scholar]
- Tan SH, Shui G, Zhou J, Li JJ, Bay BH, Wenk MR et al. (2012). Induction of autophagy by palmitic acid via protein kinase C‐mediated signaling pathway independent of mTOR (mammalian target of rapamycin). J Biol Chem 287: 14364–14376. [DOI] [PMC free article] [PubMed] [Google Scholar]
- Thupari JN, Pinn ML, Kuhajda FP (2001). Fatty acid synthase inhibition in human breast cancer cells leads to malonyl‐CoA‐induced inhibition of fatty acid oxidation and cytotoxicity. Biochem Biophys Res Commun 285: 217–223. [DOI] [PubMed] [Google Scholar]
- Tian J, Smith A, Nechtman J, Podolsky R, Aggarwal S, Snead C et al. (2009). Effect of PPARgamma inhibition on pulmonary endothelial cell gene expression: gene profiling in pulmonary hypertension. Physiol Genomics 40: 48–60. [DOI] [PMC free article] [PubMed] [Google Scholar]
- Tuder RM, Davis LA, Graham BB (2012). Targeting energetic metabolism: a new frontier in the pathogenesis and treatment of pulmonary hypertension. Am J Respir Crit Care Med 185: 260–266. [DOI] [PMC free article] [PubMed] [Google Scholar]
- Van de Sande T, Roskams T, Lerut E, Joniau S, Van Poppel H, Verhoeven G et al. (2005). High‐level expression of fatty acid synthase in human prostate cancer tissues is linked to activation and nuclear localization of Akt/PKB. J Pathol 206: 214–219. [DOI] [PubMed] [Google Scholar]
- Veigel D, Wagner R, Stubiger G, Wuczkowski M, Filipits M, Horvat R et al. (2015). Fatty acid synthase is a metabolic marker of cell proliferation rather than malignancy in ovarian cancer and its precursor cells. Int J Cancer 136: 2078–2090. [DOI] [PubMed] [Google Scholar]
- Voelkel NF, Cool C, Lee SD, Wright L, Geraci MW, Tuder RM (1998). Primary pulmonary hypertension between inflammation and cancer. Chest 114: 225S–230S. [DOI] [PubMed] [Google Scholar]
- Weir EK, Lopez‐Barneo J, Buckler KJ, Archer SL (2005). Acute oxygen‐sensing mechanisms. N Engl J Med 353: 2042–2055. [DOI] [PMC free article] [PubMed] [Google Scholar]
- West J, Niswender KD, Johnson JA, Pugh ME, Gleaves L, Fessel JP et al. (2013). A potential role for insulin resistance in experimental pulmonary hypertension. Eur Respir J 41: 861–871. [DOI] [PMC free article] [PubMed] [Google Scholar]
- Xu W, Koeck T, Lara AR, Neumann D, DiFilippo FP, Koo M et al. (2007). Alterations of cellular bioenergetics in pulmonary artery endothelial cells. Proc Natl Acad Sci U S A 104: 1342–1347. [DOI] [PMC free article] [PubMed] [Google Scholar]
- Zamanian RT, Hansmann G, Snook S, Lilienfeld D, Rappaport KM, Reaven GM et al. (2009). Insulin resistance in pulmonary arterial hypertension. Eur Respir J 33: 318–324. [DOI] [PMC free article] [PubMed] [Google Scholar]
- Zamzami N, Kroemer G (2001). The mitochondrion in apoptosis: how Pandora's box opens. Nat Rev Mol Cell Biol 2: 67–71. [DOI] [PubMed] [Google Scholar]
Associated Data
This section collects any data citations, data availability statements, or supplementary materials included in this article.
Supplementary Materials
To validate the involvement of FAS on apoptosis and autophagy, palmitate experiments data were added. In addition, effect of FAS inhibition on apoptosis (TUNEL studies) and autophagy marker p62 in MCT‐treated rats were additionally added.
Table S1 Effect of C75 treatment on hemodynamic parameters in MCT treated rats.
Figure S1 Effect of 24 hour palmitate treatment (500 μM) on insulin resistance markers in normal HPASMCs. The representative western blot and quantification of pAMPK/AMPK and pAkt/Akt ratio in primary cultures of HPASMCs. (n=5 in each condition). *P<.05 vs. control.
Figure S2 Effect of 24 hour Palmitate treatment (500 μM) on autophagy markers in normal HPASMCs. A: Quantification of p62/actin and a representative western blot (n=5); B: representative picture of immunocytochemistry of autophagy marker p62 (n=3); C: quantification of LC3BII/LC3BI and a representative western blot (n=5). *P<0.05 vs. control.
Figure S3 Effect of 24 hour Palmitate treatment (500 μM) on apoptosis markers in normal HPASMCs. A‐ C: The representative western blot and quantification of BCl2/actin, Bax/actin and cleaved caspase3/actin ratio in primary cultures of HPASMCs. (n=5 in each condition). *P<0.05 vs. control.
Figure S4 Treatment with C75 increases the apoptosis in lung tissue of MCT treated rats. Representative TUNEL pictures and quantitative analysis of apoptotic cells expressed as a number of TUNEL positive cells per 0.5 mm2. (n=6). + P<0.05 vs. control, *P<0.05 vs. MCT.
Figure S5 Inhibition of FAS decreases autophagy. Representative picture of immunohistochemistry of autophagy marker p62 in lung tissue (n=6).
Supporting info item