Abstract
Low back pain (LBP) is a common debilitating condition which aetiology and pathogenesis are poorly understood. We carried out a first so far analysis of associations between LBP and plasma IgG N-glycome in a sample of 4511 twins from TwinsUK database assessed for LBP, lumbar disc degeneration (LDD) as its possible cause, and IgG-glycan levels. Using weighted correlation network analysis, we established a correlation between LBP and glycan modules featured by glycans that either promote or block antibody-dependent cell-mediated cytotoxicity (ADCC). The levels of four glycan traits representing two of those modules were statistically significantly different in monozygotic twins discordant for LBP. Also, the trend to higher prevalence of systemic inflammatory disorders was shown for twins with low level of fucosylated glycans and high level of non-fucosylated glycans. Core fucosylation of IgG is a “safety switch” reducing ADCC, thus our results suggest the involvement of ADCC and associated inflammation in pathogenesis of LBP. No correlation between LDD scores and glycans was found assuming that the inflammation may not be a part of LDD. These data provide a new insight into understanding the complex pathophysiology of LBP and suggest glycan levels as a possible biomarker for inflammation-related subtypes of LBP.
Low back pain (LBP) is a common musculoskeletal condition in all ages1. The lifetime prevalence of non-specific LBP may reach 80%, with the annual prevalence ranging between 25% and 60% in different ethnic groups2,3. It is a diverse group of mixed pain syndromes with different molecular pathologies at different structural levels displaying similar clinical manifestations and radiologic findings. Why there is such huge inter-personal variability in severity of chronic LBP is yet to be clearly defined. Lumbar disk degeneration (LDD) is widely believed to be one of the major contributing factors. Nevertheless, MRI findings of disc degeneration cannot help to define clearly the pathophysiology of LBP and its prognosis4.
Even though, the development of LDD is associated with such occupational factors as heavy lifting, frequent bending and twisting5, genetic predisposition is much more important as a risk factor6.
A TwinsUK study showed genetic background as the major factor associated with LBP in women and also revealed a significant genetic correlation between LBP and LDD7. Genetic studies identified a dozen of genes associated with LDD, such as genes coding collagens, vitamin D receptor, interleukins, matrix metalloproteinases and other molecules8,9.
Large genome-wide linkage study and a genome-wide meta-analysis identified CHST3 gene associated with LDD, and a subsequent functional analysis showed the risk allele decreases the gene expression, possibly, due to the enhanced interaction with miR-513a-5p microRNA10. Also, a meta-analysis of several genome-wide association studies revealed an association between LDD and PARK gene with the differential methylation of the PARK gene promoter as a possible cause for the association11. Also, an increased methylation of SPARC gene was found to be associated with LBP and LDD in humans and mice12. These studies incur epigenetic factors in the development of LDD and LBP.
Thus, the discovery of molecular factors contributing to the predisposition to LBP and LDD and mechanisms by which these factors act is essential to facilitate the development of new biomarkers of risk and response to specific treatments. Apart from genomic and epigenomic factors, other newly established “omes” can be of value.
In particular, glycome (the entire composition of glycans) attracts attention. Glycans constitute the most abundant and diverse form of the post-translational modifications. All cell surface and secreted glycoproteins that contain appropriate sequences (Asn-X-Ser/Thr where X is any amino acid except proline) can potentially acquire N-linked oligosaccharides (N-glycans) while they travel through the endoplasmic reticulum and the Golgi compartments. Glycans can influence disease development in many syndromes such as congenital disorders of glycosylation, cancer, rheumatoid arthritis and AIDS13. Glycans are crucial for the immune system, as some of the most important interactions between the immune system and viruses and bacteria are mediated by protein-glycan interactions. The biological functions of glycans go from basic structural roles to development, protein folding and immune response.
While genes unequivocally determine the structure of each polypeptide, there is no genetic template for the glycan part. Instead, hundreds of genes and their products interact in the complex pathway of glycan biosynthesis resulting in a very complex biosynthetic pathway that is further complicated by both direct environmental influence (nutrition, hormonal status, etc) and epigenetic memory of past environmental effects (altered gene expression)14,15,16. It is possible that some of the considerable genetic predisposition to LDD may be mediated via glycans.
Immunoglobulin G (IgG) glycosylation has been well defined, and many important functional effects of alternative IgG glycosylation have been described17. Glycans that lack terminal galactose activate complement and make IgG pro-inflammatory, while the addition of galactose decreases inflammatory potential of IgG18,19. Further extension of IgG glycans by the addition of sialic acid dramatically changes the physiological role of IgG, converting it from a pro-inflammatory into an anti-inflammatory agent. Terminal α2,6-sialylation of IgG glycans decreases the ability of IgG to bind to activating FcγRs and promotes recognition by DC-SIGN, which increases expression of inhibitory FcγRIIB and is anti-inflammatory20. Another example is the role of core fucose in the modulation of antibody-dependent cellular cytotoxicity: IgG-containing glycans that lack core fucose have 100-fold increased affinity for FcγRIIIA and are therefore much more efficient in activating antibody-dependent cellular cytotoxicity than fucosylated glycoforms of the same molecule21.
In this study, we analyzed twins from TwinsUK registry, to assess whether persons reporting episodes of LBP had detectable levels of altered IgG glycosylation.
Results
The study aimed at identifying relationships between IgG glycosylation and pain. We used a cohort of twins from TwinsUK registry with established phenotypes of LBP and using a recently developed high-throughput analysis method quantified IgG glycans in their plasma specimens. After pre-processing and filtering of the data, a total of 4511 individuals were analyzed including 1215 pairs of DZ twins, 491 pairs of MZ twins, and 1099 unpaired individuals (Table 1). Low back pain status was known for 3557 individuals.
Table 1. Demographics of the studied twins.
| Trait | Value | % |
|---|---|---|
| Age ± SD | 51.8 ± 14.1 | – |
| Females/males | 4175/336 | 92.6/7.4 |
| BMI ± SD | 26.3 ± 5.0 | – |
| LBP in total sample, positive/negative/unknown | 1064/2493/954 | 23.6/55.3/21.1 |
| LBP in pairs of twins, number of pairs | ||
| MZ twins | ||
| both positive/both negative/discordant/unknown in at least one of the twins | 57/252/126/56 | 11.6/54.7/25.7/11.4 |
| DZ twins | ||
| both positive/both negative/discordant/unknown in at least one of the twins | 146/452/316/301 | 12.0/37.2/26.0/24.8 |
Analysis of association between glycan levels and LBP
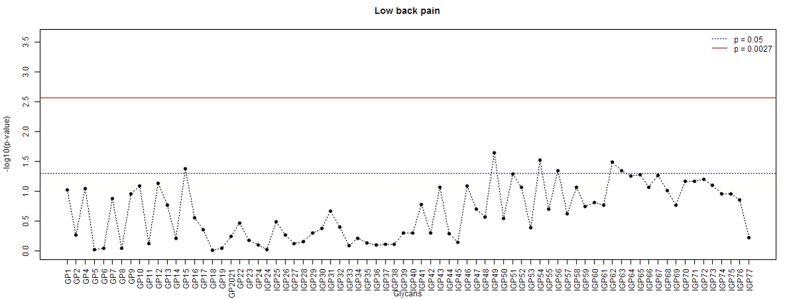
Overall, 76 directly measured or derived glycan traits were assessed for an association with LBP (Supplementary Table 1). Linear mixed model analysis with BMI, sex, inflammatory diseases and LBP status included as fixed covariate and variation in IgG glycan quantities within twin pairs as random effect revealed nominally statistically significant associations of LBP with several glycan traits with the strongest association seen for IGP49 (GP10n) (Fig. 1). However, none of the associations passed the significance threshold set to control for multiple testing (p = 0.0027). Same was true for the analysis of correlations between glycan levels and summary scores for lumbar magnetic resonance imaging signs (LSUM; Supplementary Table 2; Supplementary Figure 1).
Figure 1. P-values (−log10) for the analysis of associations between glycan levels and low back pain.
Linear mixed models were used to estimate the associations using LBP status, BMI, sex, and major inflammatory disease status as fixed factors and family status as a random factor.
WGCNA
Using the weighted correlation network analysis (WGCNA) methodology, we carried out a network analysis for glycan levels to establish clusters of correlated glycans which, possibly, reflect their functional relationships and revealed associations between these clusters and pain phenotypes.
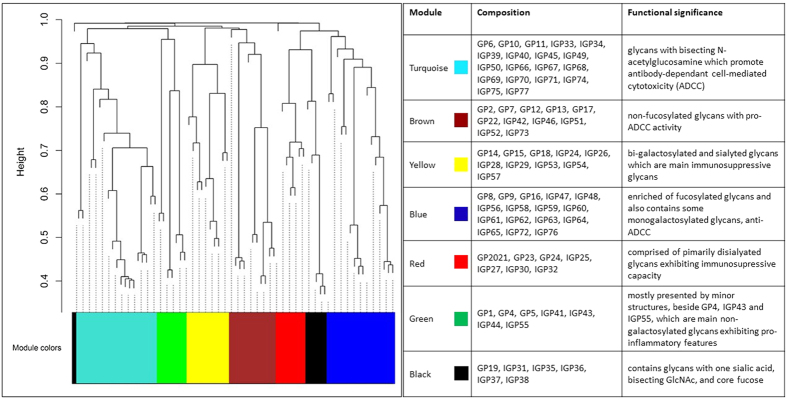
Using signed networks, we identified seven modules of correlated glycans (Fig. 2; Supplementary Table 1), which can be grouped into two big branches comprising yellow, brown and turquoise modules, from one hand, and black, green, blue and red modules, from the other hand (Fig. 3).
Figure 2. Modules of correlated glycans obtained using WGCNA methodology.
Figure 3. Relationships between modules of correlated glycans.
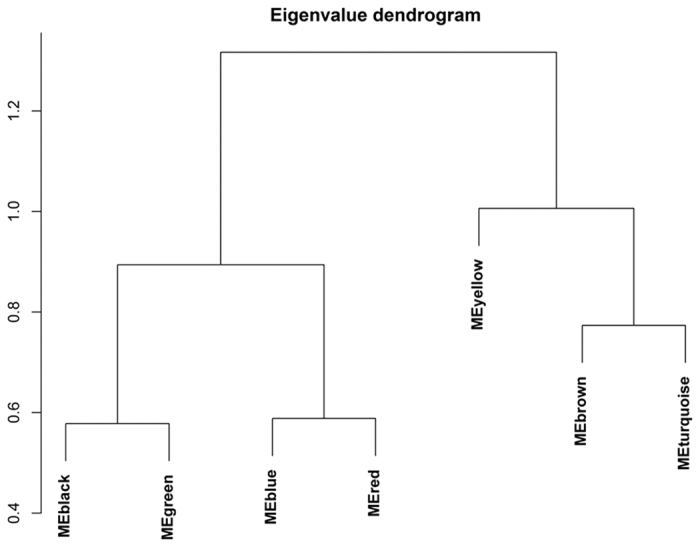
The most abundand turquoise module is comprised of glycans with bisecting N-acetylglucosamine (GlcNAc) which was reported to promote antibody-dependant cell-mediated cytotoxicity (ADCC)22. Similarly, the brown module belonging to the same branch of modules, contains non-fucosylated glycans, which also promote ADCC. The yellow module from the same branch is enriched of bi-galactosylated and sialylated glycans which are main immunosuppressive glycans.
Another branch’s biggest blue module, in opposition to the turquoise and brown modules, is enriched of fucosylated glycans, does not include glycans with bisecting GlcNAc, and also contains some monogalactosylated glycans. The red module is comprised of primarily disialyated glycans exhibiting immunosupressive capacity. The green module is mostly presented by minor structures, beside GP4, IGP43 (GP4n) and IGP55 (G0n), which are main non-galactosylated glycans exhibiting pro-inflammatory features. Finally, the black module contains glycans with one sialic acid, bisecting GlcNAc, and core fucose.
To reveal relationships between glycan modules and pain phenotypes, we carried out a correlation analysis between module eigenvalues (estimated as first principal component of glycan levels in a module) and LBP and MRI trait LSUM (Fig. 4). LBP was found to be positively correlated with turquoise and brown modules and negatively with blue module. A hint to correlation between green module and LBP was seen; however, these correlations did not reach statistical significance.
Figure 4. Correlations between module eigenvalues and pain phenotypes.
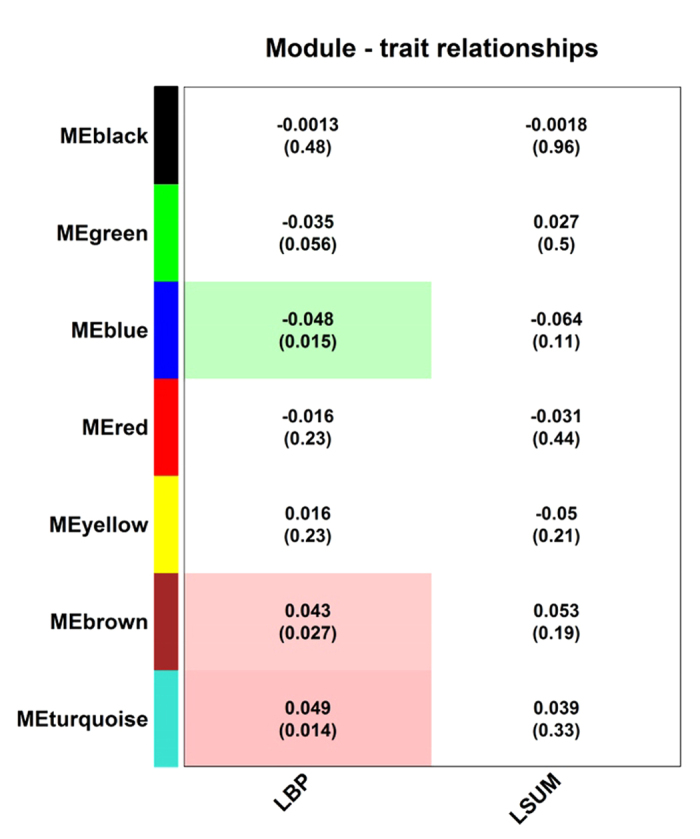
Correlations were calculated between module eigenvalues (vector of first principal component of glycans in a module) and low back pain (LBP) using point-biserial correlation coefficient and summary score for magnetic resonance imaging signs for lumbar spine (LSUM) using Pearson correlation coefficients. Corresponding p-values are provided in brackets.
Also, even though the correlation strength between glycan modules and MRI-traits was of similar magnitude as those for LBP (R = 0.04–0.05), the correlations did not reach statistical significance for MRI-traits.
Average glycan significance for this phenotype (defined as the average for the correlation coefficients between glycan levels in a module and a trait) was highest for blue and turquoise modules for LBP (Fig. 5). These results suggest that glycans from the blue and turquoise modules may be of especial interest for subsequent study of their relationships with pain phenotype.
Figure 5. Average glycan significance across modules for LBP.
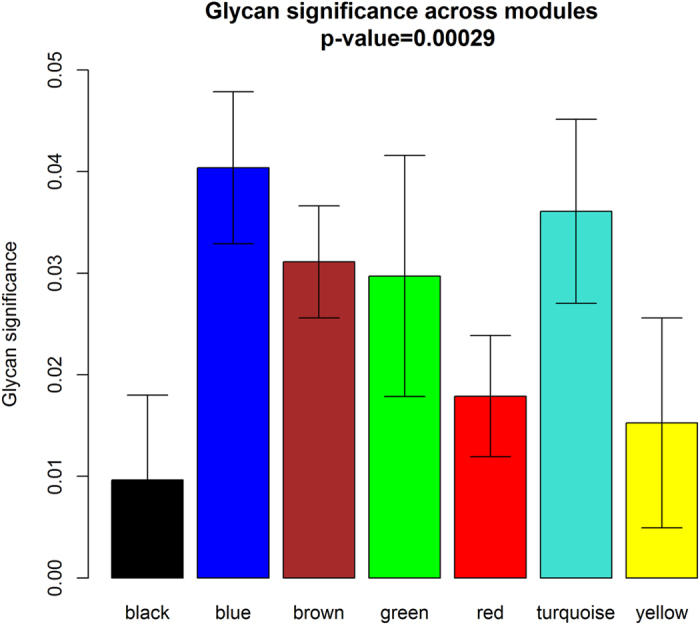
Glycan significance was defined as the average coefficient of correlation between a trait and glycan levels in a module; p-value is given for Kruskal-Wallis test for the difference of glycan significance across the modules.
Discordant twins analysis
To further analyse the relationships between glycome and pain phenotypes, we carried out comparisons of glycan levels in MZ and DZ twins discordant for LBP using paired t-test.
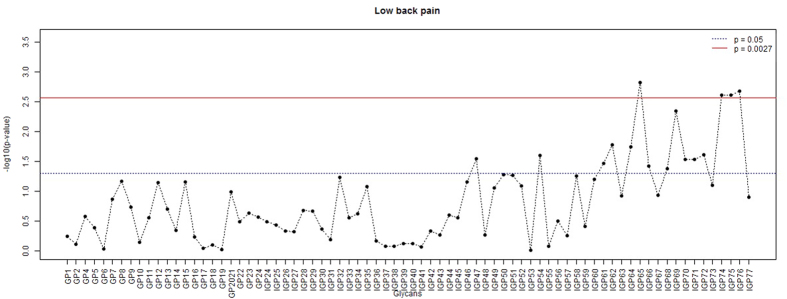
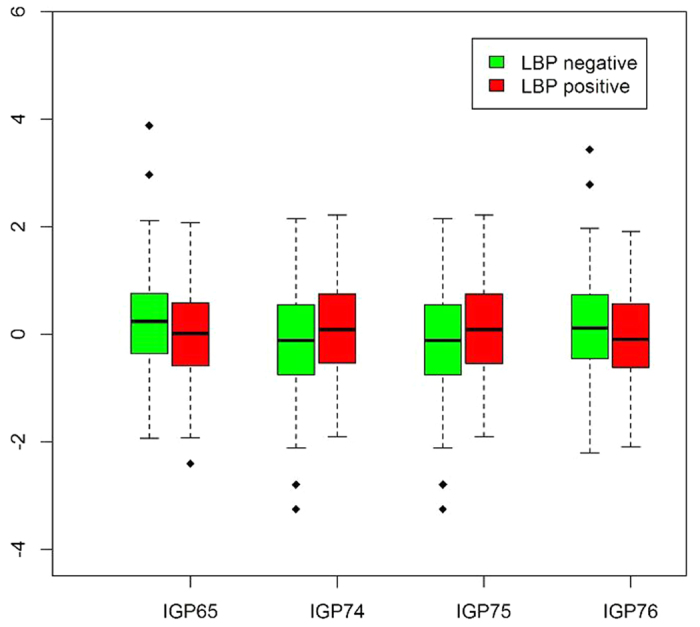
For MZ twins, we identified statistically significant differences between the twins with and without LBP for the IGP65 (FG2n/G2n), IGP74 (FBG2n/FG2n), IGP75 (FBG2n /[FG2n + FBG2n ]), and IGP76 (FG2n/[BG2n + FBG2n]) derived traits (Fig. 6; p < 0.0027). Notably, these four glycan traits belong to the blue and turquoise modules identified in the WGCNA analysis. Accordingly, IGP65 and IGP76 of the blue module were found to be elevated in MZ twins without LBP, while IGP74 and IGP75 of the turquoise module were elevated in MZ twins with LBP (Fig. 7). The four glycan traits were derived from neutral glycans GP14 and GP15, and also GP13 for IGP76, with GP14 being the numerator for IGP65 and IGP76, while GP15 the numerator for the other two (Supplementary Table 1). Intriguingly, neither GP14, nor GP15 showed any trend to association with LBP; however, there was a weak, but significant negative correlation between GP14 and LCUM values (Pearson r = −0.08, p = 0.04; Supplementary Table 2; Supplementary Figure 1).
Figure 6. P-values (−log10) for comparisons of mean glycan levels in MZ twins discordant for LBP phenotype by paired t-test.
Red line corresponds to p = 0.0027 which was taken as the significance threshold based on the 19 effective independent tests with Sidak’s correction for multiple testing.
Figure 7. Glycan levels in MZ twins discordant for LBP phenotype.
No statistical significant differences in glycan levels were found for DZ twins or MZ and DZ twins combined.
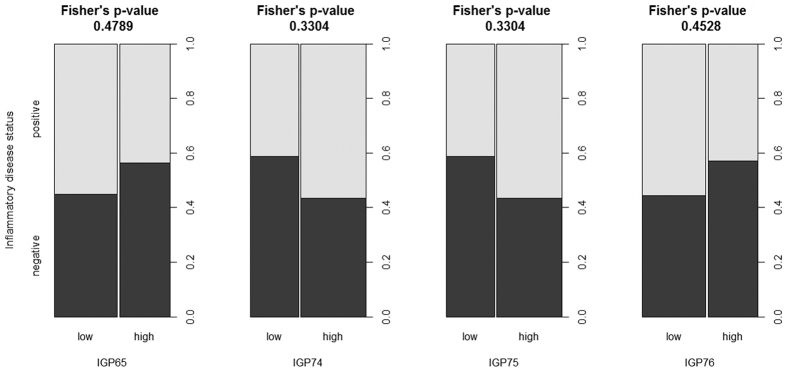
To pursue a cause for association between LBP and glycan levels in MZ twins discordant for LBP, we split them into groups of high and low level of IGP65, IGP74, IGP75, and IGP76 using 25% and 75% quintiles as the cut off points and compared the prevalence of systemic inflammatory disorders (rheumatoid arthritis, systemic lupus erythematosus, ulcerative colitis and Crohn’s disease) in these groups. We found the increase of inflammatory diseases in individuals exhibiting low levels of IGP65 and IGP76 and high levels of IGP74 and IGP75 (Fig. 8). This pattern was in full agreement with the observation of association between these glycan levels and LBP, though the differences in inflammatory disorders prevalence did not reach statistical significance (according to Fisher’s exact test p-values).
Figure 8. The prevalence of systemic inflammatory disorders (rheumatoid arthritis, systemic lupus erythematosus, ulcerative colitis, and Crohn’s disease) in twins with high and low levels of glycans and discordant for LBP.
The cut off points for glycans levels were set at 25% and 75% quintile for the corresponding distribution.
Discussion
In this study we have evaluated association between levels of plasma IgG glycans and LBP
Linear mixed-models analysis did not reveal statistically significant (p < 0.0027) associations between glycan levels and LBP. However, for several glycans nominally significant associations were obtained.
In an attempt to consider glycome as a whole, we carried out a network analysis using weighted correlation network approach (WGCNA). This is a powerful methodology for revealing clusters (modules) of multiple omic traits, such as genome-wide gene expression or global methylation profiles, and placing them into a biological context through the analysis of associations between the clusters and diseases or traits of interest23,24,25,26,27,28. To the best of our knowledge, this method has never been applied before to glycome. Even though, glycans do not interact with each other in a way of genes or proteins, the network methodology underlying WGCNA analysis still seems valuable for glycome as it allows revealing functionally related groups of glycans exhibiting overlapping biological activity.
Using WGCNA approach we revealed seven modules of glycans clustered according to their functional capabilities, with the two biggest modules (turquoise and blue) enriched with glycans with opposite potential for the development of ADCC through the regulation of core fucosylation and bisection. Fucosylation is crucial in many biological processes and inflammation in particular. On average, 95% of the IgG population is core fucosylated29; core fucose prevents activation of ADCC, thus, most of the immunoglobulins have a “safety switch”, which prevents them from killing the target cell. Malfunction of this system appears to be associated with autoimmune diseases, as indicated by both pleiotropic effects of genes that associate with IgG glycosylation on different inflammatory and autoimmune diseases, and observed alterations in IgG glycosylation in systemic lupus erythematous30,31 and many inflammatory diseases32. We observed a positive correlation between LBP and “pro-ADCC” turquoise and brown modules and a negative correlation between LBP and “anti-ADCC” blue module (Fig. 4). Assuming that the development of LBP syndrome is in part related to inflammation33 and that ADCC contributes to the joint inflammation in some types of back pain34, one could expect that the decreased levels of core fucosylation and increased levels of bisecting GlcNAc in IgG glycans may contribute to increased ADCC and inflammation in LBP patiens. This observation corroborates with the finding of the significant difference in the levels of blue and turquoise module glycans in MZ twins discordant for LBP: IGP65 and IGP76 (blue module) were decreased in LBP-positive persons, while IGP74 and IGP75 (turquoise module) were increased in LBP-positive persons (Figs 6 and 7). Accordingly, we found the increased prevalence of major inflammatory diseases in LBP-discordant MZ twins with low levels of IGP65 and IGP76 and high levels of IGP75 and IGP76 (Fig. 8). Even though, the differences in the diseases prevalence were not statistically significant, the pattern of the differences corresponds to the pattern of association between the glycan levels and LBP, thus linking the three entities (glycans, LBP, and systemic inflammatory diseases). It is worth noting, that during inflammation process IgG glycome may vary in a quite complex way following several different patterns35. Therefore, the relationships between fucosylation, bisecting GlcNAc and LBP may not be entirely straightforward.
Interestingly, no statistically significant differences were found between DZ twins discordant for LBP. This may reflect a pronounced impact of environmental or gene-environment variability on co-variation between glycan levels and LBP.
Conclusion
The current study was a first attempt to establish relationships between LBP and glycome. We proceeded from a hypothesis that LBP may be associated with an occult inflammation reflected by IgG glycan levels. We found consistent associations between pro- and anti-ADCC glycans with LBP, thus providing a proof for the tested hypothesis. Overall, our findings provide a further clue how inter-individual differences in IgG glycosylation might affect mechanisms of the development of LBP and suggest that glycans can be of interest as possible patient stratification biomarkers of this pain syndrome.
Material and Methods
Sample
Participants were a sample of MZ and DZ twins enlisted in the Twins UK registry36. The participants in the present study had undergone height and weight measurements used to calculate BMI. Collection of socio-demographic and LBP data was carried out during clinical visit or via a postal self-completion questionnaire. The twins were unaware of the precise research hypothesis addressed in the present study.
The study was carried out under the auspices of the FP7 PainOmics project and was approved by the St Thomas’ Hospital Research Ethics Committee. All the methods were carried out in accordance with the approved guidelines. All participating twins provided signed informed consent.
Participating twins underwent an assessment that included a nurse-led interview and a number of clinical and laboratory tests. As part of the study, the twins completed two standardized questionnaires relating to their lifetime history of low back symptoms. The questionnaires have been completed by each twin separately. The questionnaires included written questions and a mannequin pain diagram allowing an assessment of the timing, distribution, radiation, severity, and duration of pain together with information relating to functional disability. Low back pain was defined on a mannequin as being located between the 12th rib and the gluteal folds. First questionnaire followed the format of questions used in the UK Medical Research Council Nurses Study37 and the procedure of the assessment is detailed elsewhere38. The assessment of twins using this questionnaire was done in framework of the UK Twin Spine Study7,39. Another questionnaire followed the format of London Fibromyalgia Epidemiology Symptom Screening Questionnaire40. Specifically, the following questions have been used: “In the past month, have you had pain symptoms in this area (central lumbar region, left lumbar region, right lumbar region, left buttock, right buttock) lasting at least 24 hours? ” and “Have you had pain like this in this areas for at least the past 3 months? ”. This assessment using this questionnaire was done in framework of ongoing studies of chronic pain syndromes undertaken by the Department of Twin Research and Genetic Epidemiology at King’s College London41.
The LBP phenotype was defined as a binary trait based on questionnaire responses (1 = affected and 0 = nonaffected). Participants were categorised as cases for LBP if they reported having the syndrome with a total duration of >1 month and associated with disability according to the first questionnaire or at least 3 months according to the second questionnaire. Overall, 1656 and 2975 partly overlapping participants have been assessed using first and second questionnaire, respectively, which allowed identification of the LBP status in 3557 participants. Out of them, 585 participants (35.3% tested using first questionnaire) had disabling LBP lasting >1 month and 582 participants (20.0% tested using second questionnaire) had LBP lasting at least 3 months.
For 647 participants magnetic resonance imaging (MRI) was carried out as a part of LBP status assessment. The MRI scan was performed using a Siemens (Munich, Germany) 1.0 T superconducting magnet. Sagittal images were obtained using a fast spin-echo sequence of time to recovery (TR)/time to echo (TE) 5000–4500/112 msec, with a slice thickness of 4 mm. Grading was performed on T2-weighted images, although T1 images were also obtained for certain measurements. Axial sections were obtained at selected levels to assess structural changes in individuals who had features suggesting prolapse. To avoid problems related to diurnal variation in disc height all MRI scans were performed >1 hour after the subjects arose from sleep in the morning, with no exercise or other rest allowed between arising and the scan, and importantly, each twin pair was scanned at the same appointment and on the same machine42. A disease (LBP) severity score was constructed from the sum of scores for disc bulge, height, signal change, and narrowing in the lumbar spine (LSUM).
Analysis of IgG glycans
Isolation of IgG from Human Plasma
The IgG was isolated using protein G monolithic plates (BIA Separations, Ajdovščina, Slovenia) as described previously29. Briefly, 50 to 90 μL of serum was diluted 7 × with 1 × PBS, pH 7.4, applied to the protein G plate and instantly washed with 1 × PBS, pH 7.4, to remove unbound proteins. IgG was eluted with 1 mL of 0.1 M formic acid (Merck, Darmstadt, Germany) and neutralized with 1 M ammonium bicarbonate (Merck).
Glycan Release and Labeling
IgG samples were first denatured with addition of 30 μL 1.33% sodium dodecyl sulfate (w/v) (Invitrogen, Carlsbad, CA) and by incubation at 65 °C for 10 min. Subsequently, 10 μL of 4% Igepal-CA630 (Sigma-Aldrich, St. Louis, MO) and 1.25 mU of PNGase F (ProZyme) in 10 μL 5 × phosphate-buffered saline were added to the samples. The samples were incubated overnight at 37 °C for N-glycan release. The released N-glycans were labeled with 2-AB. The labeling mixture was freshly prepared by dissolving 2-AB (Sigma–Aldrich) in dimethyl sulfoxide (Sigma–Aldrich) and glacial acetic acid (Merck) mixture (85:15, v/v) to a final concentration of 48 mg/mL. A volume of 25 μL of labeling mixture was added to each N-glycan sample in the 96-well plate. Also, 25 μL of freshly prepared reducing agent solution (106.96 mg/mL 2-picoline borane [Sigma-Aldrich] in dimethyl sulfoxide) was added and the plate was sealed using adhesive tape. Mixing was achieved by shaking for 10 min, followed by 2-hour incubation at 65 °C. Samples (in a volume of 100 μL) were brought to 80% acetonitrile (ACN) (v/v) by adding 400 μL of ACN (J.T. Baker, Phillipsburg, NJ). Free label and reducing agent were removed from the samples using hydrophilic interaction chromatography–solid-phase extraction. An amount of 200 μL of 0.1 g/mL suspension of microcrystalline cellulose (Merck) in water was applied to each well of a 0.45 μm GHP filter plate (Pall Corporation, Ann Arbor, MI). Solvent was removed by application of vacuum using a vacuum manifold (Millipore Corporation, Billerica, MA). All wells were prewashed using 5 × 200 μL water, followed by equilibration using 3 × 200 μL acetonitrile/water (80:20, v/v). The samples were loaded to the wells. The wells were subsequently washed seven times using 200 μL acetonitrile/water (80:20, v/v). Glycans were eluted two times with 100 μL of water and combined eluates were stored at −20 °C until usage.
Hydrophilic Interaction Chromatography (HILIC)–Ultra Performance Liquid Chromatography
Fluorescently labeled N-glycans were separated by hydrophilic interaction chromatography on a Waters Acquity ultra performance liquid chromatography (UPLC) instrument (Milford, MA) consisting of a quaternary solvent manager, sample manager, and an FLR fluorescence detector set with excitation and emission wavelengths of 250 and 428 nm, respectively. The instrument was under the control of Empower 2 software, build 2145 (Waters). Labeled N-glycans were separated on a Waters bridged ethylene hybrid, glycan chromatography column, 100 × 2.1 mm internal diameter, 1.7-μm bridged ethylene hybrid particles, with 100 mM ammonium formate, pH 4.4, as solvent A and acetonitrile as solvent B. The separation method used a linear gradient of 75% to 62% acetonitrile (vol/vol) at flow rate of 0.4 mL/min in a 25-minute analytical run. Samples were maintained at 5 °C before injection, and the separation temperature was 60 °C. The system was calibrated using an external standard of hydrolyzed and 2-AB labeled glucose oligomers from which the retention times for the individual glycans were converted to glucose units. Data processing was performed using an automatic processing method with a traditional integration algorithm after which each chromatogram was manually corrected to maintain the same intervals of integration for all the samples. The chromatograms were all separated in the same manner into 24 peaks (GP1-GP24).
Statistical analysis
Pre-processing and filtering
Directly measured glycan levels were normalized and experimental noise was removed through filtering and batch correction. Before this, we removed GP3 and combined GP20 and GP21 into a single trait.
First, we filtered out most extreme values from the dataset (beyond 0.999% percentile). Then, quotient normalization was applied using median values across the dataset as a reference43. Batch effect associated with different plates used to measure glycan levels was identified and corrected for using ratio-based method with either geometric mean or median44. As the results were almost equivalent, herewith, we report only the results for the dataset corrected with geometric mean.
After these steps, we estimated 55 derived glycan levels from the directly measured glycans45 using glycanr package for R [https://github.com/iugrina/glycanr] (Supplementary Table 1). These derived traits average particular glycosylation features (galactosylation, fucosylation, sialylation) across different individual glycan structures and consequently they are more closely related to individual enzymatic activities and underlying genetic polymorphisms. Finally, we applied inverse transformation of ranks to normality to obtain standard Normal distribution using rntransform function from GenABEL package for R46.
After pre-processing we assessed the dependency between the glycan traits and such confounders as age, sex, and body-mass index (BMI). For age piece-wise relationships with glycan levels were found, which made it unjustified adding age in linear regression models as a confounder. Therefore, before further analysis we corrected glycan levels for age (through residuals) by segmented regression using 40–45 years as initial break-down points as implemented in segmented package for R47. The choice of the break-down points was done based on the observation of the correlation clouds for age and glycans followed by a bootstrap based search for “true” breakpoints. Depending on specific glycans, both BMI and sex exhibited remarkable (and significant) to negligible (and insignificant) linear relationships with glycan levels.
Linear mixed-models analysis
Because of the twin structure of the dataset, association analyses between disease status and glycan traits were performed using linear mixed models with lme4 package for R with BMI and sex included as fixed covariates and variation in IgG glycan quantities between twin pairs as random effect. Also, for 36 participants a diagnosis of a major systemic inflammatory disorder was established, including rheumatoid arthritis, systemic lupus erythematosus, ulcerative colitis, and Crohn’s disease. As people with such diagnoses normally undergo therapy with painkillers and anti-inflammatory medicine, and also the diseases have previously been found associated with variation in glycan levels, we included the diseases status as a fixed effect covariate in the analysis. The association was analysed for each glycan separately.
Weighted glycan “expression” networks
We used WGCNA package for R48,49 to carry out an exploratory analysis of “network” dependencies between the glycan traits. The algorithm of the analysis is based on the estimation of correlations between the glycan levels across the dataset followed by extraction of relatively independent modules of correlated glycans. Glycan levels were adjusted for age, sex, BMI, and inflammatory disease status before the analysis. Signed networks algorithm was used which takes into account the direction of the correlation between glycans. The modules (represented by their eigenvalue estimated as first principal component for the glycans in every module) then were correlated with the pain phenotypes, including LBP and MRI trait LSUM. To estimate correlations between glycan modules and pain phenotypes we used point-biserial correlation coefficients and Pearson’s correlation coefficients for qualitative and quantitative traits, respectively.
Discordant twins analysis
We compared the glycan levels in MZ and DZ twins discordant for LBP using paired t-test. Prior to the test, glycan levels were adjusted for age, sex, BMI, and inflammatory disease status.
The significance level consideration
There is an essential correlation between the glycan traits, many of which were derived from the original set of directly measured glycans. This complicates straightforward application of correction for multiple testing due to the violation of the requirement for the independence of the tests. Taking this into account, we estimated the effective number of independent statistical tests as of 1950, which after Sidak’s correction for multiple testing provided the significance level of 0.0027.
Additional Information
How to cite this article: Freidin, M. B. et al. The Association Between Low Back Pain and Composition of lgG Glycome. Sci. Rep. 6, 26815; doi: 10.1038/srep26815 (2016).
Supplementary Material
Acknowledgments
This work was carried out in framework of the European Community’s Seventh Framework Programme funded PainOmics project (contract # 602736) and also supported by the European Community’s Seventh Framework Programme MIMOmics (contract #305280), HTP-GlycoMet (contract #324400) and IntegraLife (contract #315997) grants and Arthritis Research UK (grant #7448). TwinsUK: the study was funded by the Wellcome Trust; European Community’s Seventh Framework Programme (FP7/2007–2013). The study also receives support from the National Institute for Health Research (NIHR)-funded BioResource, Clinical Research Facility and Biomedical Research Centre based at Guy’s and St Thomas’ NHS Foundation Trust in partnership with King’s College London.
Footnotes
GL is founder and CEO of Genos — a private research organization that specialises in highthroughput glycomic analysis and has several patents in this field.
Author Contributions M.B.F. carried out statistical analysis; T.K., I.G., J.S., T.P. and M.S. performed glycan analysis; M.B.F., T.K., D.V., S.M.F., M.A., G.L. and F.M.K.W. were involved in interpretation of the results, drafting and revision of the manuscript; F.M.K.W. and G.L. conceived and designed the study. All authors read and approved the final manuscript.
References
- Brooks P. M. The burden of musculoskeletal disease–a global perspective. Clin Rheumatol 25, 778–781, 10.1007/s10067-006-0240-3 (2006). [DOI] [PubMed] [Google Scholar]
- Andersson G. B. Epidemiological features of chronic low-back pain. Lancet 354, 581–585, 10.1016/S0140-6736(99)01312-4 (1999). [DOI] [PubMed] [Google Scholar]
- Louw Q. A., Morris L. D. & Grimmer-Somers K. The prevalence of low back pain in Africa: a systematic review. BMC Musculoskelet Disord 8, 105, 10.1186/1471-2474-8-105 (2007). [DOI] [PMC free article] [PubMed] [Google Scholar]
- Steffens D. et al. Does magnetic resonance imaging predict future low back pain? A systematic review. Eur J Pain 18, 755–765, 10.1002/j.1532-2149.2013.00427.x (2014). [DOI] [PubMed] [Google Scholar]
- Williams F. M. & Sambrook P. N. Neck and back pain and intervertebral disc degeneration: role of occupational factors. Best Pract Res Clin Rheumatol 25, 69–79, 10.1016/j.berh.2011.01.007 (2011). [DOI] [PubMed] [Google Scholar]
- Patel A. A., Spiker W. R., Daubs M., Brodke D. & Cannon-Albright L. A. Evidence for an inherited predisposition to lumbar disc disease. J Bone Joint Surg Am 93, 225–229, 10.2106/JBJS.J.00276 (2011). [DOI] [PMC free article] [PubMed] [Google Scholar]
- Livshits G. et al. Lumbar disc degeneration and genetic factors are the main risk factors for low back pain in women: the UK Twin Spine Study. Ann Rheum Dis 70, 1740–1745, 10.1136/ard.2010.137836 (2011). [DOI] [PMC free article] [PubMed] [Google Scholar]
- Kalichman L. & Hunter D. J. The genetics of intervertebral disc degeneration. Associated genes. Joint Bone Spine 75, 388–396, 10.1016/j.jbspin.2007.11.002 (2008). [DOI] [PubMed] [Google Scholar]
- Eskola P. J. et al. Genetic association studies in lumbar disc degeneration: a systematic review. PLos one 7, e49995, 10.1371/journal.pone.0049995 (2012). [DOI] [PMC free article] [PubMed] [Google Scholar]
- Song Y. Q. et al. Lumbar disc degeneration is linked to a carbohydrate sulfotransferase 3 variant. J Clin Invest 123, 4909–4917, 10.1172/JCI69277 (2013). [DOI] [PMC free article] [PubMed] [Google Scholar]
- Williams F. M. et al. Novel genetic variants associated with lumbar disc degeneration in northern Europeans: a meta-analysis of 4600 subjects. Ann Rheum Dis 72, 1141–1148, 10.1136/annrheumdis-2012-201551 (2013). [DOI] [PMC free article] [PubMed] [Google Scholar]
- Tajerian M. et al. DNA methylation of SPARC and chronic low back pain. Mol Pain 7, 65, 10.1186/1744-8069-7-65 (2011). [DOI] [PMC free article] [PubMed] [Google Scholar]
- Ohtsubo K. & Marth J. D. Glycosylation in cellular mechanisms of health and disease. Cell 126, 855–867, 10.1016/j.cell.2006.08.019 (2006). [DOI] [PubMed] [Google Scholar]
- Freeze H. H. Genetic defects in the human glycome. Nat Rev Genet 7, 537–551, 10.1038/nrg1894 (2006). [DOI] [PubMed] [Google Scholar]
- Abbott K. L. et al. Focused glycomic analysis of the N-linked glycan biosynthetic pathway in ovarian cancer. Proteomics 8, 3210–3220, 10.1002/pmic.200800157 (2008). [DOI] [PMC free article] [PubMed] [Google Scholar]
- Nairn A. V. et al. Regulation of glycan structures in animal tissues: transcript profiling of glycan-related genes. J Biol Chem 283, 17298–17313, 10.1074/jbc.M801964200 (2008). [DOI] [PMC free article] [PubMed] [Google Scholar]
- Gornik O., Pavic T. & Lauc G. Alternative glycosylation modulates function of IgG and other proteins - implications on evolution and disease. Biochim Biophys Acta 1820, 1318–1326, 10.1016/j.bbagen.2011.12.004 (2012). [DOI] [PubMed] [Google Scholar]
- Malhotra R. et al. Glycosylation changes of IgG associated with rheumatoid arthritis can activate complement via the mannose-binding protein. Nat Med 1, 237–243 (1995). [DOI] [PubMed] [Google Scholar]
- Mihai S. & Nimmerjahn F. The role of Fc receptors and complement in autoimmunity. Autoimmun Rev 12, 657–660, 10.1016/j.autrev.2012.10.008 (2013). [DOI] [PubMed] [Google Scholar]
- Karsten C. M. et al. Anti-inflammatory activity of IgG1 mediated by Fc galactosylation and association of FcgammaRIIB and dectin-1. Nat Med 18, 1401–1406, 10.1038/nm.2862 (2012). [DOI] [PMC free article] [PubMed] [Google Scholar]
- Masuda K. et al. Enhanced binding affinity for FcgammaRIIIa of fucose-negative antibody is sufficient to induce maximal antibody-dependent cellular cytotoxicity. Mol Immunol 44, 3122–3131, 10.1016/j.molimm.2007.02.005 (2007). [DOI] [PubMed] [Google Scholar]
- Umana P., Jean-Mairet J., Moudry R., Amstutz H. & Bailey J. E. Engineered glycoforms of an antineuroblastoma IgG1 with optimized antibody-dependent cellular cytotoxic activity. Nat Biotechnol 17, 176–180, 10.1038/6179 (1999). [DOI] [PubMed] [Google Scholar]
- Horvath S. et al. Analysis of oncogenic signaling networks in glioblastoma identifies ASPM as a molecular target. Proc Natl Acad Sci USA 103, 17402–17407, 10.1073/pnas.0608396103 (2006). [DOI] [PMC free article] [PubMed] [Google Scholar]
- Oldham M. C., Horvath S. & Geschwind D. H. Conservation and evolution of gene coexpression networks in human and chimpanzee brains. Proc Natl Acad Sci USA 103, 17973–17978, 10.1073/pnas.0605938103 (2006). [DOI] [PMC free article] [PubMed] [Google Scholar]
- Fuller T. F. et al. Weighted gene coexpression network analysis strategies applied to mouse weight. Mamm Genome 18, 463–472, 10.1007/s00335-007-9043-3 (2007). [DOI] [PMC free article] [PubMed] [Google Scholar]
- Presson A. P. et al. Integrated weighted gene co-expression network analysis with an application to chronic fatigue syndrome. BMC Syst Biol 2, 95, 10.1186/1752-0509-2-95 (2008). [DOI] [PMC free article] [PubMed] [Google Scholar]
- Saris C. G. et al. Weighted gene co-expression network analysis of the peripheral blood from Amyotrophic Lateral Sclerosis patients. BMC Genomics 10, 405, 10.1186/1471-2164-10-405 (2009). [DOI] [PMC free article] [PubMed] [Google Scholar]
- van Eijk K. R. et al. Genetic analysis of DNA methylation and gene expression levels in whole blood of healthy human subjects. BMC Genomics 13, 636, 10.1186/1471-2164-13-636 (2012). [DOI] [PMC free article] [PubMed] [Google Scholar]
- Pucic M. et al. High throughput isolation and glycosylation analysis of IgG-variability and heritability of the IgG glycome in three isolated human populations. Mol Cell Proteomics 10, M111 010090, 10.1074/mcp.M111.010090 (2011). [DOI] [PMC free article] [PubMed] [Google Scholar]
- Lauc G. et al. Loci associated with N-glycosylation of human immunoglobulin G show pleiotropy with autoimmune diseases and haematological cancers. PLoS Genet 9, e1003225, 10.1371/journal.pgen.1003225 (2013). [DOI] [PMC free article] [PubMed] [Google Scholar]
- Vuckovic F. et al. Systemic lupus erythematosus associates with the decreased immunosuppressive potential of the IgG glycome. Arthritis Rheumatol, 10.1002/art.39273 (2015). [DOI] [PMC free article] [PubMed] [Google Scholar]
- Gornik O. & Lauc G. Glycosylation of serum proteins in inflammatory diseases. Dis Markers 25, 267–278 (2008). [DOI] [PMC free article] [PubMed] [Google Scholar]
- Burke J. G. et al. Intervertebral discs which cause low back pain secrete high levels of proinflammatory mediators. J Bone Joint Surg Br 84, 196–201 (2002). [DOI] [PubMed] [Google Scholar]
- Sheth T., Pitchumoni C. S. & Das K. M. Musculoskeletal manifestations in inflammatory bowel disease: a revisit in search of immunopathophysiological mechanisms. J Clin Gastroenterol 48, 308–317, 10.1097/MCG.0000000000000067 (2014). [DOI] [PubMed] [Google Scholar]
- Novokmet M. et al. Changes in IgG and total plasma protein glycomes in acute systemic inflammation. Sci Rep 4, 4347, 10.1038/srep04347 (2014). [DOI] [PMC free article] [PubMed] [Google Scholar]
- Moayyeri A., Hammond C. J., Hart D. J. & Spector T. D. The UK Adult Twin Registry (TwinsUK Resource). Twin Res Hum Genet 16, 144–149, 10.1017/thg.2012.89 (2013). [DOI] [PMC free article] [PubMed] [Google Scholar]
- Smedley J., Inskip H., Cooper C. & Coggon D. Natural history of low back pain. A longitudinal study in nurses. Spine (Phila Pa 1976) 23, 2422–2426 (1998). [DOI] [PubMed] [Google Scholar]
- MacGregor A. J., Andrew T., Sambrook P. N. & Spector T. D. Structural, psychological, and genetic influences on low back and neck pain: a study of adult female twins. Arthritis Rheum 51, 160–167, 10.1002/art.20236 (2004). [DOI] [PubMed] [Google Scholar]
- Livshits G. et al. Evidence that bone mineral density plays a role in degenerative disc disease: the UK Twin Spine study. Ann Rheum Dis 69, 2102–2106, 10.1136/ard.2010.131441 (2010). [DOI] [PMC free article] [PubMed] [Google Scholar]
- White K. P., Speechley M., Harth M. & Ostbye T. The London Fibromyalgia Epidemiology Study: the prevalence of fibromyalgia syndrome in London, Ontario. J Rheumatol 26, 1570–1576 (1999). [PubMed] [Google Scholar]
- Livshits G. et al. An omics investigation into chronic widespread musculoskeletal pain reveals epiandrosterone sulfate as a potential biomarker. Pain 156, 1845–1851, 10.1097/j.pain.0000000000000200 (2015). [DOI] [PMC free article] [PubMed] [Google Scholar]
- Paajanen H., Lehto I., Alanen A., Erkintalo M. & Komu M. Diurnal fluid changes of lumbar discs measured indirectly by magnetic resonance imaging. J Orthop Res 12, 509–514, 10.1002/jor.1100120407 (1994). [DOI] [PubMed] [Google Scholar]
- Dieterle F., Ross A., Schlotterbeck G. & Senn H. Probabilistic quotient normalization as robust method to account for dilution of complex biological mixtures. Application in 1H NMR metabonomics. Anal Chem 78, 4281–4290, 10.1021/ac051632c (2006). [DOI] [PubMed] [Google Scholar]
- Chen C. et al. Removing batch effects in analysis of expression microarray data: an evaluation of six batch adjustment methods. PLos one 6, e17238, 10.1371/journal.pone.0017238 (2011). [DOI] [PMC free article] [PubMed] [Google Scholar]
- Huffman J. E. et al. Comparative performance of four methods for high-throughput glycosylation analysis of immunoglobulin G in genetic and epidemiological research. Mol Cell Proteomics 13, 1598–1610, 10.1074/mcp.M113.037465 (2014). [DOI] [PMC free article] [PubMed] [Google Scholar]
- Aulchenko Y. S., Ripke S., Isaacs A. & van Duijn C. M. GenABEL: an R library for genome-wide association analysis. Bioinformatics 23, 1294–1296, 10.1093/bioinformatics/btm108 (2007). [DOI] [PubMed] [Google Scholar]
- Muggeo V. M. Estimating regression models with unknown break-points. Stat Med 22, 3055–3071, 10.1002/sim.1545 (2003). [DOI] [PubMed] [Google Scholar]
- Langfelder P. & Horvath S. WGCNA: an R package for weighted correlation network analysis. BMC Bioinformatics 9, 559, 10.1186/1471-2105-9-559 (2008). [DOI] [PMC free article] [PubMed] [Google Scholar]
- Langfelder P. & Horvath S. Fast R Functions for Robust Correlations and Hierarchical Clustering. J Stat Softw 46, i11, 10.18637/jss.v046.i11 (2012). [DOI] [PMC free article] [PubMed] [Google Scholar]
- Li J. & Ji L. Adjusting multiple testing in multilocus analyses using the eigenvalues of a correlation matrix. Heredity (Edinb) 95, 221–227, 10.1038/sj.hdy.6800717 (2005). [DOI] [PubMed] [Google Scholar]
Associated Data
This section collects any data citations, data availability statements, or supplementary materials included in this article.


