Abstract
The measurement of extracellular pH has potential utility for assessing the therapeutic effects of pH-dependent and pH-altering therapies. A PARAmagnetic chemical exchange saturation transfer (PARACEST) MRI contrast agent, Yb–DO3A–oAA, has two CEST effects that are dependent on pH. A ratio derived from these CEST effects was linearly correlated with pH throughout the physiological pH range. The pH can be measured with a precision of 0.21 pH units and an accuracy of 0.09 pH units. The pH measurement is independent of concentration and T1 relaxation times, but is dependent on temperature. Although MR coalescence affects the CEST measurements, especially at high pH, the ratiometric analysis of the CEST effects can account for incomplete saturation of the agent’s amide and amine that results from MR coalescence. Provided that an empirical calibration is determined with saturation conditions, magnetic field strength and temperature that can be used for subsequent studies, these results demonstrate that this single PARACEST MRI contrast agent can accurately measure pH.
Keywords: PARACEST, MRI, contrast agent, pH
1. INTRODUCTION
Substantial evidence indicates that some tumor microenvironments become hypoxic, which leads to acidic extracellular pH (pHe), which then changes extrinsic cellular interactions and leads to tumor malignancy (1,2). However, the timing of changes in tumor pHe with respect to tumor progression and metastatic potential is largely unknown. Therapies that alkalinize tumor pHe have been suggested to reduce malignancy (3–5). Yet the effects of pH-modulating therapies on pHe in tumors and normal tissues must be longitudinally evaluated when this class of anti-cancer therapies is investigated. Therefore, there is an imperative need for a clinically relevant, high-resolution, noninvasive imaging methodology for measuring tumor pHe.
Microelectrodes, optical imaging, electron paramagnetic resonance imaging, PET imaging and magnetic resonance spectroscopy have been used to measure tumor pHe, but these methods suffer from coarse spatial resolution that cannot evaluate tumor microenvironments (6–11). Hyperpolarized 13C MRS for measuring tumor pHe has recently attracted interest, but this technique requires a hyperpolarization system and a 13C transceiver coil that are unavailable in most radiology clinics, measures a weighted average of intracellular and extracellular pH and also suffers from coarse spatial resolution (12). Magnetic resonance imaging (MRI) can evaluate the entire tumor volume with fine spatial resolution, and therefore is an improvement relative to these other methods. Some MRI contrast agents can change their T1 relaxivities in a pH-dependent manner, but the change in T1 relaxation time caused by a pH-responsive MRI contrast agent is also dependent on the concentration of the agent (11,13–16). Serial injections of multiple contrast agents, and/or including a T2- or T2*-relaxation MRI measurement to account for agent concentration may be complicated (17,18). More recently, a pH-dependent T1-relaxation MRI contrast agent has been modified to carry out 18F for PET imaging to quantify agent concentration (19). However, the use of two imaging modalities may be problematic, and the ~1 mm spatial resolution of PET imaging is relatively coarse. Therefore, methods that measure tumor pHe using a relaxation-based MRI contrast agent are challenging.
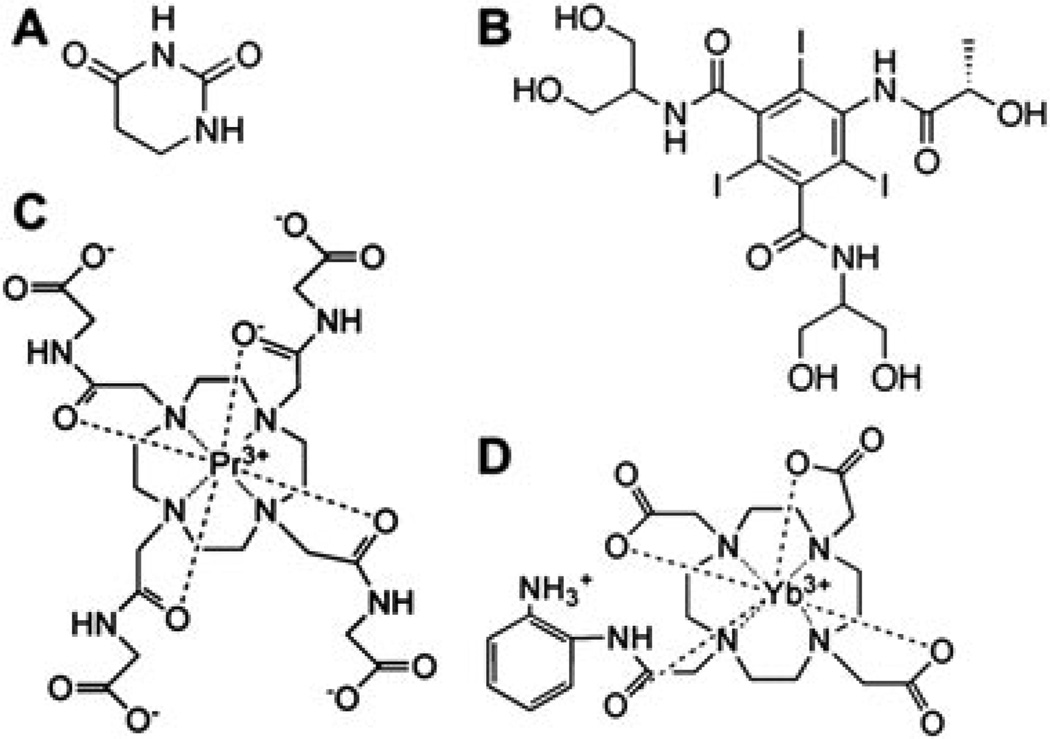
MRI contrast agents that are detected via chemical exchange saturation transfer (CEST) have also been employed to measure pH. One of the first CEST agents to be characterized, 5,6-dihydrouracil, has two amides that produce two CEST effects (Fig. 1A) (20). A ratiometric comparison of the two CEST effects showed them to be correlated with pH between 6.2 and 7.0 at 300 MHz magnetic field strength. Another CEST agent, N,N′-bis(2,3-dihydroxypropyl)-2,4,6-triiodo-5[(methoxyacetyl)amide]-1[N-methyl]-1,3-benzenedicar-boxamide (Iopamidol), also has two amides that produce two CEST effects, which can be used to measure pH over a similar range of 6.0–7.0 at 300 MHz (Fig. 1B) (21). For each of these CEST agents, the chemical shifts of the amides are similar and near the chemical shift of water, so that selective detection and quantification of each CEST effect can be technically difficult.
Figure 1.
CEST MRI agents that can measure pH. (A) 5,6-Dihydrouracil (19); (B) iopamidol (20); (C) Pr-DOTA-Gly4 (22,23); (D) Yb–DO3A–oAA (24,25).
Paramagnetic CEST (PARACEST) contrast agents contain a lanthanide ion that greatly shifts the MR frequency of the exchangeable protons from the MR frequency of water, which expands the range of MR frequencies that can generate a CEST effect (22). This expanded frequency range facilitates the selective detection of two CEST effects from the same contrast agent. A series of PARA-CEST agents that use 1,4,7,10-tetraazacyclododecane,N,N′,N″,N′″-tetraacetic acid (DOTA-Gly4) to chelate Pr(III), Eu(III) or Nd(III) possess pH-responsive and pH-unresponsive CEST effects from an amide and metal-bound water, respectively (Fig. 1C) (23,24). A ratio of the two CEST effects can then be used to measure pH over a range of 6.5–7.5 at 300 MHz. However, very high saturation powers are required to detect the PARACEST effect from the metal-bound water owing to fast exchange rates at physiological temperature, so that these agents cannot be safely applied to measure in vivo tumor pH. More recently, the ratio of two CEST effects of a PARACEST agent with a different ligand coordination cage, Yb(III) chelate of 10-(2-hydroxypropyl)-1,4,7,10-tetraazacyclodo-decane-1,4,7-triacetic acid (Yb–HPDO3A), has been shown to measure pH at moderate saturation powers. This indicates that a single PARACEST agent for eventual in vivo studies of tissue pH may be feasible (25). Another PARACEST agent with a single CEST effect has been shown to have a pH-dependent chemical shift, which can be used to measure pH without requiring a measurement of the agent’s concentration, further expanding the functionality of PARACEST agents for pH measurements (26).
We have previously reported a PARACEST MRI contrast agent, Yb3+-1,4,7,10-tetraazacyclododecane-1,4,7-triacetic acid, 10-o-aminoanilide (Yb–DO3A–oAA), that has two CEST effects at chemical shifts that are selectively detectable at reasonable saturation powers for pre-clinical studies (Fig. 1D) (27,28). These previous studies indicated that the amide and amine of this agent produce CEST effects with different magnitudes at different pH. Therefore, we hypothesized that the ratiometric comparison of these two CEST effects may also be correlated with pH. Furthermore, our previous studies of Yb–DO3A–oAA showed that the ratio of the two CEST effects was independent of concentration and T1 relaxation time, but was dependent on temperature. For comparison, the previous studies of 5,6-dihydrouracil, Iopamidol, and lanthanide chelates of DOTA-Gly4 did not investigate the dependence of the pH measurements on these other conditions, so that the accuracy of these methods during practical applications is unknown. Therefore, we investigated the influence of these other conditions to evaluate if the single PARACEST MRI contrast agent, Yb–DO3A–oAA, can accurately measure pH.
2. THEORY
2.1. CEST and pH
CEST is typically reported as the decrease in water signal during selective saturation of the contrast agent, relative to the water signal without selective saturation of the agent while accounting for direct saturation of water [eqn (1)]. To describe chemical exchange phenomena, the Bloch equations can be modified to account for chemical exchange within a two-pool model (29). These equations can be simplified by assuming that complete saturation of the contrast agent is achieved, saturation is achieved instantaneously and direct saturation of water protons is negligible [eqn (2)]. The ratio of two CEST effects from the same agent is a function of only the number of exchangeable protons and the chemical exchange rates, assuming that the T1sat relaxation time and concentration of water involved in chemical exchange is the same for each exchangeable proton [eqn (3)]. The chemical exchange behavior of amides and amines is known to be base-catalyzed [eqn ((4A, 4B))] (30). Therefore, the ratio of the CEST effects can be related to pH [eqn (5)] (31).
| (1) |
where MS is the water magnetization with selective saturation of the agent, and potentially with partial direct saturation of bulk water, and M0 is the water magnetization without selective saturation of the agent, but potentially with partial direct saturation of bulk water.
| (2) |
where kCA is the chemical exchange rate of a proton from the agent to water; T1sat is the T1 relaxation time in the presence of selective saturation; nCA, nH2O is the number of magnetically equivalent exchangeable protons on the contrast agent and water molecule, respectively; and [CA], [H2O] is the concentration of the contrast agent and water, respectively.
Assuming that [CA], [H2O] and T1sat are equal for the two CEST effects,
| (3) |
| (4A) |
where k0 is the spontaneous chemical exchange rate; ka is the acid-catalyzed chemical exchange rate; kb is the base-catalyzed chemical exchange rate; pKW is the ionization constant of water, KW; pKW= 15.4 at 37.0°C (32).
For base-catalyzed chemical exchange, ka is negligible and eqn (4A) can be simplified:
| (4B) |
| (5) |
2.2. The line shapes of a CEST spectrum
An alternative modification of the Bloch equations to account for chemical exchange within a two-pool model can relate the CEST effect to the MR chemical shift of the selective saturation [eqn (6)]. As with eqn (2), this modification assumes complete and instantaneous saturation of the contrast agent, and that direct saturation of water protons is negligible. Combining eqns (1) and eqns (6) shows that the CEST spectrum has a Lorentzian line shape in aqueous solutions [eqns (7A)–(7E)] (33).
| (6) |
| (7A) |
| (7B) |
where sf is the MR chemical shift of the selective saturation; ω0 is the MR chemical shift of the exchangeable proton of the CEST agent; ω1sat is the saturation power (in units of Hz); and T1sat, T2sat are the T1 and T2 relaxation times of water in the presence of saturation.
Define:
| (7C) |
| (7D) |
Substituting eqns (7C) and (7D) into eqn (7B), and expanding eqn (7B) to account for two CEST effects of Yb–DO3A–oAA and the direct saturation of water, results in a sum of three Lorentzian line shapes:
| (7E) |
where A1,2,3 is the the area of the Lorentzian line; w1,2,3 is the line width at half height of the Lorentzian line; and ω1,2,3 is the the maximum of the Lorentzian line.
3. RESULTS AND DISCUSSION
3.1. The CEST Effects of Yb–DO3A–oAA
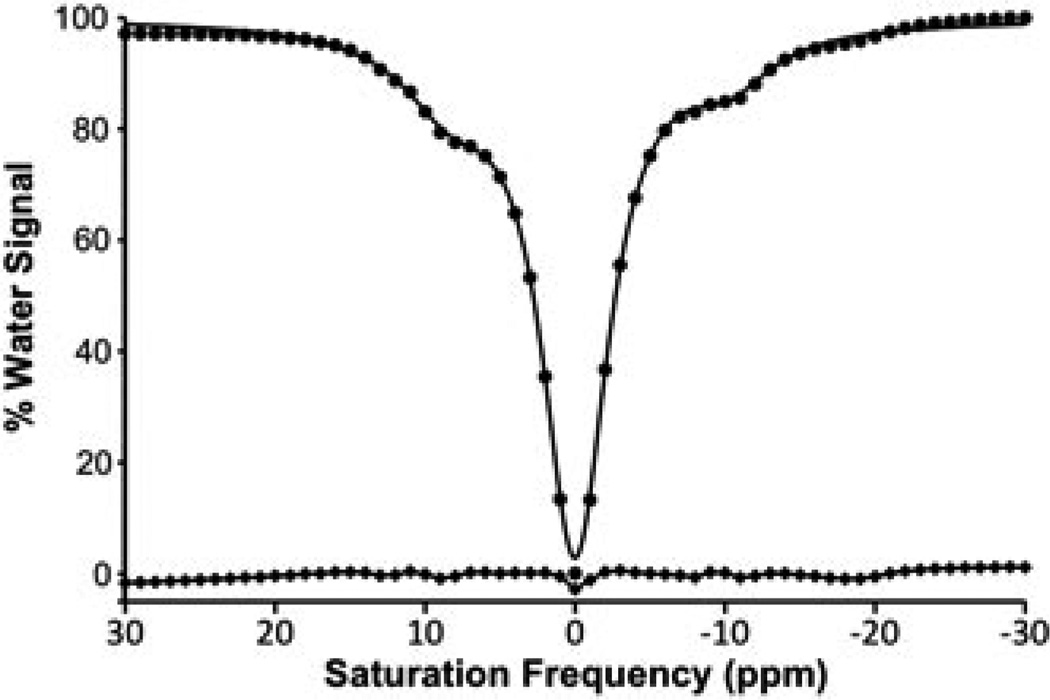
A 30 mm sample of Yb–DO3A–oAA at pH 7.3 and 38.3 °C showed a 33.8% CEST effect at −9.80 ppm and a 44.3% CEST effect at +9.75 ppm (Fig. 2). This CEST effect at −9.80 ppm was assigned to the amide based on CEST studies of similar Yb(III) chelates with amides at the same structural position (34). The other CEST effect was assigned to the amine based on evidence from previous reports (27,28). NMR spectra in 10% D2O and ~100% D2O revealed that the exchangeable protons had chemical shifts of +9.60 and −8.95 ppm, which were close to the MR frequencies used to detect the CEST effects (Fig. S1, Supporting Information).
Figure 2.
CEST spectrum of Yb–DO3A–oAA. A CEST spectrum of 30mm Yb–DO3A–oAA at pH 7.3 and 38.3°C was acquired with 6 µT selective saturation for 4 s with a 1 ppm bandwidth in 1 ppm increments. The CEST spectrum (circles) was fitted with a single function that consisted of a sum of three Lorentzian lines (thick line). The difference between the experimental data and the fitted function (squares connected by a thin line) shows the residual errors of the line fitting process.
Each CEST spectrum was fitted with a function that consisted of a sum of three Lorentzian lines [eqn (7E)]. The residuals of the fitting routine showed non-negligible errors at the saturation frequencies of the CEST effects for the amide and amine (Fig. 2). Yet the Lorentzian lines that represented the CEST effects of the amide and amine had ranges of 19.7 and 12.3 ppm, respectively (the range of each CEST effect was defined as the width of the ‘base’ of the Lorentzian line which lies at the signal amplitude that is equal to the standard deviation of the residual errors of the Lorentzian line fitting). These ranges indicated that the fitting of each CEST effect depended on more experimental data points than just the experimental data point at −10 and 10 ppm, suggesting that the Lorentzian line fitting may generate more accurate measurements than relying on single experimental data point for each CEST effect.
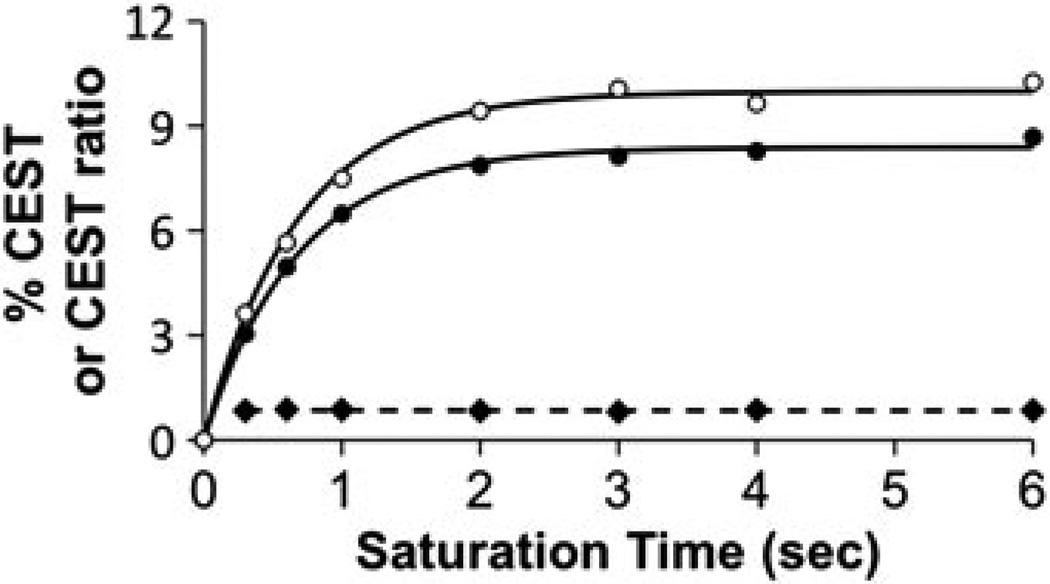
The time to reach steady state saturation depends on the chemical exchange rate and the T1 relaxation rates of the agent and water (35). The time to reach steady-state saturation for each CEST effect was measured by varying the saturation time while also adjusting the delay time between acquisitions to maintain constant relaxation effects (Fig. 3). These results demonstrate that a saturation time of 2.5 s was sufficient to reach steady state. A saturation time greater than 2.5 s was used for all subsequent experiments. In addition, the ratio of the CEST effects was invariant with respect to saturation time.
Figure 3.
The dependence of CEST on saturation time. The percentage CEST effects of the amide (solid circles) and amine (open circles) of 30 mm of Yb–DO3A–oAA were measured at pH 6.32 and 38.3°C using 10 µT saturation power. The QUEST equation was fitted to each CEST effect (solid lines) (35). The amide/amine ratio of the CEST effects (diamonds) showed no dependence on the saturation time (the dotted line represents the linear fitting of the ratio of the CEST effects).
3.2. The measurement of pH with Yb–DO3A–oAA
The CEST effect from the amide group increased slightly from pH 6 to 6.6 before decreasing at higher pH values (Fig. 4A). The CEST effect from the amine group increased from pH 6 to 7.2, and then decreased at higher pH values (Fig. 4B). As suggested by eqn (5), the log10 of the ratio of the CEST effects was found to be linearly dependent on pH (Fig. 4C). The pH of subsequent studies was determined from this correlation, pH = 6.34–2.82 [log10{[(M0 - MS)/M0]amide/[(M0-MS)/M0]amine}]. Although the magnitude of the CEST effect that can be determined with good probability is dependent on the noise level of the MR results, a 5% CEST effect is generally accepted as a minimum threshold for most MRI applications (27,36). The CEST effects are greater than 5% through a pH range of 6.0–7.6 under the experimental conditions of this study.
Figure 4.
The dependence of CEST on pH. The percentage CEST effects of the (A) amide and (B) amine of 30 mm of Yb–DO3A–oAA were measured at 38.3°C using 10 µT saturation power. Error bars represent the standard deviation of three repetitions, and some error bars are smaller than the data symbol. (C) The log10 of the ratio of CEST showed an excellent correlation with pH (R2 = 0.88 and a standard deviation of 0.21 pH units). The pH of subsequent studies was determined from this correlation, pH=6.34–2.82 (log10{[(M0−MS)/M0]amide/[(M0−MS)/M0]amine}).
To assess the precision of the pH measurements from the CEST effects of Yb–DO3A–oAA, the standard deviation of the experimental pH measurements relative to the linear regression was determined to be 0.21 pH units. This level of precision is an upper limit of uncertainty, because the ‘gold standard’ pH electrode has an accuracy of approximately 0.05 pH units. No statistically significant difference was observed for the accuracy of measuring low pH vs high pH values.
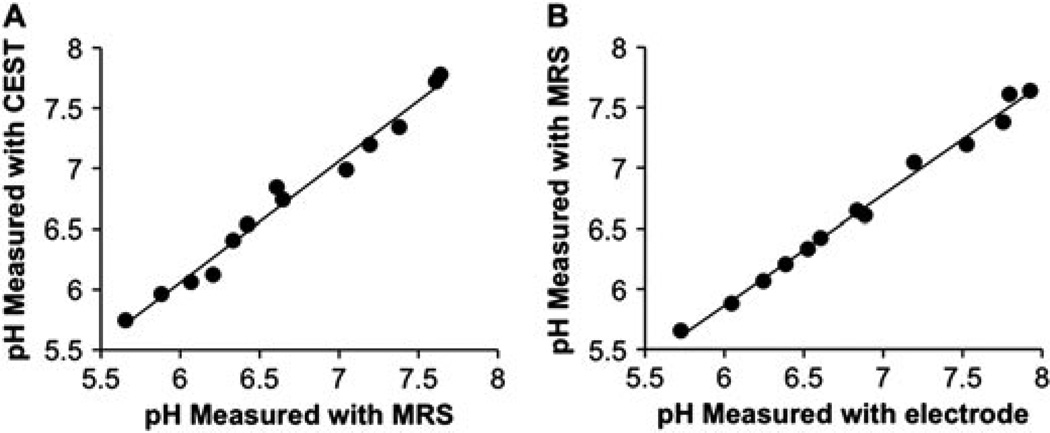
To assess the accuracy of this CEST method, the pH of each sample was also measured using MR spectroscopy of IEPA (Fig. S2, Supporting Information) (37). The comparison of pH measurements from both methods showed outstanding agreement throughout the entire pH range, with a slope of 1.00, an R2 correlation coefficient of 0.99, and a standard deviation of 0.09 pH units (Fig. 5A). A paired t-test assuming unequal variances indicated that the pH measurements by IEPA and PARACEST are statistically indistinguishable (p = 0.29) (38). Although lanthanide ions can act as chemical shift agents, the presence of Yb–DO3A–oAA did not affect the pH measurements with IEPA as compared with a pH electrode (Fig. 5B). Although IEPA can act as a pH buffer, this buffering is not expected to influence the CEST measurements of Yb–DO3A–oAA.
Figure 5.
Validation of pH measurements. (A) The pH measured with CEST of Yb–DO3A–oAA at 38.3°C had outstanding agreement with the pH measured with MR spectroscopy of IEPA (slope = 1.00, R2 = 0.99, standard deviation = 0.09 pH units) at the same temperature. (B) The pH measured with MR spectroscopy of IEPA had excellent agreement with the pH measured with an electrode (slope =0.92, R2 = 0.996, standard deviation = 0.079 pH units), indicating that the presence of Yb–DO3A–oAA did not affect the chemical shift of IEPA.
3.3. Conditions that may affect pH measurements with Yb– DO3A–oAA
The CEST effects of the amine and amide of Yb–DO3A–oAA each increased with increasing concentration (Fig. 6A). In theory, the chemical exchange of the amide, amine and water should be modeled as a three-pool system. However, eqn (2) was fitted to the experimental data using a Hanes-like analysis method, which follows a two-pool model in which the two pools are water and one type of exchangeable proton on the agent (Fig. 6B) (39). Because this Hanes-like an anlysis showed a linear fit to the experimental data (R2 = 0.89 and 0.94 for the amine and amide, respectively), both chemical exchange processes can be approximated as a two-pool model. In practice, the amide had negligible effect on the amine–water exchange process, and the amine had negligible effect on the amide-water exchange process, within the tested concentrations of contrast agent and experimental precision of this analysis. More importantly, the ratio of the CEST effects was not influenced by the concentration of the agent. Thus, the accuracy of the pH measurement was not influenced by concentration (Fig. 6C).
Figure 6.
The dependence of CEST on concentration. (A) The percentage CEST effects of the amide (solid circles) and amine (open circles) of Yb– DO3A–oAA were measured at pH 7.20 and 37°C using 10 µT saturation power over a range of concentrations. The curved lines were calculated from the Hanes-like analysis shown in (B) [see (39) for details]. The ratio of the CEST effects (diamonds) was fitted with a linear function to demonstrate that the ratio is independent of concentration. (B) The high R2 correlation coefficients of the linear fit of the Hanes-like analysis method to the experimental data indicated that the chemical exchange of the amide (solid circles) or amine (open circles) with water can be approximated as a two-pool model. (C) The pH values measured from the CEST effects of Yb–DO3A–oAA were independent of concentration. The dashed line represents the pH measured with an electrode.
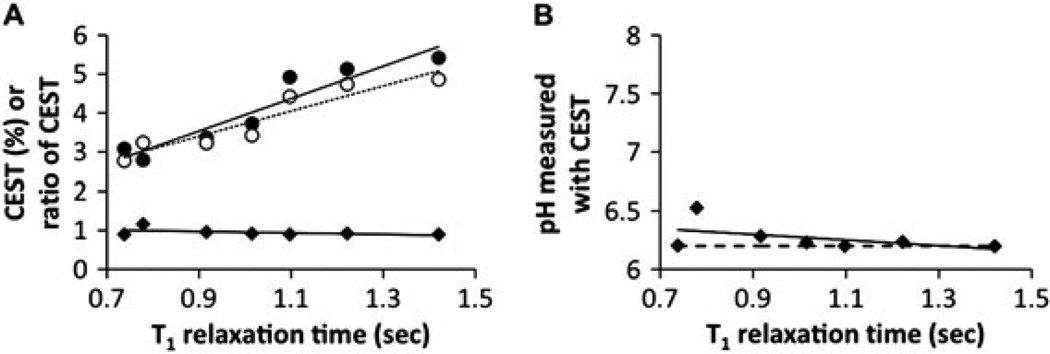
Both CEST effects of Yb–DO3A–oAA were dependent on T1 relaxation time (Fig. 7A). However, the ratio of the CEST effects was only marginally dependent on T1. Thus, the accuracy of the pH measurement was not influenced by relaxation time (Fig. 7B). The T1 relaxation times of tumor tissues in pre-clinical models at 7 T magnetic field strength is typically 2 s, which is longer than the range of this minimum T1 relaxation times in this study. However, longer relaxation times are not expected to change these results.
Figure 7.
The dependence of CEST on T1 relaxation time. (A) The percentage CEST effects of the amide (solid circles) and amine (open circles) of 30 mm of Yb–DO3A–oAA were measured at pH 7.20 and 37 °C using 10 µT saturation power. Samples were doped with Gd-DTPA to modify the T1 relaxation time. Although each CEST effect was dependent on T1, the ratio of the CEST effects were relatively independent of T1. (B) The pH values measured from the CEST effects of Yb–DO3A–oAA were independent of T1. The dashed line represents the pH measured with an electrode.
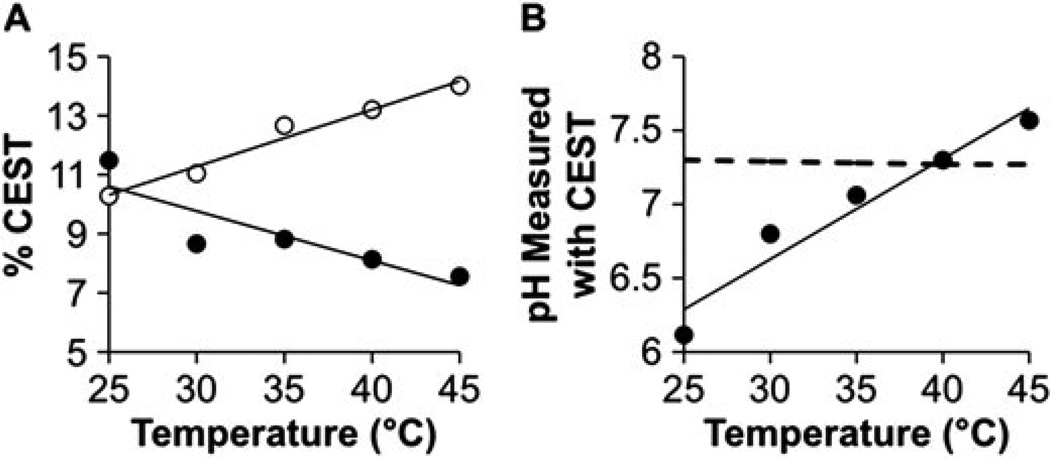
The CEST effects of Yb–DO3A–oAA were dependent on temperature (Fig. 8A). Unfortunately, the ratio of the CEST effects was also dependent on temperature, so that the measurement of pH using CEST was also dependent on temperature with a dependence of 0.068 pH units per degree Centigrade (Fig. 8B). A similar co-dependence on temperature and pH was recently reported for another PARACEST agent, Yb–HPDO3A (25). Fortunately, physiological temperature can easily be maintained at 37.0 ± 0.2 °C in pre-clinical tumor models during MRI studies that use commercially-available physiological monitoring systems. A ±0.2 °C variation in temperature will cause a ±0.014 variation in the pH measurement, which is negligible compared with other sources of variation that affect precision. Similar maintenance of stable temperature in patients may be required for clinical translation of pH measurements using CEST MRI.
Figure 8.
The dependence of CEST on temperature. (A) The percentage CEST effects of the amide (solid circles) and amine (open circles) of 30 mm of Yb–DO3A–oAA were measured at pH 7.30 using 10 µT saturation power over a range of temperatures. Linear fits of each CEST effect are shown as visual aids. (B) The pH values measured from the CEST effects of Yb–DO3A–oAA were strongly dependent on temperature (R2 = 0.94, 0.068 pH units per °C). (C) The dashed line represents the pH measured with an electrode and corrected for temperature effects.
3.4. The relationship between CEST and pH for Yb–DO3A–oAA
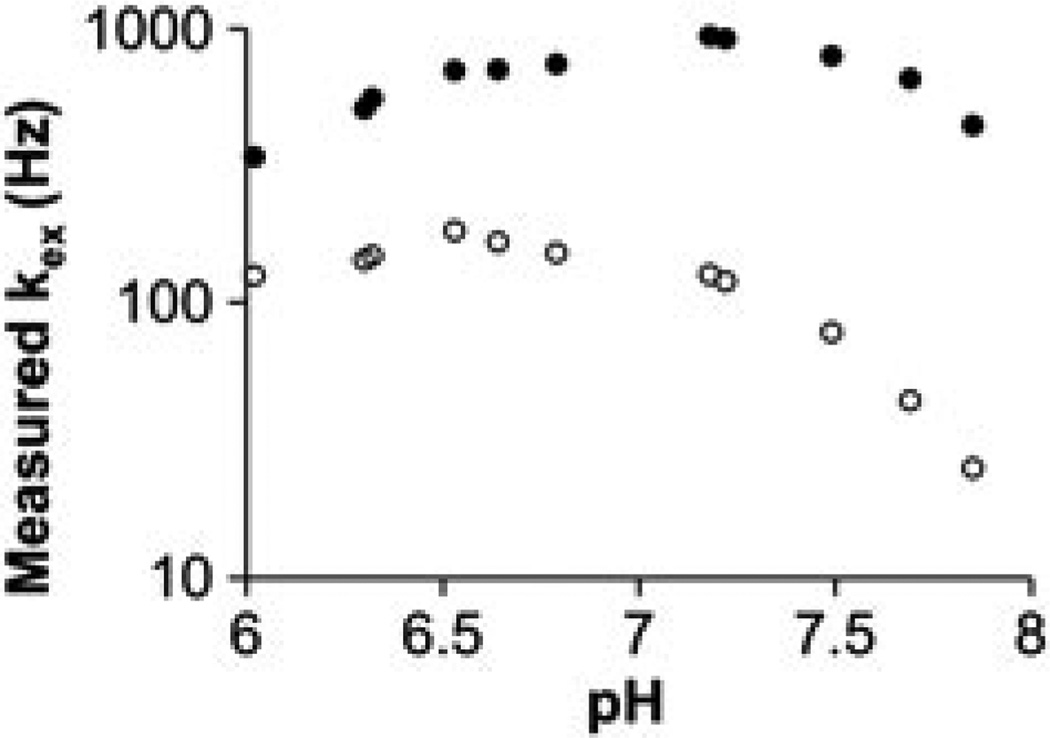
To further investigate the relationship between CEST and pH for Yb–DO3A–oAA, the QUantifying Exchange using Saturation Time (QUEST) method was used to measure the chemical exchange rates of the amide and amine throughout the physiological pH range (Fig. 9) (35). The chemical exchange rates determined by the QUEST method did not match eqn (4B), as the exchange rates did not continuously increase with increasing pH. As shown in Fig. 2, selective saturation at the chemical shifts of the amide and amine also resulted in direct saturation of some water. However, this direct saturation of water was approximately the same for all pH values (data not shown), so that direct water saturation does not explain the inconsistent, pH-dependent results of the QUEST study. Instead, only a fraction of the contrast agent concentration appears to be saturated, and this fraction of saturated agent appears to be dependent on pH. The same conclusion was reached during initial studies of the QUEST method (35).
Figure 9.
The dependence of chemical exchange measurements on pH. The QUEST method was used to measure the chemical exchange rate, kex, from the CEST effects of the amide (solid circles) and amine (open circles) of 30 mm Yb–DO3A–oAA at 38.3 °C (35). A log10 axis is used to represent kex [eqn (8)]. Although base-catalyzed exchange of the amide and amine should cause kex to increase as the pH is increased, the QUEST method measured lower kex values at high pH. This result indicates that the QUEST method cannot accurately measure kex at high pH values for Yb–DO3A–oAA.
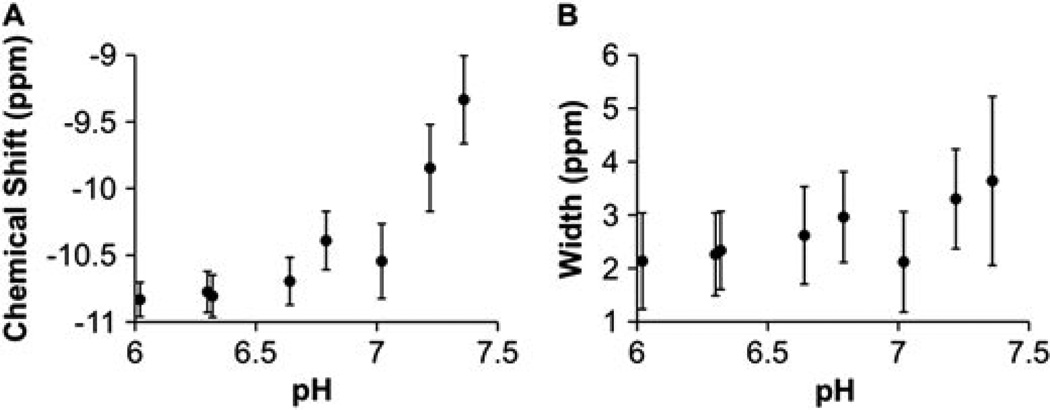
More specifically, the CEST effect requires that the chemical exchange rate is less than the chemical shift difference between the contrast agent and water (kCA < ω0). At a low pH of 6.02, the kCA for the amide and amine (340 and 125 Hz, respectively) are negligible relative to ω0 for each group (~3000 Hz at 300 MHz magnetic field strength, respectively). At high pH, kCA increases to values greater than 941 and 182 Hz for the amide and amine, respectively, which is still less than ω0 but is no longer negligible relative to ω0. A non-negligible kCA causes MR coalescence of the chemical shifts of the exchangeable protons of the contrast agent and water (40). This MR coalescence at higher pH is supported by the monotonic change in chemical shift and increase in the width of the Lorentzian line for the CEST effect of the amide as pH is increased (Fig. 10). A non-negligible kCA results in a non-negligible amount of protons on the contrast agent that are not saturated under steady-state conditions. Because kCA of the amide becomes non-negligible at lower pH values than the kCA of the amine, the concentrations of the saturated amide and saturated amine are not equal. Therefore, eqn (3) must be modified [eqn (8)].
| (8) |
Figure 10.
The dependence of CEST characteristics on pH. (A) The chemical shift of the CEST effect of the amide approached the chemical shift of water (defined as 0 ppm) as the pH was increased. (B) The width of the CEST effect of the amide increased as the pH was increased. Both of these characteristics indicate MR coalescence as the pH is increased. Error bars represent the standard deviation of nine repetitions, and these results were acquired at 38.3 °C. The chemical shift and width above pH 7.5 for the CEST effect of the amide, and the chemical shift and width at all pH values for the CEST effect of the amine, were limited by constraints imposed in the Lorentzian line fitting routine, so these results that may be affected by the fitting algorithm are not shown.
Despite the concern that the concentrations of the saturated amide and saturated amine are not equal, Fig. 4(C) shows that the log10 of the ratio of CEST effects is a linear function of pH. A log10 representation of eqn (8) shows that the effects of nCA, kCA and [CA]sat can each be independently evaluated [eqn (9)]. Because nCA is independent of pH, the first term of this log10 equation only contributes to the y-intercept of Fig. 4 (C). Because log10(kCA) is linearly dependent on pH [eqn (4B)], the second term contributes to both the y-intercept and slope of Fig. 4(C). Similarly, the third term must behave as one of the first two terms to maintain the linear relationship shown in Fig. 4(C), so that the log10 ratio of the concentrations of saturated amide and saturated amine is invariant with respect to pH or linearly dependent on pH. A potential pitfall of this analysis method is the use of logarithmic functions that temper the appearance of nonlinearity, which reduces the sensitivity of this method to variances in the ratio of concentrations of the saturated amine and amide. Still, this more sophisticated analysis provides qualitative evidence that the concentration of the saturated contrast agent does not affect the pH measurement, so that this single contrast agent can accurately measure pH without concern for pharmacokinetics that change the concentration of the agent within in vivo tissues.
| (9) |
Incomplete saturation of the amide and amine may be a potential advantage. As shown in Fig. 3, the CEST effects Yb–DO3A–oAA showed that saturation reached a steady state after 2.5 s of saturation time. Yet even shorter experiment times are an important advantage for in vivo studies. The ratiometric, log10 calibration method for pH measurements in this study offers one such opportunity to shorten saturation time, because the ratio of the two CEST effects was invariant with respect to saturation time (Fig. 3), and therefore eqn (9) can still be used to relate the CEST effects to pH. If shorter saturation times are used, an empirical CEST-pH calibration (Fig. 4C) should still be performed with these new conditions to account for differences in incomplete saturation of the amide and amine. The method of fitting a function of Lorentzian lines to the CEST spectra offers another opportunity to shorten saturation time. Unlike other fitting methods that require an understanding of the concentration of saturated contrast agent, the Lorentzian line fitting method does not include a term for concentration [eqn ((7A, 7B, 7C, 7D) and (7E))], so that incomplete saturation does not affect this analysis.
Figure 4(A, B) and 9 show that MR coalescence becomes increasingly important as pH is increased. Because MR coalescence is dependent on magnetic field strength, a calibration of a CEST agent’s dependence on pH must be empirically determined using the magnetic field that will be employed for subsequent pH studies. New contrast agents with exchangeable protons that have larger chemical shifts than Yb–DO3A–oAA may not require an empirical calibration at each high magnetic field strength if kCA is negligible relative to ω0 throughout the physiological pH range.
Translation of this contrast agent and CEST MRI methodology to in vivo studies of pH will need to consider the effects of B0 and B1 inhomogeneities, magnetization transfer effects, T2 relaxation effects that are related to chemical exchange and compartmentalization of the PARACEST agent in the vasculature, interstitial space and intracellular space. This report provides evidence that this PARACEST agent and CEST MRI methodology may address these challenges to provide in vivo measurements of tissue pH. In particular, the pH measurements should be independent of the agent’s concentration in each tissue compartment and the tissue’s T1 relaxation time. A Lorentzian line fitting procedure may be used to account for B0 and B1 in-homogeneities. The CEST effects at +10 and −10 ppm are symmetric about the water resonance, so that magnetization transfer and T2 relaxation effects may equally influence both CEST effects so that the CEST ratio is unaffected. Our research program is conducting preliminary studies to investigate in vivo pH measurements with this PARACEST agent and CEST MRI methodology (41).
4. CONCLUSIONS
This study has shown that pH may be measured using the ratio of two CEST effects from a single PARACEST agent, Yb–DO3A– oAA. The pH can be measured with a precision of 0.21 pH units, and an accuracy of 0.09 pH units. The pH measurement is independent of concentration and T1 relaxation times, but is dependent on temperature. Although MR coalescence affects the CEST measurements at high pH, the ratiometric analysis of the CEST effects can account for incomplete saturation of the agent’s amide and amine that results from MR coalescence. However, the effect of MR coalescence requires an empirical calibration of CEST and pH at each magnetic field strength.
5. EXPERIMENTAL
5.1. Sample preparation
DO3A–oAA was synthesized using a previously published procedure (28). Samples used in each study were prepared in approximately 25 mm piperazine-N,N′-bis(2-ethanesulfonic acid) (PIPES buffer) which were titrated to pH values using 1–10 µl of 6 m NaOH. These solutions were then used to create samples with final volumes of 600 µl and concentrations of 30 mm Yb–DO3A– oAA, 40 mm 2-imidazole-1-yl-3-ethoxycarbonyl propionic acid (IEPA), 10 mm trimethylsilyl propionate (TSP) and 10% D2O, unless noted otherwise. IEPA was included to validate pH using MR spectroscopy (37), TSP was included to calibrate the MR chemical shift scale, and D2O was included to optimize magnetic field homogeneity and monitor field drift. Concentrations of Yb–DO3A–oAA were corrected to reflect that concentrations of exchangeable protons are functionally reduced owing to the presence of D2O. To study the effect of T1 relaxation on pH measurements, microliter amounts of 2 mm Gd-[2-(bis{2-[carboxylato-methyl-(methylcarbamoylmethyl)amino]ethyl}amino)acetate] (Gadodiamide, Omniscan®) were added to some samples. Inductively coupled plasma mass spectrometry (ICP-MS) confirmed Yb concentrations. The pH of each solution was measured using a calibrated pH electrode and corrected for temperature effects (42).
5.2. NMR methods
All CEST experiments were performed using a 600 MHz Varian Inova NMR spectrometer with an inverse cryoprobe. Samples were analyzed at 38.3 °C unless otherwise noted. The probe was tuned to each sample, the magnet was automatically shimmed using gradient shimming, and the 90° pulse length was measured. A continuous wave presaturation pulse was used to create CEST. To investigate steady-state saturation, a series of saturation times of 0.3, 0.6, 1, 2, 3, 4 and 6 s were tested while maintaining a total time for each saturation and acquisition of 7 s to maintain consistent relaxation effects. Subsequent CEST studies were performed with a saturation time that was greater than 2.5 s. CEST spectra were acquired with a saturation frequency set at 30 to −30 ppm in 1 ppm increments, using a saturation power of 10 µT and a saturation bandwidth of 1 ppm (Fig. 2). Each scan was averaged four times. The temperature of the samples was calibrated by measuring the separation of resonances of neat methanol and ethylene glycol samples between 25 and 40 °C (43). T1 relaxation times were measured with a standard inversion-recovery pulse sequence (44).
NMR spectroscopy of IEPA was performed at 37.0 °C using a Bruker DRX600 NMR spectrometer (Fig. S2, Supporting Information). A presaturation sequence was used for water suppression. The chemical shifts of the spectra were calibrated by setting the resonance of TSP to 0.0 ppm. The pH was determined from the chemical shift of the H2 proton as described previously (37,45).
5.3. Lorentzian line Fitting
CEST spectra were fit using a model function of three Lorentzian lines in Matlab R2009B [eqn (7E)] to measure each CEST effect [eqn (1)]. The value of M0 for the amine was determined from the value at +ω0 (the MR frequency of the amine’s maximum CEST effect) for the Lorentzian line that is centered at approximately 0 ppm. A similar procedure was used to determine M0 for the amide. This method is different from the commonly used method that determines M0 by measuring the magnitude of the water signal at −ω0 (46). This other method assumes that the CEST spectrum is symmetric about the water’s chemical shift in the absence of an exchanging chemical group. Other methods have also been described that characterize the CEST effect, but these other methods also rely on the symmetry assumption (47). In the case of Yb–DO3A–oAA, this assumption is not valid because each CEST effect at ω0 is close to -ω0 for the other CEST effect. Thus a simple comparison would not accurately measure the CEST effect owing to the individual exchanging group.
5.4. Exchange rate and PARACEST
Chemical exchange rates were measured for the CEST effects of Yb–DO3A–oAA by using the QUEST method (35). The analytical method derived from the Bloch equations that include chemical exchange was used to analyze the relationship between CEST and saturation time, which was accomplished by using a least squares nonlinear curve fitting routine in Matlab R2009B (Math-works, Natick, MA, USA).
Acknowledgments
This work was supported by the Arizona Cancer Center, the Case Center for Imaging Research and the National Cancer Institute under grants CA110943, CA 023074, CA 017094 and CA133455-01. V.R.S. was supported through the US Army Medical Research and Materiel Command under grant no. W81XWH-09-1-0053 and in part by the CWRU MSTP under NIH grant no. T32 GM007250. The authors thank Dr Paloma Ballesteros of the Departemento de Química Orgánica y Biología, Facultad de Ciencias, Universidad Nacional de Educación a Distancìa, Madrid, Spain for donating IEPA.
Footnotes
SUPPORTING INFORMATION
Supporting information can be found in the online version of this article.
REFERENCES
- 1.Warburg O. On the origin of cancer cells. Science. 1956;123:309–314. doi: 10.1126/science.123.3191.309. [DOI] [PubMed] [Google Scholar]
- 2.Gillies RJ, Gatenby RA. Hypoxia and adaptive landscapes in the evolution of carcinogenesis. Cancer Met Rev. 2007;26:311–317. doi: 10.1007/s10555-007-9065-z. [DOI] [PubMed] [Google Scholar]
- 3.Raghunand N, He X, van Sluis R, Mahoney B, Baggett B, Taylor CW, Paine-Murrieta G, Roe D, Bhujwalla ZM, Gillies RJ. Enhancement of chemotherapy by manipulation of tumor pH. Br J Cancer. 1999;80(7):1005–1011. doi: 10.1038/sj.bjc.6690455. [DOI] [PMC free article] [PubMed] [Google Scholar]
- 4.Mahoney BP, Raghunand N, Baggett B, Gillies RJ. Tumor acidity, ion trapping and chemotherapeutics. I Acid pH affects the distribution of chemotherapeutic agents in vitro. Biochem Pharmacol. 2003;66(7):1207–1218. doi: 10.1016/s0006-2952(03)00467-2. [DOI] [PubMed] [Google Scholar]
- 5.Raghunand N, Mahoney BP, Gillies RJ. Tumor acidity, ion trapping and chemotherapeutics II. pH-dependent partition coefficients predict importance of ion trapping on pharmacokinetics of weakly basic chemotherapeuticagents. Biochem Pharmacol. 2003;66(7):1219–1229. doi: 10.1016/s0006-2952(03)00468-4. [DOI] [PubMed] [Google Scholar]
- 6.Thistlethwaite AJ, Leeper DB, Moylan DJ, Nerlinger RE. pH distribution in human tumors. Int J Radiation Oncol Biol Phys. 1985;11(9):1647–1652. doi: 10.1016/0360-3016(85)90217-2. [DOI] [PubMed] [Google Scholar]
- 7.Mordon S, Devoisselle JM, Maunoury V. In vivo pH measurement and imaging of tumor tissue using a pH-sensitive fluorescent probe (5,6-carboxyfluorescein): instrumental and experimental studies. Photochem Photobiol. 1994;60(3):274–279. doi: 10.1111/j.1751-1097.1994.tb05104.x. [DOI] [PubMed] [Google Scholar]
- 8.Hassan M, Riley J, Chernomordik V, Smith P, Pursley R, Lee SB, Capala J, Gandjbakhche AH. Fluorescence lifetime imaging system for in vivo studies. Mol Imag. 2007;6:229–236. [PMC free article] [PubMed] [Google Scholar]
- 9.Khramtsov VV, Grigor’ev IA, Foster MA, Lurie DJ, Nicholson I. Biological applications of spin pH probes. Cell Mol Biol. 2000;46:1361. [PubMed] [Google Scholar]
- 10.Vavere AL, Biddlecombe GB, Spees WM, Garbow JR, Wijesinghe D, Andreev OA, Engelman DM, Reshetnyak YK, Lewis JS. A novel technology for the imaging of acidic prostate tumors by positron emission tomography. Cancer Res. 2009;69:4510–4516. doi: 10.1158/0008-5472.CAN-08-3781. [DOI] [PMC free article] [PubMed] [Google Scholar]
- 11.Gillies RJ, Raghunand N, Garcia-Martin ML. Gatenby RApH imaging. A review of pH measurement methods and applications in cancers. IEEE Eng Med Biol Magn. 2004;23(5):57–64. doi: 10.1109/memb.2004.1360409. [DOI] [PubMed] [Google Scholar]
- 12.Gallagher FA, Kettunen MI, Day SE, Hu DE, Ardenkjaer-Larsen JH, Zandt R, Jensen PR, Karlsson M, Golman K, Lerche MH, Brindle KM. Magnetic resonance imaging of pH in vivo using hyperpolarized 13C-labelled bicarbonate. Nature. 2008;453:940–943. doi: 10.1038/nature07017. [DOI] [PubMed] [Google Scholar]
- 13.Yoo B, Pagel MD. An overview of responsive MRI contrast agents for molecular imaging. Front Biosci. 2008;13:1733–1752. doi: 10.2741/2796. [DOI] [PubMed] [Google Scholar]
- 14.Raghunand N, Zhang S, Sherry AD, Gillies RJ. In vivo magnetic resonance imaging of tissue pH using a novel pH-sensitive contrast agent, GdDOTP-4Amp. Acad Radiol. 2002;9(2):S481–S483. doi: 10.1016/s1076-6332(03)80270-2. [DOI] [PubMed] [Google Scholar]
- 15.Raghunand N, Howison C, Sherry AD, Zhang S, Gillies RJ. Renal and systemic pH imaging by contrast-enhanced MRI. Magn Reson Med. 2003;49:249–257. doi: 10.1002/mrm.10347. [DOI] [PubMed] [Google Scholar]
- 16.Garcia-Martin ML, Martinez GV, Raghunand N, Sherry AD, Zhang S, Gillies RJ. High resolution pHe imaging of rat glioma using pH-dependent relaxivity. Magn Reson Med. 2006;55(2):309–315. doi: 10.1002/mrm.20773. [DOI] [PubMed] [Google Scholar]
- 17.Aime S, Fedeli F, Sanino A, Terreno EA. R-2/R-1 ratiometric procedure for a concentration-independent, pH-responsive, Gd(III)-based MRI agent. J Am Chem Soc. 2006;128:11326–11327. doi: 10.1021/ja062387x. [DOI] [PubMed] [Google Scholar]
- 18.Martinez GV, Zhang X, Garcia-Martin ML, Morse DL, Woods M, Sherry AD, Gillies RJ. Imaging the extracellular pH of tumors by MRI after injection of a single cocktail of T1 and T2 contrast agents. NMR Biomed. 2011 doi: 10.1002/nbm.1701. [DOI] [PMC free article] [PubMed] [Google Scholar]
- 19.Frullano L, Catana C, Benner T, Sherry AD, Caravan P. Bimodal MR- PET agent for quantitative pH imaging. Angew Chem Int Ed. 2010;49:2382–2384. doi: 10.1002/anie.201000075. [DOI] [PMC free article] [PubMed] [Google Scholar]
- 20.Ward KM, Balaban RS. Determination of pH using water protons and chemical exchange dependent saturation transfer (CEST) Magn Reson Med. 2000;44(5):799–802. doi: 10.1002/1522-2594(200011)44:5<799::aid-mrm18>3.0.co;2-s. [DOI] [PubMed] [Google Scholar]
- 21.Longo DL, Colombo W, Dastrù W, Pogi L, Tedoldi F, Terreno E, Uggeri F, Aime S. Iopamidol as a responsive MRI-chemical exchange saturation transfer contrast agent for pH mapping of kidneys: in vivo studies in mice at 7 T. Magn Reson Med. 2011;65(1):202–211. doi: 10.1002/mrm.22608. [DOI] [PubMed] [Google Scholar]
- 22.Zhang S, Merritt M, Woessner DE, Lenkinski RE, Sherry AD. PARACEST agents: moculating MRI contrast via water proton exchange. Acc Chem Res. 2003;36:783–790. doi: 10.1021/ar020228m. [DOI] [PubMed] [Google Scholar]
- 23.Terreno E, Delli Castelli D, Cravotto G, Milone L, Aime S. Ln(III)- DOTAMGly complexes: a versatile series to assess the determinants of the efficacy of paramagnetic chemical exchange saturation transfer agents for magnetic resonance imaging applications. Invest Radiol. 2004;39:235–243. doi: 10.1097/01.rli.0000116607.26372.d0. [DOI] [PubMed] [Google Scholar]
- 24.Aime S, Delli Castelli D, Terreno E. Novel pH-reporter MRI contrast agents. Angew Chem Int Ed. 2002;41(2):4334–4336. doi: 10.1002/1521-3773(20021115)41:22<4334::AID-ANIE4334>3.0.CO;2-1. [DOI] [PubMed] [Google Scholar]
- 25.Delli Castelli D, Terreno E, Aime S. YbIII-HPDO3A: a dual pH- and temperature-responsive CEST agent. Angew Chemie Int Ed. 2011;50(8):1798–1800. doi: 10.1002/anie.201007105. [DOI] [PubMed] [Google Scholar]
- 26.Wu Y, Soesbe TC, Kiefer GE, Zhao P, Sherry AD. A responsive europium(III) chelate that provides a direct readout of pH by MRI. J Am Chem Soc. 2010;132(40):14002–14003. doi: 10.1021/ja106018n. [DOI] [PMC free article] [PubMed] [Google Scholar]
- 27.Liu G, Lu Y, Pagel MD. Design and characterization of new irreversible responsive PARACEST MRI contrast agent that detects nitric oxide. Magn Reson Med. 2007;58:1249–1256. doi: 10.1002/mrm.21428. [DOI] [PubMed] [Google Scholar]
- 28.Li Y, Sheth VR, Liu G, Pagel MD. A self-calibrating PARACEST MRI contrast agent that detects esterase enzyme activity. Contrast Media Mol Imag. 2010 doi: 10.1002/cmmi.421. [DOI] [PMC free article] [PubMed] [Google Scholar]
- 29.Woessner DE, Zhang S, Merritt ME, Sherry AD. Numerical solution of the Bloch equations provides insights into the optimum design of PARACEST agents for MRI. Magn Reson Med. 2005;53(4):790–799. doi: 10.1002/mrm.20408. [DOI] [PubMed] [Google Scholar]
- 30.Englander SW, Downer NW, Teitelbaum H. Hydrogen exchange. Annu Rev Biochem. 1972;41:903–924. doi: 10.1146/annurev.bi.41.070172.004351. [DOI] [PubMed] [Google Scholar]
- 31.Barksdale AD, Rosenberg A. Acquisition and interpretation of hydrogen exchange data from peptides, polymers, and proteins. Meth Biochem Anal. 1982;28:1–113. doi: 10.1002/9780470110485.ch1. [DOI] [PubMed] [Google Scholar]
- 32.Covington AK, Robinson RA, Bates RG. Ionization constant of deuterium oxide from 5 to 50 degrees. J Phys Chem. 1966;70(12):3820–3824. [Google Scholar]
- 33.Henkelman M, Huang X, Xiang QS, Stanisz GJ, Swanson SD, Bronskill MJ. Quantitative interpretation of magnetization transfer. Magn Reson Med. 1993;29(6):759–766. doi: 10.1002/mrm.1910290607. [DOI] [PubMed] [Google Scholar]
- 34.Aime S, Barge A, Delli Castelli D, Fedeli F, Mortillaro A, Nielsen FU, Terreno E. Paramagnetic lanthanide(III) complexes as pH-sensitive chemical exchange saturation transfer (CEST) contrast agents for MRI applications. Magn Reson Med. 2002;47:639–648. doi: 10.1002/mrm.10106. [DOI] [PubMed] [Google Scholar]
- 35.McMahon MT, Gilad AA, Zhou J, Sun PZ, Bulte JWM, van Zijl PCM. Quantifying exchange rates in chemical exchange saturation transfer agents using the saturation time and saturation power dependencies of the magnetization transfer effects on the magnetic resonance imaging signal (QUEST and QUESP): pH calibration for poly-l-lysine and a starburst dendrimer. Magn Reson Med. 2006;55:836–847. doi: 10.1002/mrm.20818. [DOI] [PMC free article] [PubMed] [Google Scholar]
- 36.Woods M, Woessner DE, Sherry AD. Paramagnetic lanthanide complexes as PARACEST agents for medical imaging. Chem Soc Rev. 2006;35:500–511. doi: 10.1039/b509907m. [DOI] [PMC free article] [PubMed] [Google Scholar]
- 37.Gil S, Zaderenzo P, Cruz F, Cerdán S, Ballesteros P. Imidazol-1-ylalkanoic acids as extrinsic 1H NMR probes for the determination of intracellular pH, extracellular pH and cell volume. Bioorg Med Chem. 1994;2:305–314. doi: 10.1016/s0968-0896(00)82186-0. [DOI] [PubMed] [Google Scholar]
- 38.Welch BL. The generalization of ‘Student’s’ problem when several different population variances are involved. Biometrika. 1947;34(1 −2):28–35. doi: 10.1093/biomet/34.1-2.28. [DOI] [PubMed] [Google Scholar]
- 39.Ali MM, Liu G, Shah T, Flask C, Pagel MD. Using two chemical exchange saturation trasnfer magnetic resonance imaging contrast agents for molecular imaging studies. Acc Chem Res. 2009;42(7):915–924. doi: 10.1021/ar8002738. [DOI] [PMC free article] [PubMed] [Google Scholar]
- 40.Gutowsky H, Cheng H. Determination of kinetic parameters by the frequency dependence of the NMR coalescence temperature. J Chem Phys. 1973;63:2439–2441. [Google Scholar]
- 41.Liu G, Li Y, Sheth VR, Pagel MD. Imaging in vivo extracellular pH with a single PARACEST MRI contrast agent. Mol Imag. 2011 doi: 10.1002/cmmi.460. (in press) [DOI] [PMC free article] [PubMed] [Google Scholar]
- 42.Bates RG. Electrometric pH Determinations: Theory and Practice. New York: Wiley; 1954. [Google Scholar]
- 43.Van Ge, et al. Calibration of the methanol and glycol nuclear magnetic resonance thermometers with a static thermistor probe. Anal Chem. 1968;40(14):2227–2229. [Google Scholar]
- 44.Henoumont C, Laurent S, Vander Elst L. How to perform accurate and reliable measurements of longitudinal and transverse relaxation times of MRI contrast media in aqueous solutions. Contrast Media Mol Imag. 2009;4(6):312–321. doi: 10.1002/cmmi.294. [DOI] [PubMed] [Google Scholar]
- 45.van Sluis R, Bhujwalla ZM, Raghunand N, Ballesteros P, Alvarez J, Cerdan S, Galons JP, Gillies RJ. In vivo imaging of extracellular pH using 1H MRSI. Magn Reson Med. 1999;41(4):743–750. doi: 10.1002/(sici)1522-2594(199904)41:4<743::aid-mrm13>3.0.co;2-z. [DOI] [PubMed] [Google Scholar]
- 46.Grad J, Bryant RG. Nuclear magnetic cross-relaxation spectroscopy. J Magn Reson. 1999;90(1):1–8. doi: 10.1002/mrm.1910170216. [DOI] [PubMed] [Google Scholar]
- 47.Terreno E, Stancanello J, Longo D, Delli Castelli D, Milone L, Sanders HMHF, Kok MB, Uggeri F, Aime S. Methods for an improved detection of the MRI-CEST effect, Contrast Media Mol Imag. 2009;4(5):237–247. doi: 10.1002/cmmi.290. [DOI] [PubMed] [Google Scholar]


