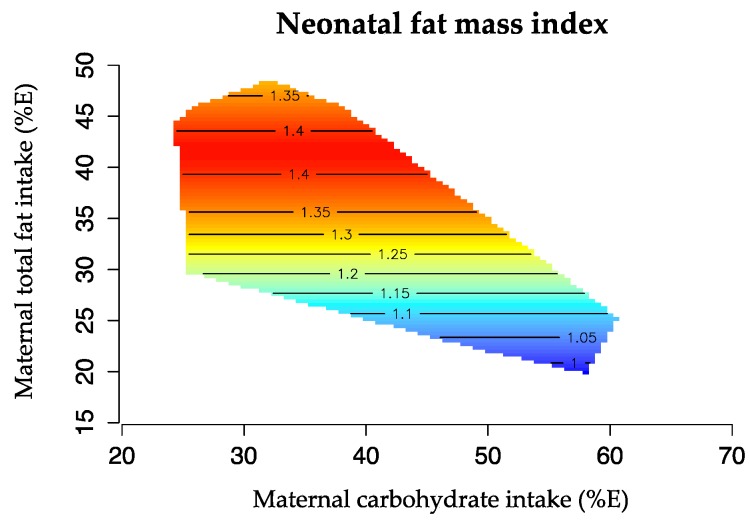
Figure 3.
Effects of maternal carbohydrate (%E) and total fat intake (%E) in late pregnancy and neonatal FMI. The isolines for the FMI rise in elevation from dark blue to dark red. Offspring FMI was greatest at high maternal intake of total fat (>40%E) and moderate intake of carbohydrate (<45%E) (n = 88).

