Abstract
Aims
In some pulmonary hypertension (PH) patients, we noted a motion pattern where the right ventricular (RV) apex is pulled towards to left ventricle (LV) during systole, caused by traction from the LV (‘apical traction’, AT). Herein, we characterize patients with AT to investigate its prognostic significance.
Methods and results
Echocardiograms of 62 pre-capillary PH patients (42 females, age 61 ± 15 years) were retrospectively analysed. The presence of AT was assessed visually and confirmed by speckle-tracking analysis. Fractional area change (FAC), tricuspid annular plane systolic excursion (TAPSE), RV free-wall longitudinal strain (LS) as well as LV function were measured. A primary end point of death or heart/lung transplantation was set. AT was observed in 31 patients. They had worse functional capacity, lower TAPSE (1.3 ± 0.2 vs. 1.9 ± 0.4, P ≤ 0.001) and FAC (20.3 ± 6.1 vs. 33 ± 7.1%, P ≤ 0.001), worse RV free-wall LS (−12.4 ± 3.4 vs. −20.8 ± 4.9%, P < 0.001), and higher systolic pulmonary arterial pressure (92 ± 15 vs. 75 ± 23, P < 0.001). LV function was similar in both groups. The primary end point occurred in 16 patients with and 8 without AT. AT was an independent predictor of the outcome (HR: 14.826, 95% CI: 1.696−129.642, P = 0.015).
Conclusion
AT occurs in RVs with impaired systolic function in PH patients. It may serve as a new, easily to assess visual parameter to predict the outcome in these patients. Its prognostic importance needs to be validated by prospective studies.
Keywords: apical traction, pulmonary hypertension, right ventricular function, speckle-tracking echocardiography, survival
Introduction
Right ventricular (RV) function has an important prognostic role in left ventricular (LV) dysfunction, pulmonary hypertension (PH), and other pathologies,1,2 and its decrease is strongly associated with clinical deterioration and higher mortality.3–6 While invasive right heart catheterization (RHC) is regarded as gold standard for the assessment of RV haemodynamics and function, echocardiography is commonly used as the first line diagnostic tool in daily clinical practice. Several quantitative parameters, such as RV ejection fraction (EF), RV fractional area change (FAC), or tricuspid annular plane systolic excursion (TAPSE), have been suggested for the assessment of RV function, but have limited feasibility and robustness.7–13 Tissue Doppler and speckle-tracking echocardiography may be an alternative, but are also strongly dependent on image quality.14–18 Therefore, an easy to assess imaging parameter with prognostic significance and limited dependence on image quality would be a welcome addition to the armamentarium of routine echocardiography.
In our clinical practice of assessing patients with PH, we have noted a specific motion pattern that is characterized by the RV apex being pulled towards LV during systole. We named this pattern ‘apical traction’ (AT) (Figure 1, see Supplementary data online, Video S1). The purpose of this study was to investigate the origin of this motion pattern, to characterize patients in whom it occurs, and to determine the diagnostic and predictive values of AT in patients with PH.
Figure 1.
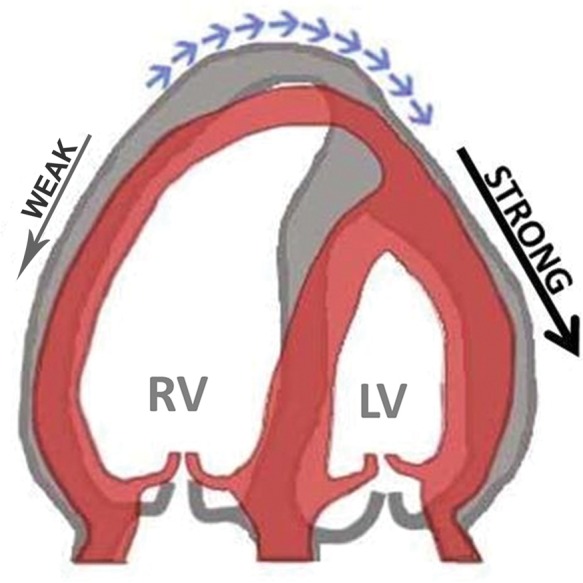
Schematic of the mechanism of apical traction as it can be observed in the apical four-chamber view. Impaired contraction of the RV and traction from the normally contracting LV results in abnormal motion of the cardiac apex towards the left (blue arrows). Grey, diastole; red, systole.
Methods
Study population and study protocol
We screened patients with confirmed pre-capillary pulmonary hypertension, referred to the University Hospital Leuven between the years 2006 and 2009. Patients under 18 years of age, with irregular heart rhythm, poor echocardiographic image quality, congenital heart defects, or shunt lesions were not considered. In total, 62 patients could be included. After inclusion, all patients received state-of-the-art PAH treatment including phosphodiesterase 5 inhibitors, endotheline receptor antagonists, prostacyclin analogues, or atrial septostomy in addition to conventional treatment at the discretion of the treating physician.
As part of the clinical routine, all patients underwent a baseline echocardiogram before the start of treatment. Patients were assigned to two groups based on the occurrence of AT (AT group/Non-AT group).
All patients were regularly seen in the PH clinic of our hospital. The follow-up period was defined as the time from baseline echocardiography to the end of the study (June 2013). All-cause mortality and heart–lung transplantation were chosen as primary end points. The study protocol was approved by the ethics committee of the University Hospital Leuven. Since the protocol was judged to pose no additional risk on the patient, the obligation for obtaining a written informed consent was waived.
Echocardiographic examination
All inclusion echocardiograms were performed before the start of PH-specific treatment on a Vivid 7 or Vivid E9 ultrasound systems (GE Vingmed Ultrasound, Horten, Norway). Image raw data were digitally stored and retrospectively analysed using a dedicated workstation (EchoPAC, BT 12, GE Vingmed Ultrasound).
Standard echocardiography
We measured RV dimensions, end-diastolic area, end-systolic area, RV FAC, and TAPSE of the free wall annulus.7 Pulmonary arterial pressure (PAP) was calculated by adding the tricuspid regurgitation peak gradient to the right atrial pressure as estimated from inferior vena cava dimension and diameter variation.7 LVEF was calculated by using modified Simpson's method.
Visual and quantitative assessment of apical traction
Occurrence of AT, defined as a motion of the RV apex towards the LV, was independently assessed by three readers, blinded to each other and any other patient-related information. In case of disagreement, a majority decision was taken. Patients were grouped according to this visual assessment.
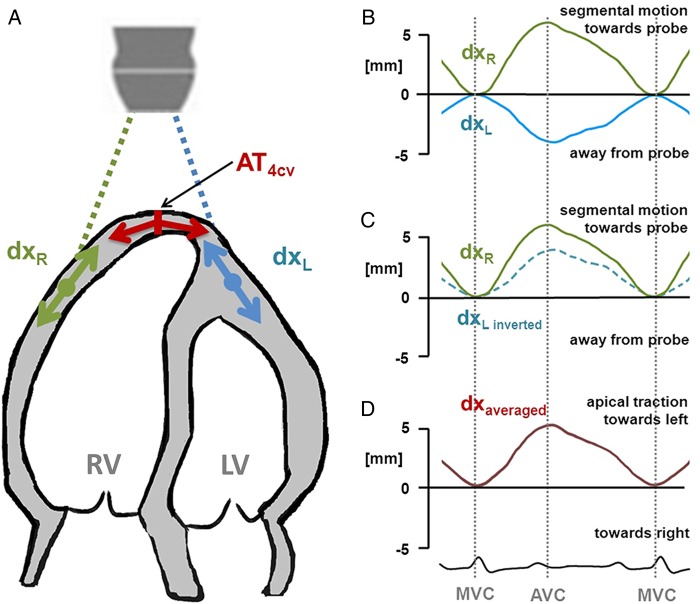
In an attempt to quantify AT, speckle tracking was performed in four-chamber-view recordings using a tracking region of interest that included the apex and the apical parts of the free walls of both ventricles. Two displacement curves were selected from the apical segments of which the left lateral was inverted before both curves were averaged (Figure 2). The amplitude of the resulting curve was considered to reflect the motion of the apex due to the tracking.
Figure 2.
Principle of the calculation of apical traction. (A) To estimate the traction of the apex (AT4CV) perpendicular to the longitudinal axis of the heart, two local displacement curves (dxL, dxR) (B) are obtained from both sides of the apex, e.g. by means of speckle tracking. (C) Then, the left-sided displacement curve (dxL) is inverted, which allows averaging. (D) Apical traction is then measured as displacement of the apex (dxaveraged) during systole, i.e. between mitral valve closure (MVC) and aortic valve closure (AVC).
Quantitative assessment of myocardial deformation
Standard speckle tracking was performed in RV and LV. Typical frame rate was 50 fps. In the LV, a horseshoe-shaped contour was drawn around the endocardium, and LV global longitudinal strain (GLS) as well as segmental longitudinal strain (LS) of LV lateral wall were measured in the apical four-chamber view and at least one more apical view. For the RV, the contour was drawn in the four-chamber view and included the RV free wall and the septum to achieve better stability of the signals, although only the data from the RV free wall were used to determine GLS and segmental LS. To provide a quantitative measure of the traction to which the cardiac apex is exposed to, the differences between RV free-wall LS and LV GLS were calculated.
Haemodynamics
RHC was performed in 56 patients. In six patients, RHC was refused by the patient or not clinically indicated due to existence of confirmed CTEPH, advanced age, or co-morbidity. Haemodynamic measurements included right atrial pressure (RAP), systolic and diastolic PAP, pulmonary capillary wedge pressure (PCWP), and mixed venous oxygen saturation (SvO2). Furthermore, we calculated mean PAP, pulmonary vascular resistance (PVR), and cardiac index according to Fick's formula.
Statistical analysis
Continuous variables are presented as mean ± standard deviation, and categorical data are presented as percentages or frequencies. Continuous variables were examined by Kolmogorov–Smirnov test to check for normality of distribution. The patient population was categorized based on having AT or not. Baseline characteristics were compared between groups using the Student t-test or the χ2 test. Correlation between AT amplitude and difference between RV free wall and LS LV GLS were tested by using Pearson correlation coefficient. Cumulative end point estimates of the two patient groups were calculated with the Kaplan–Meier method, considering the date of the first echocardiography as onset of follow-up. Significant determinants of all-cause mortality and heart–lung transplantation were assessed with the Cox proportional hazard model with backward stepwise likelihood ratio. Clinical, echocardiographic, and invasive variables, including age, gender, NYHA FC, TAPSE, cardiac index, RV free-wall LS, and AT, were analysed in a multivariable model. Gender and occurrence of AT were encoded as categorical variables, and the rest were encoded as continuous variables. The significance level for a variable to remain in the multivariable model was 0.10, and the exclusion criterion was 0.20. A two-tailed P-value of ≤0.05 was considered as statistically significant. All data were analysed using SPSS version 18.0.
Results
Classification of patients as having AT or not was concordant between all three readers in 60 of 62 patients. In only two patients, a majority decision was needed. Thirty-one patients were found to have AT. The baseline characteristics of both groups are presented in Table 1. No difference in age and gender between groups was observed. The AT group had a significantly worse NYHA functional class a shorter 6-min walking distance. The majority of the patients with AT were in NYHA class III (20/31) or IV (5/31). They also had more elevated RAP, PVR, and mean PAP, and more depressed cardiac index and lower SvO2. There was no difference in PCWP between groups.
Table 1.
Baseline characteristics of groups
| AT group (n = 31) | Non-AT group (n = 31) | P | |
|---|---|---|---|
| A. Clinical findings | |||
| Age (years) | 57 ± 16 | 64 ± 14 | 0.072 |
| Gender (female) | 19 (74.2%) | 23 (61.3%) | 0.277 |
| Aetiology | 0.007 | ||
| Anorexigens | 0 (0%) | 4 (12.9%) | |
| CTEPH | 11 (35.5%) | 18 (58.1%) | |
| Connective tissue disease | 5 (16.1%) | 5 (16.1%) | |
| Idiopathic | 15 (48.4%) | 4 (12.9%) | |
| NYHA functional class | 0.044 | ||
| 1 | 0 (0%) | 4 (12.9%) | |
| 2 | 6 (19.4%) | 10 (32.3%) | |
| 3 | 20 (58.1%) | 16 (51.6%) | |
| 4 | 5 (9.7%) | 1 (3.2%) | |
| AT group (n = 27) | Non-AT group (n = 28) | ||
| B. Measurements | |||
| 6MWD (m) | 291 ± 150 | 388 ± 157 | 0.024 |
| Heart catheterization | AT group (n = 31) | Non-AT group (n = 25) | |
| RAP (mmHg) | 7.3 ± 5.8 | 4.6 ± 3.8 | 0.048 |
| Systolic PAP (mmHg) | 82 ± 15 | 71 ± 21 | 0.040 |
| Diastolic PAP (mmHg) | 32 ± 8 | 24 ± 8 | 0.001 |
| Mean PAP (mmHg) | 49 ± 10 | 40 ± 12 | 0.004 |
| PVR (dyne × s/cm5) | 1137 ± 363 | 670 ± 338 | <0.001 |
| PCWP (mmHg) | 8.4 ± 3.8 | 7.4 ± 3.6 | 0.314 |
| Cardiac Index (L/min × m2) | 1.5 ± 0.3 | 2.3 ± 0.5 | <0.001 |
| SvO2 (%) | 58.7 ± 6.1 | 65.6 ± 9.3 | 0.002 |
Values are mean ± SD or n (%).
6MWD, 6-min walking distance; CTEPH, chronic thromboembolic pulmonary hypertension; NYHA, New York Heart Association; PAP, pulmonary artery pressure; PVR, pulmonary vascular resistance; PCWP, pulmonary capillary wedge pressure; RAP, right atrial pressure; SvO2, mixed venous oxygen saturation.
Conventional echocardiographic RV function parameters
The standard echocardiographic variables and values from myocardial deformation imaging are presented in Table 2. LVEF was not different between groups. Patients with AT had larger RV dimensions and worse RV function assessed by FAC and TAPSE. In addition, patients with AT have more elevated systolic PAP.
Table 2.
Standard echocardiographic and myocardial deformation imaging values for groups
| AT group(n = 31) | Non-AT Group (n = 31) | P | |
|---|---|---|---|
| Standard echocardiography | |||
| RV basal diameter (cm) | 5.6 ± 0.7 | 4.6 ± 0.6 | <0.001 |
| RV mid cavity diameter (cm) | 4.7 ± 0.7 | 3.5 ± 0.6 | <0.001 |
| RV longitudinal diameter (cm) | 8.0 ± 0.7 | 7.1 ± 0.8 | <0.001 |
| RV end-diastolic area (cm2) | 35.5 ± 7.5 | 26.3 ± 6.2 | <0.001 |
| RV end-systolic area (cm2) | 28.3 ± 6.9 | 17.7 ± 5.3 | <0.001 |
| RV fractional area change (%) | 20.3 ± 6.1 | 33 ± 7.1 | <0.001 |
| TAPSE (mm) | 1.3 ± 0.2 | 1.9 ± 0.4 | <0.001 |
| Systolic PAP (mm Hg) | 91.5 ± 15 | 75 ± 23 | 0.002 |
| IVC dimension (mm) | 2.1 ± 1.6 | 0.97 ± 1.51 | 0.038 |
| LV cardiac output (L/min) | 3.6 ± 0.9 | 4.7 ± 0.99 | <0.001 |
| LV ejection fraction (%) | 62 ± 3.8 | 62 ± 5 | 0.843 |
| Myocardial deformation imaging | |||
| LV GLS (%) | −20.8 ± 4.6 | −21.6 ± 3.8 | 0.418 |
| RV free-wall LS (%) | −12.4 ± 3.4 | −20.8 ± 4.9 | <0.001 |
| RV free-wall LS − LV GLS (%) | 8.4 ± 4.2 | 0.8 ± 4.7 | <0.001 |
| AT (mm) | 6.1 ± 2.4 | 0.4 ± 2.1 | <0.001 |
Values are mean ± SD or n (%).
AT, apical traction; IVC, inferior vena cava; GLS, global longitudinal strain; LS, longitudinal strain; LV, left ventricle; RV, right ventricle; PAP, pulmonary artery pressure; TAPSE, tricuspid annular plane systolic excursion.
Magnitude of AT and ventricular function
Both LV GLS and the LS of LV lateral wall were not different between groups. RV free-wall LS amplitude was significantly lower in the AT group. As a consequence, the absolute difference between RV free-wall LS and LV GLS was significantly higher in AT group which explains the traction of the cardiac apex towards the left side. The quantitative assessment of the apical motion revealed a motion amplitude of 6.1 ± 2.4 mm in the AT group and 0.4 ± 2.1 mm in the Non-AT group, respectively (P ≤ 0.001), while both, AT amplitude was significantly correlated with the RV free-wall LS − LV GLS difference (r = 0.528, P < 0.001) (Figure 3).
Figure 3.
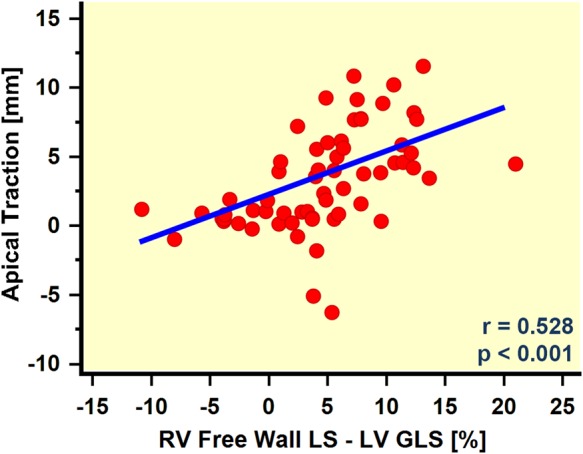
Scatter plot of the apical traction amplitude in relation to the difference between RV and LV function as measured by RV free-wall GLS and LV GLS. The regression analysis revealed a significant correlation, suggesting a relation between AT and the imbalance in RV and LV function.
Clinical outcome
The mean follow-up period in our patient population was 45.3 ± 25.3 months. The primary end point was reached in 24 patients (21 deaths and 3 transplantations). Sixteen events (13 deaths and 3 transplantations) occurred in AT group (51.6%), while only eight deaths were observed in the Non-AT group (25.8%).
Predictors of the end point assessed by univariable analysis are shown in Table 3, and Kaplan–Meier survival curves of the AT and Non-AT group are displayed in Figure 4. The cumulative rate of end points was significantly higher in the AT group (Log-rank, P = 0.033).
Table 3.
Univariable predictors of all-cause mortality/transplantation among patients
| Parameter | Hazard ratio | P-value | (95% CI) |
|---|---|---|---|
| Age (years) | 1.01 | 0.387 | 0.984–1.042 |
| Gender (m/f) | 1.59 | 0.262 | 0.705–3.607 |
| TAPSE (mm) | 0.346 | 0.015 | 0.147–0.815 |
| NYHA FC | 2.654 | 0.004 | 1.371–5.138 |
| Cardiac Index (L/min × m2) | 0.467 | 0.071 | 0.204–1.067 |
| RV Free-wall LS (%) | 1.061 | 0.1 | 0.989–1.139 |
| Apical traction (yes/no) | 2.549 | 0.040 | 1.046–6.215 |
Gender and occurrence of AT were encoded as categorical variables, and the rest was encoded as a continuous variables.
AT, apical traction; CI, confidence interval; NYHA FC, New York Heart Association functional class; LS, longitudinal strain; RV, right ventricle; TAPSE, tricuspid annular plane systolic excursion.
Figure 4.
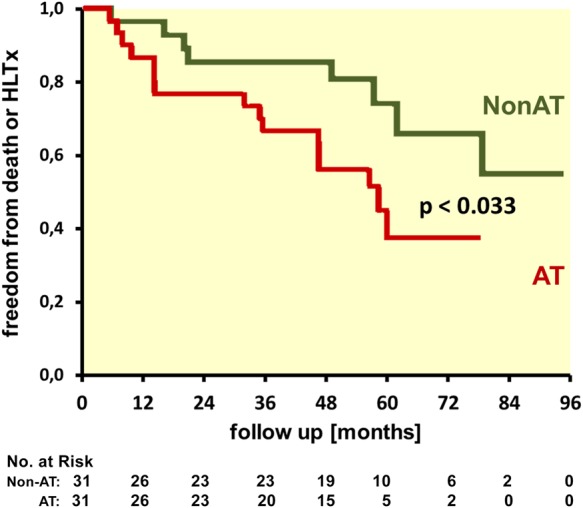
Kaplan–Meier survival curves for freedom from death or heart–lung transplant (HLTx) of patients with (AT) and without (Non-AT) apical traction.
Age, gender, TAPSE, RV free-wall LS, NYHA FC, and cardiac index (all but age and gender have P < 0.1) were included in the multivariable model (Table 4). Of these, gender, RV free-wall LS, and NYHA FC were found to be statistically significant determinants of the outcome. AT was a strong and independent predictor of the outcome with a hazard ratio of 14.8 in multivariable analysis (95% CI 1.7–129.6, P = 0.015) (Figure 5).
Table 4.
Multivariable Cox regression analysis to define predictors of all-cause mortality/transplantation
| Parameter | β | SE (β) | Hazard ratio | P-value | (95% CI) |
|---|---|---|---|---|---|
| Age (years) | 0.021 | 0.014 | 1.022 | 0.123 | 0.994–1.050 |
| Gender (m/f) | 1.219 | 0.544 | 3.382 | 0.025 | 1.163–9.833 |
| TAPSE (mm) | −1.719 | 0.887 | 0.179 | 0.053 | 0.032–1.019 |
| Cardiac Index (L/min × m2) | 1.189 | 0.724 | 3.283 | 0.100 | 0.795–13.559 |
| RV free-wall LS (%) | −0.206 | 0.085 | 0.814 | 0.016 | 0.689–0.962 |
| Apical traction (yes/no) | 2.696 | 1.106 | 14.826 | 0.015 | 1.696–129.642 |
| NYHA FC | 1.551 | 0.450 | 4.718 | 0.001 | 1.952–11.401 |
Multivariable Cox regression analysis in which co-variables are age, gender (being male), TAPSE, RV free-wall longitudinal strain, cardiac index, NYHA FC, and AT. Gender and occurrence of AT were encoded as categorical variables, and the rest were encoded as continuous variables.
β, regression coefficient; CI, confidence interval; NYHA FC, New York Heart Association functional class; LS, longitudinal strain; RV, right ventricle; SE, standard error; TAPSE, tricuspid annular plane systolic excursion.
Figure 5.
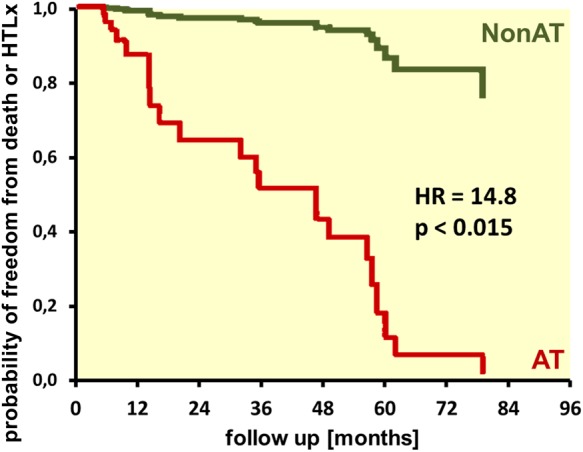
Probability of freedom from death or heart–lung transplant, with the effect of co-variables from multivariable Cox regression analysis (Table 4). AT, patients with apical traction; Non-AT, patients without apical traction.
Discussion
Main findings of the study
In a cohort of patients with pre-capillary PH, we observed in 50% a characteristic motion pattern with the cardiac apex being pulled towards the LV in the echocardiographic four-chamber view. This so-called AT could be detected with high concordance between observers. Quantitative analysis of LV and RV deformation suggests that this specific motion pattern is caused by a dysbalance between the reduced RV and relatively normal LV function. The occurrence of AT was independently associated with the worse outcome (15-fold higher mortality or heart–lung transplantation during follow-up).
Conventional assessment of RV function
PH leads to RV remodelling and dysfunction which is strongly inversely associated with the functional capacity and mortality of the patients.1,3,6 Although RHC is considered the gold standard, echocardiography has become the most widely used tool to assess RV function in daily practice as it is non-invasive and widely available. However, assessment of RV function with echocardiography is challenging due to the complex shape and retrosternal position of RV.7–9
Many conventional echocardiographic indices like RV EF, RV FAC, and TAPSE have been validated for the quantitative evaluation of RV function and shown to be related to the patient's prognosis.6 However, studies have also shown that these indices can be of limited value due to bad image quality, global heart motion, or ventricular loading conditions.7,11–14,19 Tissue Doppler and speckle tracking derived function information have been suggested for RV assessment in several populations, including patients with PH.14–18 RV LS is impaired in patients with PH and is a predictor of mortality.20–22 However, direct RV myocardial functional measurements are similarly affected by loading conditions and are highly dependent on image quality. Besides that, no normal values are available at the moment.7,18
In summary, the accurate assessment of RV function remains challenging in clinical routine and diagnosis and prognosis are commonly based on clinical judgement based on the integration of different measurements.14 Any additional parameter that helps to improve this situation would therefore be welcome.
Apical traction
In patients with PH, we frequently observed a specific motion pattern of the heart which was characterized by the cardiac apex being pulled towards the LV. It appeared particularly in patients with dilated, impaired RV when LV function was preserved (Tables 1 and 2, Figure 1). Our data indicate that the magnitude of AT depends significantly on the dysbalance in RV and LV function (Figure 3). A detailed analysis reveals that the phenomenon of AT is predominantly driven by the impaired RV function (AT vs. RV free-wall LS: r = 0.5, P < 0.001), while LV function has less effect (AT vs. LV GLS: r = −0.02, P = 0.85). RV load seems to have only minor influence on AT (AT vs. mean PAP: r = 0.28, P = 0.04).
In our population of patients with chronic pre-capillary PH who were seen for the first time before the start of a specific treatment, AT appeared in half of the cases. The blinded readings of three different observers showed a very good concordance in the detection of AT, indicating that it is a clinically feasible, easy to recognize sign. It is a particular advantage of visual AT assessment over quantitative measurement methods, which is robust and feasible even when echogenicity is limited and image geometry is sub-optimal.
Predictive value of AT
Our data indicate that the visual recognition of AT is a strong and independent predictor of patient mortality and transplant. Multivariable Cox regression analysis revealed a 14.8-fold higher risk of death or lung transplant when AT was present. Other parameters, such as NYHA FC and RV free-wall LS, were also found to be independent predictors (see Table 4) which is in agreement with large registry data.4,23 While the predictive value of AT may not be significantly superior, the parameter is practical as it uses easily available visual information for the assessment of patients with PH. Our data suggest that AT can be clinically used as a highly feasible, easy to recognize visual indicator of bad patient prognosis.
Limitations
In our study, we considered only outcome parameters, such as all-cause mortality and transplantation. We did not investigate the effect of specific therapies on AT or the usability of AT for the follow-up of patients under treatment.
Our data are based on a registry of chronic pre-capillary PH from our Pulmonary Hypertension Clinic. Being a tertiary referral centre, a selection bias is likely and the frequency of AT in a general population of chronic PH patients may be lower. However, the occurrence of a parameter to be tested in half of the patient population is an ideal situation for the evaluation of its prognostic value.
Finally, the prognostic value was examined in a single-centre retrospective analysis. A prospective and potentially multi-centric study would be desirable to confirm and validate our findings.
Conclusion
In our study, AT has been shown to offer a significant predictive value regarding all-cause mortality and heart–lung transplantation in patients with chronic pre-capillary PH. It may not be particularly superior to other, well-established parameters, but being robustly recognizable by simple visual assessment of echo images of even limited quality, it adds a new useful tool to the diagnostic armament of echocardiography. We therefore suggest AT as new prognostic echocardiographic marker for the assessment of patients with pre-capillary PH.
Supplementary data
Supplementary data are available at European Heart Journal – Cardiovascular Imaging online.
Funding
S.U. received a grant from the Erasmus Lifelong Learning Programme. K.F. received a training grant from the Greek Society of Cardiology. A.M.D. received a research grant from the Heart Failure Association of the European Society of Cardiology. J.-U.V. holds a personal research mandate of the Flemish Research Foundation.
Acknowledgements
We thank An Belmanns, MSc, PhD, for her invaluable statistical advice.
Conflict of interest: None declared.
References
- 1.McLaughlin VV, Archer SL, Badesch DB, Barst RJ, Farber HW, Lindner JR, et al. ACCF/AHA 2009 expert consensus document on pulmonary hypertension a report of the American College of Cardiology Foundation Task Force on Expert Consensus Documents and the American Heart Association developed in collaboration with the American College of Chest Physicians; American Thoracic Society, Inc.; and the Pulmonary Hypertension Association. J Am Coll Cardiol 2009;53:1573–619. [DOI] [PubMed] [Google Scholar]
- 2.Farber HW, Loscalzo J. Pulmonary arterial hypertension. N Engl J Med 2004;35:1655–65. [DOI] [PubMed] [Google Scholar]
- 3.McLaughlin VV, Presberg KW, Doyle RL, Abman SH, McCrory DC, Fortin T, et al. American College of Chest Physicians.American College of Chest Physicians. Prognosis of pulmonary arterial hypertension: ACCP evidence-based clinical practice guidelines. Chest 2004;126(1 Suppl):78–92. [DOI] [PubMed] [Google Scholar]
- 4.Humbert M, Sitbon O, Chaouat A, Bertocchi M, Habib G, Gressin V, et al. Survival in patients with idiopathic, familial, and anorexigen-associated pulmonary arterial hypertension in the modern management era. Circulation 2010;122:156–63. [DOI] [PubMed] [Google Scholar]
- 5.Ghio S, Klersy C, Magrini G, D'Armini AM, Scelsi L, Raineri C, et al. Prognostic relevance of the echocardiographic assessment of right ventricular function in patients with idiopathic pulmonary arterial hypertension. Int J Cardiol 2010;140:272–8. [DOI] [PubMed] [Google Scholar]
- 6.Galiè N, Hoeper MM, Humbert M, Torbicki A, Vachiery JL, Barbera JA, et al. ESC Committee for Practice Guidelines (CPG). Guidelines for the diagnosis and treatment of pulmonary hypertension: the Task Force for the Diagnosis and Treatment of Pulmonary Hypertension of the European Society of Cardiology (ESC) and the European Respiratory Society (ERS), endorsed by the International Society of Heart and Lung Transplantation (ISHLT). Eur Heart J 2009;30:2493–537. [DOI] [PubMed] [Google Scholar]
- 7.Rudski LG, Lai WW, Afilalo J, Hua L, Handschumacher MD, Chandrasekaran K, et al. Guidelines for the echocardiographic assessment of the right heart in adults: a report from the American Society of Echocardiography endorsed by the European Association of Echocardiography, a registered branch of the European Society of Cardiology, and the Canadian Society of Echocardiography. J Am Soc Echocardiogr 2010;23:685–713; quiz 786–88. [DOI] [PubMed] [Google Scholar]
- 8.Haddad F, Hunt SA, Rosenthal DN, Murphy DJ. Right ventricular function in cardiovascular disease, Part I: Anatomy, physiology, aging, and functional assessment of the right ventricle. Circulation 2008;117:1436–48. [DOI] [PubMed] [Google Scholar]
- 9.Greil GF, Beerbaum P, Razavi R, Miller O. Imaging the right ventricle: non-invasive imaging. Heart 2008;94:803–8. [DOI] [PubMed] [Google Scholar]
- 10.Brierre G, Blot-Souletie N, Degano B, Têtu L, Bongard V, Carrié D. New echocardiographic prognostic factors for mortality in pulmonary arterial hypertension. Eur J Echocardiogr 2010;11:516–22. [DOI] [PubMed] [Google Scholar]
- 11.Anavekar NS, Skali H, Bourgoun M, Ghali JK, Kober L, Maggioni AP, et al. Usefulness of right ventricular fractional area change to predict death, heart failure, and stroke following myocardial infarction (from the VALIANT ECHO study). Am J Cardiol 2008;101:607–12. [DOI] [PubMed] [Google Scholar]
- 12.Raymond RJ, Hinderliter AL, Willis PW, Ralph D, Caldwell EJ, Williams W, et al. Echocardiographic predictors of adverse outcomes in primary pulmonary hypertension. J Am Coll Cardiol 2002;39:1214–9. [DOI] [PubMed] [Google Scholar]
- 13.Forfia PR, Fisher MR, Mathai SC, Housten-Harris T, Hemnes AR, Borlaug BA, et al. Tricuspid annular displacement predicts survival in pulmonary hypertension. Am J Respir Crit Care Med 2006;174:1034–41. [DOI] [PubMed] [Google Scholar]
- 14.Dambrauskaite V, Delcroix M, Claus P, Herbots L, D'hooge J, Bijnens B, et al. Regional right ventricular dysfunction in chronic pulmonary hypertension. J Am Soc Echocardiogr 2007;20:1172–80. [DOI] [PubMed] [Google Scholar]
- 15.Teske AJ, De Boeck BW, Olimulder M, Prakken NH, Doevendans PA, Cramer MJ. Echocardiographic assessment of regional right ventricular function: a head-to-head comparison between 2-dimensional and tissue doppler-derived strain analysis. J Am Soc Echocardiogr 2008;21:275–83. [DOI] [PubMed] [Google Scholar]
- 16.Meris A, Faletra F, Conca C, Klersy C, Regoli F, Klimusina J, et al. Timing and magnitude of regional right ventricular function: a speckle tracking-derived strain study of normal subjects and patients with right ventricular dysfunction. J Am Soc Echocardiogr 2010;23:823–31. [DOI] [PubMed] [Google Scholar]
- 17.Vitarelli A, Terzano C. Do we have two hearts? New insights in right ventricular function supported by myocardial imaging echocardiography. Heart Fail Rev 2010;15:39–61. [DOI] [PubMed] [Google Scholar]
- 18.Valsangiacomo Buechel ER, Mertens LL. Imaging the right heart: the use of integrated multimodality imaging. Eur Heart J 2012;33:949–60. [DOI] [PubMed] [Google Scholar]
- 19.Giusca S, Dambrauskaite V, Scheurwegs C, D'hooge J, Claus P, Herbots L, et al. Deformation imaging describes right ventricular function better than longitudinal displacement of the tricuspid ring. Heart 2010;96:281–8. [DOI] [PubMed] [Google Scholar]
- 20.Haeck ML, Scherptong RW, Marsan NA, Holman ER, Schalij MJ, Bax JJ, et al. Prognostic value of right ventricular longitudinal peak systolic strain in patients with pulmonary hypertension. Circ Cardiovasc Imaging 2012;5:628–36. [DOI] [PubMed] [Google Scholar]
- 21.Sachdev A, Villarraga HR, Frantz RP, McGoon MD, Hsiao JF, Maalouf JF, et al. Right ventricular strain for prediction of survival in patients with pulmonary arterial hypertension. Chest 2011;139:1299–309. [DOI] [PubMed] [Google Scholar]
- 22.Fine NM, Chen L, Bastiansen PM, Frantz RP, Pellikka PA, Oh JK, et al. Outcome prediction by quantitative right ventricular function assessment in 575 subjects evaluated for pulmonary hypertension. Circ Cardiovasc Imaging 2013;6:711–21. [DOI] [PubMed] [Google Scholar]
- 23.Benza RL, Miller DP, Gomberg-Maitland M, Frantz RP, Foreman AJ, Coffey CS, et al. Predicting survival in pulmonary arterial hypertension: insights from the registry to evaluate early and long-term pulmonary arterial hypertension disease management (REVEAL). Circulation 2010;122:164–72. [DOI] [PubMed] [Google Scholar]


