Abstract
To clarify the potential role of coronary computed tomographic angiography (CCTA) in characterizing and prognosticating high-risk coronary plaques. A systematic review and meta-analysis were conducted to compare high-risk vs. low-risk plaques and culprit vs. non-culprit lesions in patients with acute coronary syndrome (ACS) vs. stable angina (SA). High-risk plaques were defined by at least one of the following features: non-calcified plaque (NCP), the presence of spotty calcified plaque (SCP), or increased remodelling index (RI). Results of included studies were pooled as odds ratios (OR) or weighted mean differences (WMD) with 95% confidence interval (CI). Eighteen eligible studies provided data to compare plaque types, plaque volume, and RI. Six studies provided data on ACS events in vulnerable high-risk vs. low-risk calcified plaques after 35 ± 2 months of follow-up. ACS patients had significantly higher number of NCP and SCP compared with SA patients with OR = 1.96 (1.47–2.60; 95% CI) P = 0.0001 and OR = 4.5 (2.98–6.83; 95% CI) P = 0.0001, respectively. Total plaque volume in ACS was not larger than SA: WMD = 22.9 (−22.1 to 67; 95% CI) mm3, P = 0.32, but NCP volume was significantly larger: WMD = 28.8 (10.9–46.7; 95% CI) mm3, P = 0.002. RI was higher in culprit lesions in ACS compared with SA and compared with non-culprit lesions in ACS patients: WMD = 0.48 (0.25–0.70; 95% CI) P = 0.0001 and 0.19 (0.07–0.30) P = 0.0001, respectively. The associated risk of future ACS was significantly higher in high-risk than in low-risk plaques: OR = 12.1 (5.24–28.1; 95% CI) P = 0.0001. CCTA can non-invasively characterize high-risk vulnerable coronary plaques and can predict future ACS events in patients with high-risk plaques.
Keywords: computed tomography, angiography, coronary artery, plaque, myocardial infarction
Introduction
Coronary computed tomographic angiography (CCTA) has high diagnostic accuracy and prognostic value in assessing coronary stenosis compared with the invasive coronary angiography.1,2 Importantly, CCTA has also demonstrated high diagnostic power in identifying coronary atherosclerotic plaques compared with invasive intravascular ultrasound (IVUS) and optical coherence tomography (OCT).3,4 Identification of non-calcified plaques (NCP), particularly those with low attenuation plaques (LAP), plaques with spotty calcifications (SCPs), positive remodelling with increased remodelling index (RI), and napkin-ring-like features has been considered as important features of plaque vulnerability and instability.5–12 Consequently, several CCTA studies have investigated plaque characteristics in patients presenting with acute coronary syndrome (ACS) compared with those with stable angina (SA) pectoris.5–7,10,13,14 Plaque types, volume, geometry, and structural characteristics in culprit and non-culprit lesions have been compared and debated.11,15–17 Alongside, a number of observational follow-up studies have assessed the prognostic value of vulnerable and rupture-prone plaques and their association with adverse future events, namely ACS.18,19
Currently, there is increasing interest and continuing debate on the potential role of CCTA as a non-invasive method for mapping of coronary atherosclerotic plaques for better understanding the adverse features of these plaques and the potential benefits of CCTA in guiding therapeutic interventions. Though our knowledge on coronary plaques has substantially enhanced in recent years, the hitherto published CCTA studies have been of relatively small size, with divergent results, of observational character and the associated prognosis with high-risk plaques has not been quite clear. The current systematic review and meta-analysis were therefore important to highlight and clarify the potential role of CCTA in characterizing and prognosticating coronary plaques.
Methods
Design
Systematic review and meta-analysis.
Search strategy
No industry support was provided for this systematic review and meta-analysis that was conducted according to the Preferred Reporting Items for systematic review and Meta-analysis (PRISMA).20 Search conducted in the electronic databases: PubMed, EMBASE, and Cochrane library for all published studies that examined coronary plaque characteristics in patients with ACS vs. SA using CCTA. The following keywords in different combinations were used: computed tomography, angiography, coronary artery, plaque, myocardial infarction, and prognosis. All relevant published systematic reviews and meta-analyses on this topic were identified and their reference lists were screened. Reference lists of the retrieved articles were screened as well. The literature search was restricted to published studies after year 2000 (that is after introduction of multi-slice CT technique) and up to 30 April 2015.
Study eligibility
This review constituted of two parts. The first part constituted a comparison between coronary plaque characteristics in patients with ACS vs. SA. Studies reporting comparison of the presence and number of coronary plaque types: calcified plaque (CP), NCP, spotty calcified plaque (SCP), and RI were considered eligible for analyses. The subset of LAP (HU < 30) was considered for a sub-analysis. Eligible studies should provide number of such lesions in both comparison groups as inclusion criterion. The second part constituted an estimation of the risk of development of ACS in detected high-risk vs. low-risk plaques. A high-risk lesion was defined by having at least one of these characteristics: low attenuation (study defined low HU value), positive remodelling, increased RI (>1.0), or the presence of SCPs. Studies providing the number of ACS events in each comparison arm were included in this analysis. Studies not providing relevant data were excluded.
Data extraction
Demographic, methodological, numbers of patients, and number of each type of plaque according to per-lesion (per-plaque lesions) and per-patient classification were all extracted from each study wherever available. The number of ACS events after follow-up period in the high-risk and low-risk plaque populations was extracted as well. For missing data in the text, data extraction from graphs or converting per cents to absolute numbers was performed wherever it was deemed necessary for data completeness. Means with standard deviations (SD) were calculated from medians with inter-quartile ranges, particularly in the studies that reported plaque volume.21 Two authors (C.T. and J.A.) conducted the search process, systematic literature review, and data extraction. Any conflict was resolved by consensus.
Statistics
The reported numbers of each plaque type CP, NCP, and SCP in ACS compared with the corresponding numbers in SA were pooled together providing the overall odds ratio (OR) with 95% confidence interval (CI). Similarly, we pooled the numbers of ACS patients in high-risk vs. low-risk patients to estimate the OR (95% CI) of risk of development of ACS. WMD method was used for pooling plaque volumes and RI. We used weighted fixed or random effects model depending on data heterogeneity and size of studies wherever appropriate. Heterogeneity was tested using χ2 method (with a P-value of 0.05 considered significant) and I2 statistic. The I2 (measured as 0–100%) indicated the percentage of variation in the study results attributed to between-study heterogeneity rather than sampling error. A value of I2 above 20% was considered significant. For the estimated overall OR, a P-value of 0.05 was considered significant. Meta-analysis package of the statistic software program STATA version 13 (STATA Corporation, Lakeway Drive, College Station, TX, USA) was used for all analyses.
Results
Results of the search
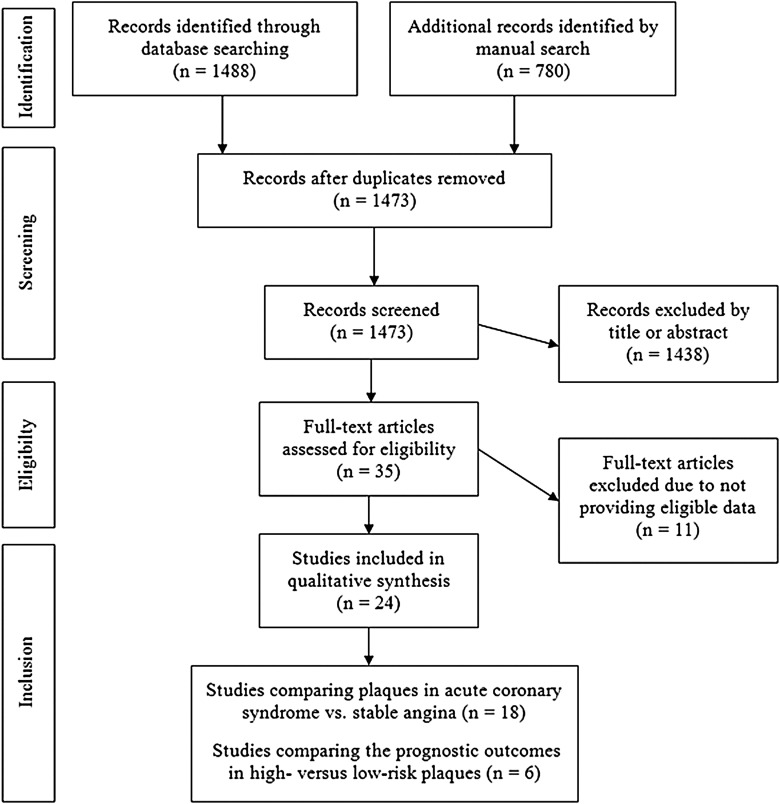
The search process and results are shown in Figure 1.
Figure 1.
Flow chart of the searching process and results.
Characteristics of the studies and patients
Eighteen studies provided data concerning coronary plaque types in ACS patients (n = 579) compared with SA patients (n = 1176), Table 1. The included studies provided data for the presence of three plaque types (CP, NCP, and CSP) which were eligible for pooled to compare ACS vs. SA at per-lesion and per-patient levels.
Table 1.
Baseline characteristic of the studies comparing patients with ACS vs. SA
| Study author | Number of included patients ACS/SA | Age (mean ± SD or CI) ACS vs. SA | Male gender (%) ACS/SA | Type of CT generation |
|---|---|---|---|---|
| Leber et al.5 | 21/19 | 64 ± 8/68 ± 9 | 86/89 | 4-slice |
| Imazeki et al.12 | 31/26 | 60 ± 12/60 ± 8 | 87/92 | 4-slice |
| Kunimasa et al.22 | 21/53 | 64 ± 1/66 ± 2 | 95/77 | 16-slice |
| Motoyama et al.23 | 38/33 | 62 ± 11/67 ± 9 | 81/70 | 16-slice |
| Hoffmann et al.11 | 14/9 | 60 ± 8/63 ± 7 | 90/93 | 16-slice |
| Pundziute et al.8 | 25/25 | 57 ± 11/61 ± 11 | 72/56 | 64-slice |
| Hammer-Hansen et al.24 | 57/19 | 58 (53–66)/57 (55–67) | 90/90 | 64-slice |
| Kitagawa et al.25 | 21/80 | 66 ± 11/69 ± 9 | 81/76 | 64-slice |
| Kim et al.17 | 35/36 | 64 ± 12/65 ± 14 | 49/47 | 64-slice |
| Pflederer et al.6 | 55/55 | 62 ± 11/64 ± 9 | 67/67 | DSCT |
| Sato et al.9 ACS/SA with abnormal MPI/normal MPI | 60/67/83 | 64 ± 10/67 ± 12/66 ± 10 | 49/40/49 | 64-slice |
| Ferencik et al.16 | 21/13 | 61 (51–67)/58 (49–65) | 86/85 | 64-slice |
| Nakanishi et al.19 | 10/124 | 68 ± 15/70 ± 11 | 60/70 | 64-slice |
| Sudarski et al.26 | 15/13 | 72 ± 9/71.4 ± 8 | 87/77 | DSCT |
| Yang et al.10 | 65/75 | 62 ± 20/63 ± 21 | 65/64 | DSCT |
| Versteylen et al.14 | 25/101 | 60 ± 11/60 ± 10 | 56/60 | 64-slice |
| Puchner et al.7 | 37/435 | 57 ± 8/53 ± 8 | 84/50 | 64- to 256-slice |
| Dey et al.15 | 14/14 | 61 ± 11/59 ± 12 | 86/86 | DSCT |
CI, confidence interval; DSCT, dual-source computed tomography; MPI, myocardial perfusion imaging.
Four studies (n = 317) provided data for comparison of quantified plaque volumes in ACS vs. SA14,15,16,26 (Table 1). Seven studies6,11,12,14,15,17,25 provided data for comparison of RI in culprit lesions in ACS vs. SA (Table 1).
There were no significant differences in the baseline demographic features between ACS and SA patients: the mean age was 62 ± 10 vs. 64 ± 10 years (P = 0.22), per cent of male gender constituted 76 vs. 60% (P = 0.73), patients with hypertension were 59 vs. 59% (P = 0.35), patients with diabetes were 26 vs. 23% (P = 0.61), and patients with hypercholesterolaemia were 56 vs. 45% (P = 0.39).
Further six studies (n = 5301)18,19,27–30 provided data investigating the outcome of ACS in vulnerable high-risk (low-density or napkin-ring) vs. low-risk (high-density or calcified) plaques, Table 2. The mean age was 64 ± 11 and per cent of males constituted 67.5% and with a mean follow-up of 35.2 months.
Table 2.
Characteristics of studies that assessed the risk of development of ACS in high- compared with low-risk plaques
| Study author | Number of included patients | Age (mean ± SD) | Male gender (%) | Type of CT equipment | Follow-up period (months) |
|---|---|---|---|---|---|
| Matsumoto et al.29 | 810 | 61 ± 13 | 70 | 16-slice | 35 |
| Motoyama et al.18 | 1059 | 64 ± 11 | 74 | 16/64-slice CT | 27 |
| Nakanishi et al.19 | 134 | 70 ± 11 | 69 | 64-slice CT | 39 |
| Yamamoto et al.27 | 511 | 68 ± 10 | 65 | 64-slice CT | 39 |
| Otsuka et al.28 | 543 | 66 ± 10 | 66 | 64-slice CT | 27 |
| Hou et al.30 | 4425 | 59 ± 11 | 62 | 64-slice CT | 36 |
Meta-analysis of the plaque type in ACS compared with SA
The included 18 studies provided variable data concerning type and number of plaques divided to per-lesion and per-patient levels in patients with ACS vs. SA. All results are shown in Figures 2–6 as forest plots with OR with 95% CI or WMDs and heterogeneity with P-values and I2%.
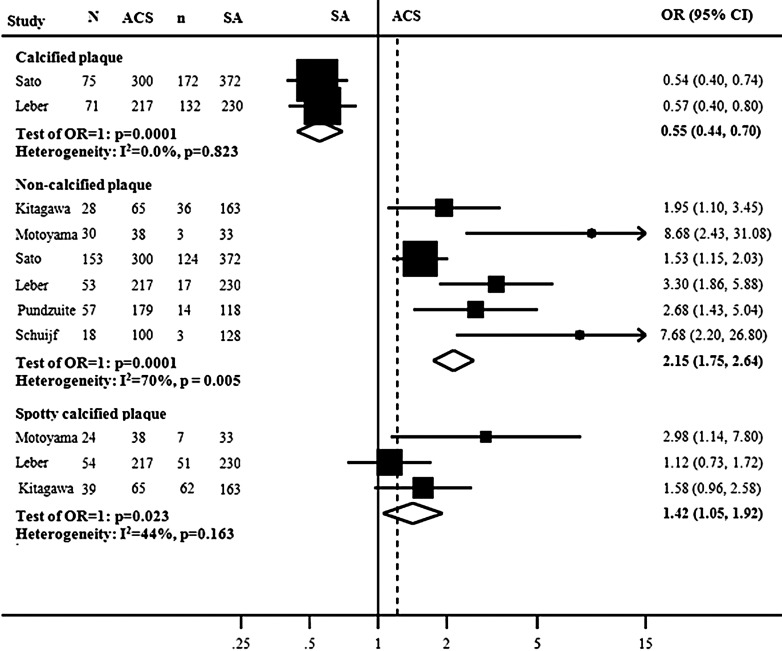
Figure 2.
Forest plot of the meta-analysis comparing the presence of per-lesion numbers of CP, NCP, and SCPs in ACS vs. those with SA patients. N, number of lesions in ACS; n, number of lesions in SA.
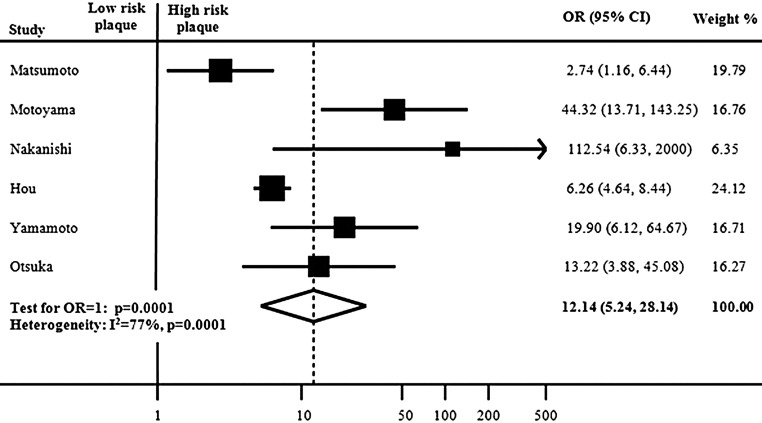
Figure 6.
Meta-analysis of the risk of future ACS associated with high/vulnerable plaques compared with low-risk plaques. CI, confidence interval; OR, odds ratio.
Six studies provided data for comparison of number of plaque types in culprit lesions in ACS vs. SA5,8,9,13,25 (Figure 2). At per-lesion plaque comparison, there were significantly less CP in the ACS than in the SA lesions: 146/517 (28%) vs. 304/602 (50%), OR for the presence of CP in ACS was 0.55 (0.44–0.70; 95% CI) and P = 0.0001. While the number of NCP was significantly higher in ACS than in SA, 339/899 (36%) vs. 197/1044 (28%), OR = 2.15 (1.75–2.64; 95% CI) and P = 0.0001. The numbers of SCP were also significantly higher in ACS than in SA lesions, 117/320 (36%) vs. 120/426 (28%), OR = 1.42 (1.05–1.92) and P = 0.023.
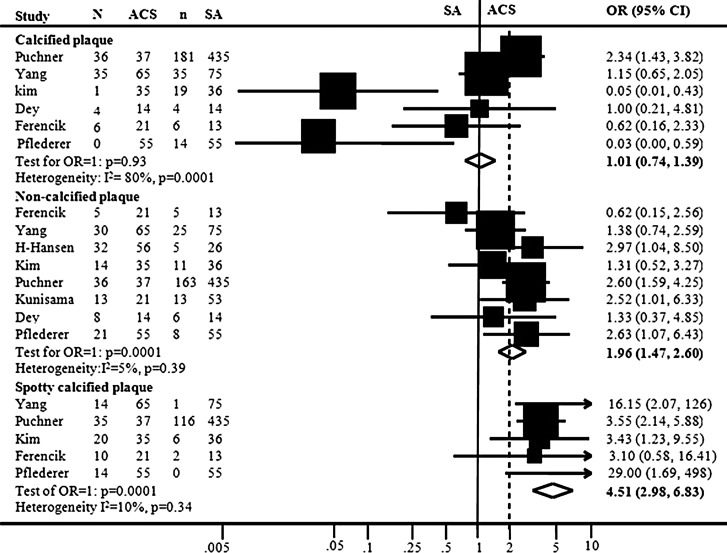
Eight studies6,7,10,15–17,22,24 compared plaque types at per-patient level (Figure 3). The numbers of CP were insignificantly higher in ACS than in SA patients, 82/172 (47%) vs. 245/573 (42%), OR = 1.21 (0.87–1.68; 95% CI) and P = 0.25. While the numbers of NCP in ACS were significantly higher in ACS than in SA patients, 138/249 (55%) vs. 228/652 (35%), OR = 1.89 (1.40–2.55; 95% CI), P = 0.0001. The numbers of SCPs were also significantly higher in ACS than in SA patients, 79/158 (50%) vs. 125/559 (22%), OR = 3.99 (2.61–6.11; 95% CI), P = 0.0001.
Figure 3.
Forest plot of the meta-analysis of studies that have compared per-patient presence of CP, NCP, and SCPs in patients with ACS vs. those with SA. CI, confidence interval; N, number of lesions in ACS; n, number of lesions in SA; OR, odds ratio.
A sub-analysis of three studies9,25,23 providing per-lesion data on the subset of LAP with HU < 30 was performed. The results of random effects model showed a significant higher number of LAP in ACS vs. SA lesions with OR = 4.1 (2.5–5.7; CI 95%), P < 0.0001.
Meta-analysis of plaque volume and remodelling index
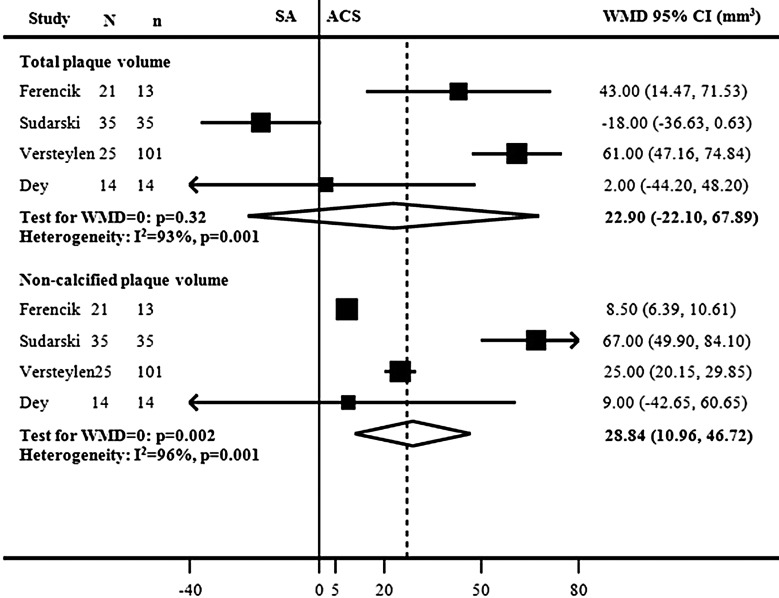
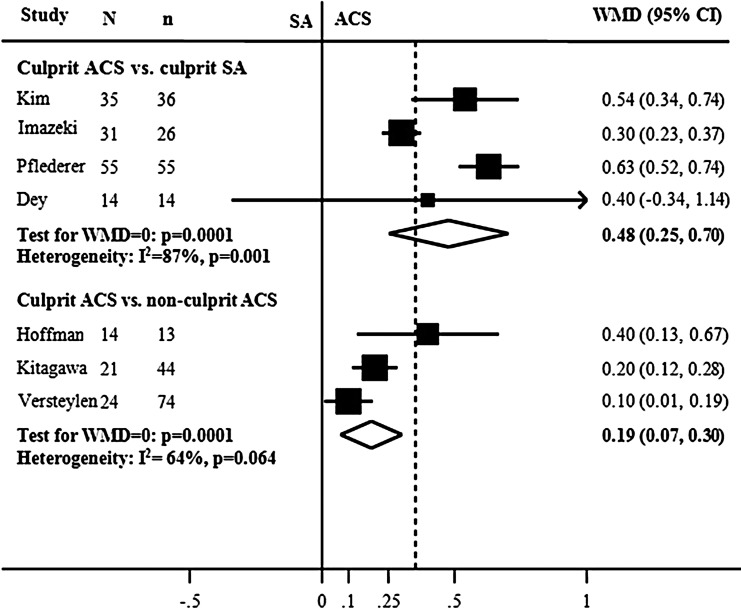
The results of pooled analyses of total plaque volume in atherosclerotic lesions in patients with ACS vs. SA showed no significant WMD of 22.9 (−22.1, 67.9; 95% CI) mm3, P = 0.32, while NCP volume was significantly larger in ACS compared with SA with a difference of 28.8 (10.9–46.7; 95% CI) mm3 (Figure 4). RI was significantly larger in culprit lesions in ACS vs. culprit lesions in SA with a mean difference of 0.48 (0.25–0.70; 95% CI) (Figure 5). Similarly, the culprit lesions had larger RI in ACS vs. non-culprit lesions in the same patients with ACS.
Figure 4.
Forest plots of the meta-analysis of total and NCP volumes in ACS vs. SA patients. CI, confidence interval; N, number of ACS patients; n, number of SA patients; WMD, weighted mean difference.
Figure 5.
Forest plots of the meta-analysis of RI of culprit lesions in ACS vs. SA patients and of culprit lesions vs. non-culprit lesions in ACS patients. CI, confidence interval; N, number of ACS patients; n, number of SA patients; WMD, weighted mean difference.
Outcome of ACS in patients with high- versus low-risk plaques
Meta-analysis of risk of ACS in low- vs. high-risk plaques in six studies (Table 2) is shown in Figure 4. At the end of the follow-up, ACS occurred in 79/3488 (2.2%) patients with low-risk plaques vs. 360/1374 (26%) patients with high-risk plaques. The risk of future ACS in high-risk plaques was significantly higher with OR of 12.14 (5.2–28.1; 95% CI), P = 0.0001 (Figure 6).
Study quality and publication bias
Six of the included 22 studies were prospectively designed5,11,13,22,23,26 while the other 16 studies were of observational character or retrospective data analysis of previous trials or databases. Investigators of CCTA data analysis were blinded, while in eight studies this was not clear.10,13,15,17,22,29,30 There was no significant publication bias, neither in the 18 studies that examined plaques, nor in the six prognostic studies, P = 0.085 and P = 0.18, respectively.
Discussion
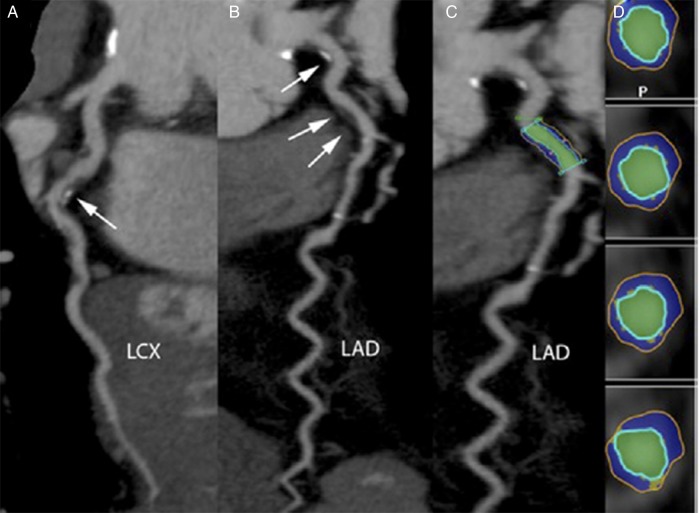
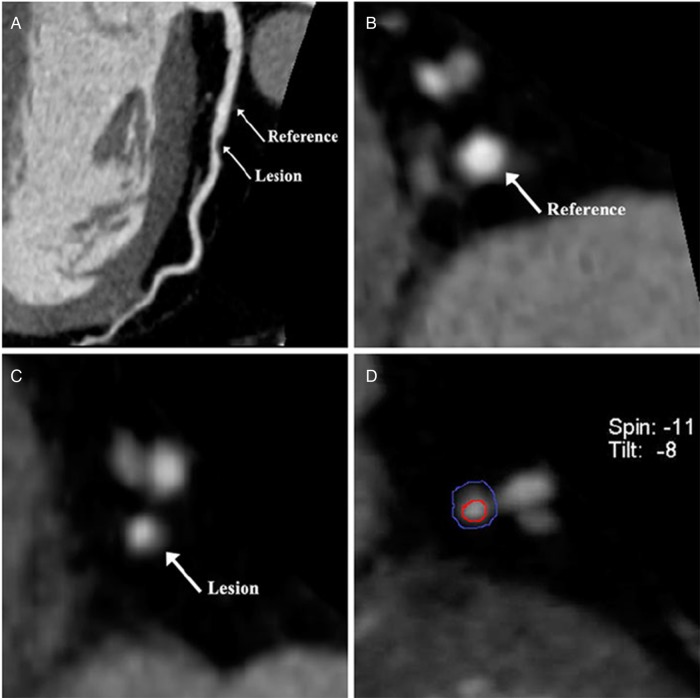
The summary results of this systematic review and meta-analyses have clearly demonstrated the potential role of CCTA in characterizing atherosclerotic coronary plaque composition and prognosticating high-risk plaques (Figures 7 and 8). CCTA was fairly able to classify the specific adverse characteristics of high-risk plaques by identifying NCP and LAP, SCP and measuring RI. These adverse atherosclerotic features demonstrated by CCTA were more frequently associated in the presence of ACS, were suggestive of instability, and predicted increased future ACS events compared with low-risk CP. Additionally, the combined results of the included studies underscored that burden of CP was not significantly higher in ACS than in SA patients and that the increased risk of ACS events was actually linked to the presence of NCP, particularly LAP, and not CP.
Figure 7.
Evaluation of coronary plaques with computed tomography. Example of a 64-year-old man presenting with non-ST-segment elevation myocardial infarction. The culprit lesion is seen in the proximal part of the left circumflex artery (LCX) (white arrow). This lesion has both calcified and non-calcified components (A). Additional non-obstructive plaques are found in the left main (single arrow) and proximal left anterior descending (LAD) artery (double arrow) (B). The plaque analysis tool applied to the lesion in a curved multiplanar reconstruction (C) and transverse sections (D). The blue colour represents NCP and yellow, calcifications. With the permission of publisher Elsevier Inc. Previously published in JACC 2011;58:502–9 by Kristensen et al.
Figure 8.
Dual-source computed tomography of a 55-year-old male patient diagnosed with angina. (A) Curved projection reconstruction of left anterior descending coronary artery plaque showing significant stenosis. Reference and lesion position are shown with arrows. (B and C) The corresponding cross-sectional area of reference and lesion position. (D) The inner circle with luminal cross-sectional area, and external circle with vascular cross-sectional area of the lesion. With the permission of publisher Springer Science + Business Media Dordrecht 2012. Previously published by Yang et al.10
The included studies classified plaques into CP, NCP, and SCP, while only few studies sub-classified NCP into LAP with HU < 30 or napkin-ring types. Different HU cut-off limits used in different laboratories presumably have weakened the estimated risk of ACS associated with LAP. Evidently, at this time, there are no substantial published data available to carry out a thorough analysis of the risk of each NCP category. Nevertheless, a sub-analysis on LAP including three studies was possible. The result of this analysis underscored that the risk of ACS was higher in association particularly with LAP than NCP.
Previous studies comparing the diagnostic accuracy of CCTA with IVUS as standard reference reported high sensitivities (90–93%) and specificities (90–92%) for detecting any plaque and reported no significant differences between CCTA vs. IVUS in detecting plaque types and volume measurements.4,31 However, the current meta-analysis added new information about the ability of CCTA to stratify the risk of different high-risk plaques, whereas the risk of the presence of SCP was estimated 2.5-fold higher than NCP in ACS compared with SA patients. Furthermore, CCTA demonstrated significant differences in plaque volume and RI between culprit vs. non-culprit lesions in the same ACS patients and vs. culprit lesions in those with SA. Culprit lesions in ACS patients were characterized by larger NCP and with increased RI compared with those with SA.
The estimated risk of developing ACS in patients with vulnerable high-risk plaques was substantially higher (12-fold) than those with low-risk plaques over 3 years of follow-up. Previously, many studies have shown that CCTA is able to prognosticate future major cardiac events according to the severity of coronary stenosis.2 However, it has also been reported that recurrent ACS has a stronger relationship to the presence of culprit lesions with thin capsule fibrous atheroma rather than those with moderate degree of coronary obstruction.32 In this context, it can be stated that the current meta-analysis supported the latter piece of evidence by demonstrating the strong link between adverse features of coronary plaques and future ACS. Our findings interestingly suggest that 82% of ACS in high-risk plaques came from only 33% of the total population of the current meta-analysis, which was substantially higher than 18% ACS in the low-risk plaques that came from 67% of the total population. This again underscores the importance of identifying high-risk plaques by CCTA.
Compared with IVUS and OCT, CCTA is non-invasive with less discomfort and may be a more cost-effective method. Besides, CCTA is undergoing continuous technical improvements and may in the future characterize more accurately coronary plaques. In this regard, CCTA may be helpful in relation with revascularization procedures.
Based on the above-mentioned findings, changes in plaque morphology and composition guided by CCTA might be one of the unique tools to investigate the effect of therapeutic interventions to reduce risk of ACS. Today, all patients with ACS are indeed being treated with statins, which raises the question on whether statins can help SA or asymptomatic patients with vulnerable plaques with the purpose of preventing future ACS. Small size and observational studies examining the effect of statins have shown some promising results;33–35 nevertheless large-size trials with longer follow-up period are needed to confirm the favourable effect of statins on plaque regression and prevention of future ACS.
Limitations
The included studies in this meta-analysis were of relatively selected patients and of small size populations; therefore, the results should be interpreted cautiously due to possible selection bias. Differences in baseline characteristics and methodology might have induced heterogeneity between studies. The analyses of plaque characteristics were based mostly on per-patient type, while the per-lesion data were smaller and probably more relevant. It was also unclear whether some of the studies were of blinded design concerning plaque analysis by investigators, which may have contributed with some observer bias. Visual plaque assessment may also introduce some bias. The included studies investigated actual culprit lesions after occurrence of ACS, which means that the early features of acute lesions may in the meantime have changed to some extent. Low attenuation plaques were defined as HU varying between 60 and 150; this was also true concerning the definition of CPs that varied between studies from 130 to 220 HU, all these may have contributed with some heterogeneity.
Implications
The results of this meta-analysis underscore the clinical importance of high-risk atherosclerotic plaques characterized by CCTA. Therefore, clinicians are encouraged to careful management of the associated risk factors, to intensify the prophylactic treatment, and carefully follow-up these patients to prevent future myocardial infarction. CCTA may also provide useful information on high-risk coronary lesions prior to invasive catheterization and subsequently revascularization.
Conclusions
We conclude that CCTA can non-invasively provide reliable characterization of coronary plaques, can assess high-risk plaque, and can predict future ACS events. These findings support more attention and careful management of patients with high-risk atherosclerotic lesions. Interventional randomized control trials guided by CCTA are warranted to investigate whether specific therapies can improve the clinical outcomes.
Conflict of interest: None declared.
References
- 1.Abdulla J, Abildstrom SZ, Gotzsche O, Christensen E, Kober L, Torp-Pedersen C. 64-Multislice detector computed tomography coronary angiography as potential alternative to conventional coronary angiography: a systematic review and meta-analysis. Eur Heart J 2007;28:3042–50. [DOI] [PubMed] [Google Scholar]
- 2.Abdulla J, Asferg C, Kofoed KF. Prognostic value of absence or presence of coronary artery disease determined by 64-slice computed tomography coronary angiography a systematic review and meta-analysis. Int J Cardiovasc Imaging 2011;27:413–20. [DOI] [PubMed] [Google Scholar]
- 3.Nakazato R, Otake H, Konishi A, Iwasaki M, Koo BK, Fukuya H, et al. Atherosclerotic plaque characterization by CT angiography for identification of high-risk coronary artery lesions: a comparison to optical coherence tomography. Eur Heart J Cardiovasc Imaging 2015;16:373–9. [DOI] [PubMed] [Google Scholar]
- 4.Voros S, Rinehart S, Qian Z, Joshi P, Vazquez G, Fischer C, et al. Coronary atherosclerosis imaging by coronary CT angiography: current status, correlation with intravascular interrogation and meta-analysis. JACC Cardiovasc Imaging 2011;4:537–48. [DOI] [PubMed] [Google Scholar]
- 5.Leber AW, Knez A, White CW, Becker A, von Ziegler F, Muehling O, et al. Composition of coronary atherosclerotic plaques in patients with acute myocardial infarction and stable angina pectoris determined by contrast-enhanced multislice computed tomography. Am J Cardiol 2003;91:714–8. [DOI] [PubMed] [Google Scholar]
- 6.Pflederer T, Marwan M, Schepis T, Ropers D, Seltmann M, Muschiol G, et al. Characterization of culprit lesions in acute coronary syndromes using coronary dual-source CT angiography. Atherosclerosis 2010;211:437–44. [DOI] [PubMed] [Google Scholar]
- 7.Puchner SB, Liu T, Mayrhofer T, Truong QA, Lee H, Fleg JL, et al. High-risk plaque detected on coronary CT angiography predicts acute coronary syndromes independent of significant stenosis in acute chest pain: results from the ROMICAT-II trial. J Am Coll Cardiol 2014;64:684–92. [DOI] [PMC free article] [PubMed] [Google Scholar]
- 8.Pundziute G, Schuijf JD, Jukema JW, Decramer I, Sarno G, Vanhoenacker PK, et al. Evaluation of plaque characteristics in acute coronary syndromes: non-invasive assessment with multi-slice computed tomography and invasive evaluation with intravascular ultrasound radiofrequency data analysis. Eur Heart J 2008;29:2373–81. [DOI] [PubMed] [Google Scholar]
- 9.Sato A, Ohigashi H, Nozato T, Hikita H, Tamura M, Miyazaki S, et al. Coronary artery spatial distribution, morphology, and composition of nonculprit coronary plaques by 64-slice computed tomographic angiography in patients with acute myocardial infarction. Am J Cardiol 2010;105:930–5. [DOI] [PubMed] [Google Scholar]
- 10.Yang X, Gai L, Dong W, Liu H, Sun Z, Tian F, et al. Characterization of culprit lesions in acute coronary syndromes compared with stable angina pectoris by dual-source computed tomography. Int J Cardiovasc Imaging 2013;29:945–53. [DOI] [PubMed] [Google Scholar]
- 11.Hoffmann U, Moselewski F, Nieman K, Jang IK, Ferencik M, Rahman AM, et al. Noninvasive assessment of plaque morphology and composition in culprit and stable lesions in acute coronary syndrome and stable lesions in stable angina by multidetector computed tomography. J Am Coll Cardiol 2006;47:1655–62. [DOI] [PubMed] [Google Scholar]
- 12.Imazeki T, Sato Y, Inoue F, Anazawa T, Tani S, Matsumoto N, et al. Evaluation of coronary artery remodeling in patients with acute coronary syndrome and stable angina by multislice computed tomography. Circ J 2004;68:1045–50. [DOI] [PubMed] [Google Scholar]
- 13.Schuijf JD, Beck T, Burgstahler C, Jukema JW, Dirksen MS, De RA, et al. Differences in plaque composition and distribution in stable coronary artery disease versus acute coronary syndromes; non-invasive evaluation with multi-slice computed tomography. Acute Card Care 2007;9:48–53. [DOI] [PubMed] [Google Scholar]
- 14.Versteylen MO, Kietselaer BL, Dagnelie PC, Joosen IA, Dedic A, Raaijmakers RH, et al. Additive value of semiautomated quantification of coronary artery disease using cardiac computed tomographic angiography to predict future acute coronary syndrome. J Am Coll Cardiol 2013;61:2296–5. [DOI] [PubMed] [Google Scholar]
- 15.Dey D, Achenbach S, Schuhbaeck A, Pflederer T, Nakazato R, Slomka PJ, et al. Comparison of quantitative atherosclerotic plaque burden from coronary CT angiography in patients with first acute coronary syndrome and stable coronary artery disease. J Cardiovasc Comput Tomogr 2014;8:368–74. [DOI] [PubMed] [Google Scholar]
- 16.Ferencik M, Schlett CL, Ghoshhajra BB, Kriegel MF, Joshi SB, Maurovich-Horvat P, et al. A computed tomography-based coronary lesion score to predict acute coronary syndrome among patients with acute chest pain and significant coronary stenosis on coronary computed tomographic angiogram. Am J Cardiol 2012;110:183–9. [DOI] [PMC free article] [PubMed] [Google Scholar]
- 17.Kim SY, Kim KS, Seung MJ, Chung JW, Kim JH, Mun SH, et al. The culprit lesion score on multi-detector computed tomography can detect vulnerable coronary artery plaque. Int J Cardiovasc Imaging 2010;26:245–52. [DOI] [PubMed] [Google Scholar]
- 18.Motoyama S, Sarai M, Harigaya H, Anno H, Inoue K, Hara T, et al. Computed tomographic angiography characteristics of atherosclerotic plaques subsequently resulting in acute coronary syndrome. J Am Coll Cardiol 2009;54:49–57. [DOI] [PubMed] [Google Scholar]
- 19.Nakanishi K, Fukuda S, Shimada K, Ehara S, Inanami H, Matsumoto K, et al. Non-obstructive low attenuation coronary plaque predicts three-year acute coronary syndrome events in patients with hypertension: multidetector computed tomographic study. J Cardiol 2012;59:167–75. [DOI] [PubMed] [Google Scholar]
- 20.Moher D, Shamseer L, Clarke M, Ghersi D, Liberati A, Petticrew M, et al. Preferred reporting items for systematic review and meta-analysis protocols (PRISMA-P) 2015 statement. Syst Rev 2015;4:1. [DOI] [PMC free article] [PubMed] [Google Scholar]
- 21.Hozo SP, Djulbegovic B, Hozo I. Estimating the mean and variance from the median, range, and the size of a sample. BMC Med Res Methodol 2005;5:13. [DOI] [PMC free article] [PubMed] [Google Scholar]
- 22.Kunimasa T, Sato Y, Sugi K, Moroi M. Evaluation by multislice computed tomography of atherosclerotic coronary artery plaques in non-culprit, remote coronary arteries of patients with acute coronary syndrome. Circ J 2005;69:1346–51. [DOI] [PubMed] [Google Scholar]
- 23.Motoyama S, Kondo T, Sarai M, Sugiura A, Harigaya H, Sato T, et al. Multislice computed tomographic characteristics of coronary lesions in acute coronary syndromes. J Am Coll Cardiol 2007;50:319–26. [DOI] [PubMed] [Google Scholar]
- 24.Hammer-Hansen S, Kofoed KF, Kelbaek H, Kristensen T, Kuhl JT, Thune JJ, et al. Volumetric evaluation of coronary plaque in patients presenting with acute myocardial infarction or stable angina pectoris-a multislice computerized tomography study. Am Heart J 2009;157:481–7. [DOI] [PubMed] [Google Scholar]
- 25.Kitagawa T, Yamamoto H, Horiguchi J, Ohhashi N, Tadehara F, Shokawa T, et al. Characterization of noncalcified coronary plaques and identification of culprit lesions in patients with acute coronary syndrome by 64-slice computed tomography. JACC Cardiovasc Imaging 2009;2:153–60. [DOI] [PubMed] [Google Scholar]
- 26.Sudarski S, Fink C, Sueselbeck T, Kayed H, Schoenberg SO, Borggrefe M, et al. Quantitative analysis of coronary plaque composition by dual-source CT in patients with acute non-ST-elevation myocardial infarction compared to patients with stable coronary artery disease correlated with virtual histology intravascular ultrasound. Acad Radiol 2013;20:995–3. [DOI] [PubMed] [Google Scholar]
- 27.Yamamoto H, Kitagawa T, Ohashi N, Utsunomiya H, Kunita E, Oka T, et al. Noncalcified atherosclerotic lesions with vulnerable characteristics detected by coronary CT angiography and future coronary events. J Cardiovasc Comput Tomogr 2013;7:192–9. [DOI] [PubMed] [Google Scholar]
- 28.Otsuka K, Fukuda S, Tanaka A, Nakanishi K, Taguchi H, Yoshiyama M, et al. Prognosis of vulnerable plaque on computed tomographic coronary angiography with normal myocardial perfusion image. Eur Heart J Cardiovasc Imaging 2014;15:332–40. [DOI] [PubMed] [Google Scholar]
- 29.Matsumoto N, Sato Y, Yoda S, Nakano Y, Kunimasa T, Matsuo S, et al. Prognostic value of non-obstructive CT low-dense coronary artery plaques detected by multislice computed tomography. Circ J 2007;71:1898–3. [DOI] [PubMed] [Google Scholar]
- 30.Hou ZH, Lu B, Gao Y, Jiang SL, Wang Y, Li W, et al. Prognostic value of coronary CT angiography and calcium score for major adverse cardiac events in outpatients. JACC Cardiovasc Imaging 2012;5:990–9. [DOI] [PubMed] [Google Scholar]
- 31.Fischer C, Hulten E, Belur P, Smith R, Voros S, Villines TC. Coronary CT angiography versus intravascular ultrasound for estimation of coronary stenosis and atherosclerotic plaque burden: a meta-analysis. J Cardiovasc Comput Tomogr 2013;7:256–66. [DOI] [PubMed] [Google Scholar]
- 32.Stone GW, Maehara A, Lansky AJ, De BB, Cristea E, Mintz GS, et al. A prospective natural-history study of coronary atherosclerosis. N Engl J Med 2011;364:226–35. [DOI] [PubMed] [Google Scholar]
- 33.Burgstahler C, Reimann A, Beck T, Kuettner A, Baumann D, Heuschmid M, et al. Influence of a lipid-lowering therapy on calcified and noncalcified coronary plaques monitored by multislice detector computed tomography: results of the New Age II Pilot Study. Invest Radiol 2007;42:189–95. [DOI] [PubMed] [Google Scholar]
- 34.Hoffmann H, Frieler K, Schlattmann P, Hamm B, Dewey M. Influence of statin treatment on coronary atherosclerosis visualised using multidetector computed tomography. Eur Radiol 2010;20:2824–33. [DOI] [PubMed] [Google Scholar]
- 35.Kitagawa T, Yamamoto H, Horiguchi J, Ohashi N, Kunita E, Utsunomiya H, et al. Effects of statin therapy on non-calcified coronary plaque assessed by 64-slice computed tomography. Int J Cardiol 2011;150:146–50. [DOI] [PubMed] [Google Scholar]


