Abstract
Three-dimensional organization of genomes affects critical cellular processes such as transcription, replication, and DNA repair. While previous studies have investigated the natural role the three-dimensional organization plays in limiting a possible set of genomic rearrangements following DNA repair, the influence of specific organizational principles on this process, particularly over longer evolutionary time scales, remains relatively unexplored. In budding yeast S. cerevisiae, chromosomes are organized into a Rabl-like configuration, with clustered centromeres and telomeres tethered to the nuclear periphery. Hi-C data for S. cerevisiae shows that a consequence of this Rabl-like organization is that regions equally distant from centromeres are more frequently in contact with each other, between arms of both the same and different chromosomes. Here we detect rearrangement events in Saccharomyces species using an automatic approach, and observe increased rearrangement frequency between regions with higher contact frequencies. Together, our results underscore how specific principles of 3D chromosomal organization can influence evolutionary events.
Keywords: rearrangements, translocations, Hi-C, chromatin, chromosomes, yeasts, Saccharomyces cerevisiae
1. Introduction
Three-dimensional spatial organization of genomes plays a key role in cellular processes ranging from gene expression, replication, and DNA repair.4,9,11 Importantly, microscopy and genomics approaches show that genomes are organized at multiple hierarchical levels.4,9,11 A number of studies have considered the importance of higher-order chromosome organization for determining translocations and somatic alterations in such processes as VDJ recombination, a process by which T and B lymphocytes assemble gene segments into mature immunoglobulin genes, and cancer.20,17,19,28,13,18,8,6,25 Higher-order chromosome organization has a natural role in these processes by limiting the potential partners for repair of a particular double-strand break,19 and can be understood in the context of a micro-evolutionary process as imposing a different mutation rate for different possible rearrangements8 Fewer studies have considered how 3D organization might shape genome evolution at larger evolutionary time scales.24,27,22,5 Moreover, these studies have fairly generally considered the connection between the 3D chromosome organization and evolutionary rearrangements, rather than the evolutionary impact of specific principles of chromosome organization.
Budding yeast has a particularly well-characterized higher-order chromosome organization.29 Specifically, the chromosome organization is well-described by a Rabl-like configuration, where centromeres are clustered at the spindle pole body (SPB) and telomeres are localized at the nuclear periphery.14,12,15,3,7 Importantly, the Rabl clustering has chromosome-wide consequences. In particular, high-throughput imaging of subtelomeres demonstrates that the short chromosome arms are located in a small region near the SPB, and cannot explore the entire nuclear space, whereas longer arms extend away from the SPB.21 In addition, Hi-C shows that that regions at equal distances from the centromere tend to come in contact more frequently;7 in other words, chromosomal arms are statistically aligned (Fig. 1A). Remarkably, using simulations, multiple groups found that a limited set of geometric constraints could provide good genome-wide agreement with Hi-C data,23,26 and illustrate how the statistical alignment of chromosomal arms can emerge from physical principles. These studies demonstrate the degree to which budding yeast are well-characterized by a Rabl-like organization. This well-characterized chromosomal organization makes budding yeast an ideal system for testing the connection between specific principles of higher order organization and evolutionary events.
Fig. 1.

Computational procedures applied to demonstrate the impact of spatial alignment of chromosomal arms on rearrangement frequency. (A) |X − Y| as a measure of spatial alignment between genes located on different chromosomes in the Rabl-like configuration, where X and Y are the genomic distances between these genes and centromeres. (B) A scheme illustrating the inference of synteny. A table of homologous genes centered on the ancestral gene G is downloaded from YGOB. Homology pillars are highlighted in gray. Genes Gcentral and Gother are assumed to be syntenic if they are located within 20 genes from each other in both the extant and ancestral genomes. (C) Prediction of rearrangements as events between two synteny blocks (highlighted in gray) located at different chromosomes in the extant yeast genome, and at the same chromosome within 20 genes from each other in the ancestral genome.
Here we study the connection between the history of chromosome rearrangements and the three-dimensional genome organization in yeast. We first develop an algorithm for predicting genome rearrangement events by comparison of yeast species. Using these predicted rearrangements, we find that rearrangement partners in S. cerevisiae demonstrate a higher contact probability via Hi-C relative to other genes. We then generalized this connection, and show that rearrangement partners tend to be more equally distant from their respective centromeres, in agreement with the Rabl-like chromosome organization. This allowed us to test whether other yeast species, where Hi-C data is not yet available, display a similar evolutionary pattern. Indeed, we found this pattern, suggesting a general importance of the Rabl-like organization for rearrangements, across Saccaromyces species, as well as Tetrapisispora phaffii.
2. Methods
2.1. Rearrangement data
We downloaded ordered lists of genes and manually curated sets of homologous genes for all genomes available in the Yeast Gene Order Browser (YGOB, http://wolfe.gen.tcd.ie/ygob/, Version 7).2 Similar to Gordon et al.10, a sliding window approach was used to infer the syntenic context in the sets of homologous genes. However, instead of manual screening in YGOB, we developed an automatic algorithm.
2.2. An algorithm to infer the syntenic context
YGOB provides an ordered list of genes in the predicted ancestral yeast genome, before the whole-genome duplication event.10 For each ancestral gene G in this list, we run wget command to download the table of homologous genes from the YGOB web page focused on G within a window of 20 genes (wget http://ygob.ucd.ie/cgi/browser/tab.pl?ver=Latest&win=20&gene=G). The downloaded table has as many rows as the total number of yeast species in YGOB, plus the predicted ancestor. Columns of the table are referred to as homology pillars. The pillar containing G is referred to as the central pillar. For each organism O, except the predicted ancestor, we check if the corresponding row has a gene (Gcentral) in the central pillar. For each gene (Gother) in other pillars, we check if there is a homologous gene in the predicted ancestor. Genes Gcentral and Gother are assumed to be syntenic if they are located within 20 genes from each other in the genome O (Fig. 1B). After that, we group all pairs of genes syntenic between O and the ancestral genome into synteny blocks by the single linkage approach.
2.3. Validation of the algorithm
Rearrangements were defined as events between two genes located at the ends of synteny blocks at different chromosomes (or on different arms of the same chromosome) in the extant yeast genome, and within 20 genes from each other in the ancestral genome (Fig. 1C). We predicted rearrangements for S.cerevisiae using our algorithm, and compared them with rearrangements predicted manually in Gordon et al.10 for the same species (Supplementary Tables 1–3). Most rearrangements matched exactly (70) or with up to 20Kb precision (17) between two prediction methods, and ten rearrangements shared one partner gene. However, 22 rearrangements were predicted by the automatic method only, and 26 rearrangements were predicted by the manual method only.
2.4. Control and bootstrapping procedures
Control pairs of genes were constructed by random switching of rearrangement partners between pairs of genes with a predicted rearrangement event. Because the number of rearrangements was not large, we applied a bootstrapping procedure to account for distortions caused by possible outliers. Bootstrapping across rearrangements was done as random sampling with replacement of pairs of genes with a predicted rearrangement event, repeated 1000 times. To estimate the q-value for the bootstrapping, we calculated the median of each bootstrap and compared the distribution of these medians to the median of the control gene pairs using Student’s t-test.
3. Results
We applied our algorithm (see Methods) to infer the syntenic context in genomes of four Saccharomyces species and T. phaffii available in Yeast Gene Order Browser.2 If two genes were located at the ends of synteny blocks at different chromosomes (or on different arms of the same chromosome) in the extant yeast genome, and within 20 genes from each other in the ancestral yeast genome predicted in Gordon et al,10 there likely had been a rearrangement event between these two genes (Fig. 1C). This yielded 119 rearrangement events in S. cerevisiae, 120 events in S. kudriavzevii, 127 events in S. mikatae, 119 events in S. uvarum, and 125 events in T. phaffii (Supplementary Tables 4–8). All these species have sixteen chromosomes. Given the importance of the Rabl-like organization in yeast, changes in chromosome numbers might influence the distances between centromeres and rearrangements emerging during the evolutionary history.
We first compared the set of rearrangements observed for S. cerevisiae with Hi-C data1 to test whether genes involved in rearrangements were more likely to interact in S. cerevisiae. We processed the Hi-C data as described in Lajoie et al.16 and produced a 20Kb binned, genome-wide interaction frequency matrix. Only pairs of genes located at different chromosomes or at different arms of the same chromosome were considered. We separately considered genes located near centromeres (0≤X<250Kb and 0≤Y<250Kb) and more remote from centromeres (250≤X<500Kb and 250≤Y<500Kb). Pairs of genes with a rearrangement event in 0–250Kb from the centromere demonstrated 1.27 fold higher average contact frequency than control pairs of genes (see Methods) in the same range of distances from the centromere (Wilcoxon test p-value = 0.017, Fig. 2A, left green and gray boxplots). No significant excess was observed for the 250–500Kb range, where the contact probability becomes uniform on the between-chromosome contact map (Wilcoxon test p-value > 0.1, Fig. 2A, right green and gray boxplots). Our result was robust to bootstrapping across rearrangements (see Methods, q-value = 0.004, Fig. 2A, left yellow and gray boxplots). Control pairs of genes demonstrated no difference in the spatial distance for regions of aligned or not aligned chromosomal arms (Wilcoxon test p-value > 0.1, Fig. 2, two gray boxplots). Note that the 250Kb threshold was selected as the best estimate of the distance from the centromere where aligned chromosome arms become separated (Table 1).
Fig. 2.
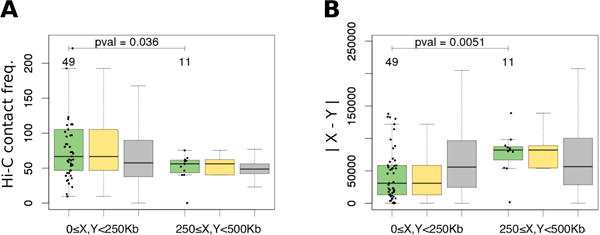
Spatial distance between genes X and Y with a predicted rearrangement event (green boxplots), bootstrapped rearrangements (yellow boxplots) and control gene pairs (gray boxplots) in S.cerevisiae, measured as (A) Hi-C contact frequency and (B) |X − Y| estimated via the linear distance to the centromere. Three left boxplots show genes located near centromere (0≤X<250Kb and 0≤Y<250Kb); three right boxplots show genes located at a distance from centromere (250≤X<500Kb and 250≤Y<500Kb). All boxes show quartiles and the median of the data, the whiskers extend to the minimum and maximum data values located within 1.5 interquartile range from the box. The numbers above the boxplots show the number of observations in the boxplots and the Wilcoxon test p-values between regions of aligned or not aligned chromosomal arms (two green boxplots).
Table 1.
Selection of the best estimate of the distance from the centromere where aligned chromosome arms become separated.
| Ranges of distances | # Rearr. | Hi-C contact freq. | |X − Y| | ||
|---|---|---|---|---|---|
| P-value | Fold change | P-value | Fold change | ||
| 0–200Kb and 200–400Kb | 44 and 10 | 0.023 | 2.27 | 0.11 | 1.30 |
| 0–225Kb and 225–450Kb | 46 and 11 | 0.016 | 2.29 | 0.0085 | 1.59 |
| 0–250Kb and 250–500Kb | 49 and 11 | 0.036 | 2.14 | 0.0051 | 1.72 |
| 0–275Kb and 275–550Kb | 57 and 9 | 0.12 | 2.00 | 0.11 | 1.21 |
| 0–300Kb and 300–600Kb | 64 and 9 | 0.37 | 1.65 | 0.051 | 1.52 |
Note: Wilcoxon test p-values and fold changes of average spatial distances were calculated between two ranges of distances from the rearrangement event to the centromere. Spatial distance between genes X and Y with a predicted rearrangement event was measured as Hi-C contact frequency or |X − Y| estimated via the linear distance to the centromere.
We then reasoned that if the enrichment seen upon comparing S. cerevisiae rearrangements with the Hi-C data reflects the Rabl-induced alignment of chromosomal arms, we could use this to test for a similar signal in other species where Hi-C data is currently unavailable. In particular, Hi-C demonstrates that the Rabl-like configuration implies that regions equidistant from centromeres come in more frequent contact; in turn, we would observe a preference for rearrangements at locations equidistant from centromeres. Towards this end, for pairs of genes with a predicted rearrangement event, we compared their genomic distances to centromeres, X and Y, and computed |X − Y| as a measure of alignment between them in the Rabl-like configuration (Fig. 1A).
Following this logic, we found that pairs of genes involved in rearrangement events indeed had 1.49 fold smaller average difference in distance |X − Y| to the centromere in S. cerevisiae for the 0–250Kb region than in controls, validating our approach (Wilcoxon test p-value = 0.001, Fig. 2B, left green and gray boxplots). Consistent with our comparison to Hi-C data, the observed tendency of rearrangement partners to be equally distant from the centromere disappeared for 250–500Kb range (Wilcoxon test p-value > 0.1, Fig. 2B, right green and gray boxplots).
We then tested whether this effect held across all five yeast species considered. Intriguingly, we found this effect was visible not only in Saccharomyces species but also in T. phaffi (Fig. 3) suggesting a Rabl-like chromosome configuration in T. phaffii, where little was previously known about 3D chromosomal organization.
Fig. 3.
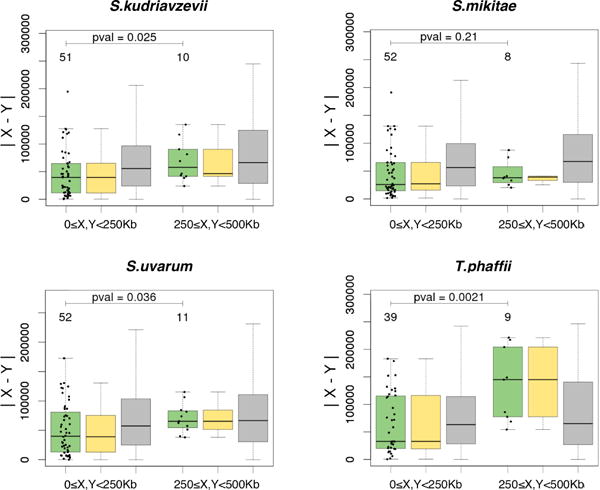
The distance |X − Y| estimated via the linear distance to the centromere for genes X and Y with a predicted rearrangement event (green boxplots), bootstrapped rearrangements (yellow boxplots) and control gene pairs without rearrangements (gray boxplots). Panels demonstrate different yeast species. Notations are as in Fig. 2.
Repeating the analysis using public rearrangements data10 for S. cerevisiae confirmed our observations (Fig. 4). To test whether our results were robust to possible translocations between subtelomeric regions, we repeated the same analysis excluding 75Kb regions closest to telomeres, and found that it had not affected the qualitative results: 1.34 fold change in Hi-C contact frequency and 1.40 fold change in distance |X − Y| to the centromere for the 0–250Kb region had disappeared for the 250–500Kb range.
Fig. 4.
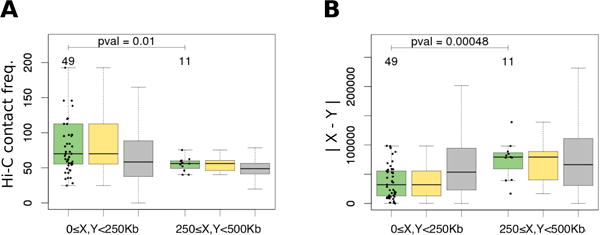
Spatial distance between genes X and Y with a rearrangement event predicted in Gordon et al.10 for S.cerevisiae, measured as (A) Hi-C contact frequency and (B) |X − Y| estimated via the linear distance to centromere. Notations are in as Fig. 2.
4. Conclusions
Taken together, our results show that the spatial organization of yeast genome in the Rabl-like configuration plays an important role in the selection of rearrangement partners over evolutionary timescales. First, our analyses of Hi-C data show that genes involved in rearrangement events demonstrate much higher contact frequency with each other. Second, we find that considering this in the context of the Rabl-like configuration, where genes equally distant from the centromere are more likely to encounter each other, allows us to extend our analyses to other closely related yeast species. Finally, we speculate that chromosomes in T. phaffi might adopt a Rabl-like conformation, similar to Saccharomyces species chromosomes.
Supplementary Material
Acknowledgments
We thank Olga Bochkareva for fruitful discussions on rearrangement prediction methods. This study was supported by the NIH grant GM114190 (to L.A.M. and G.F.), and by the Russian Science Foundation grant 14-24-00155 (to M.S.G. and E.E.K.).
Biographies
Ekaterina E. Khrameeva graduated from the Moscow State University in 2009, and received a Ph.D. degree in bioinformatics from the Institute for Information Transmission Problems in 2015. She worked as a bioinformatician at the Justus Liebig University, the Helmholtz Zentrum Mnchen, the Partner Institute for Computational Biology, and the Leiden University Medical Center. Her research interests are quite diverse, including identification of RNA structures regulating splicing, protein-RNA interactions, 3D structure of chromatin, and Neanderthal legacy in extant genomes.
Geoffrey Fudenberg received the B.A. degree in physics from Columbia University in 2004, and a Ph.D. degree in biophysics from Harvard University in 2015. During his Ph.D. he studied 3D genomic organization and developed computational methods for analyzing and simulating chromosome organization in the lab of Leonid Mirny.
Leonid A. Mirny is a researcher interested in biophysics of chromosomal organization and dynamics of cancer progression. Following his appointment to the MIT faculty in 2001 he has been teaching classes in Quantitative Genomics, Statistical Physics in Biology, and Statistical Physics. A 1998 Harvard University graduate with a Ph.D. in Biophysics, Prof. Mirny was a Junior Fellow at the Harvard Society of Fellows. He attended the Weizmann Institute of Science (Msc’94, Chemistry) and the Moscow Engineering Physics Institute (Dip’92, Physics).
Mikhail S. Gelfand is the Head of the Research and Training Center in Bioinformatics of the Institute for Information Transmission Problems and a Professor at the Department of Bioengineering and Bioinformatics of the Moscow State University. He graduated from the Moscow State University, received his Ph.D. (Math.) degree from the Institute of Theoretical and Experimental Biophysics, and the Doctor of Sciences degree from the State Research Institute of Genetics and Selection of Industrial Microorganisms. His research interests include comparative genomics, evolution of metabolic pathways and regulatory systems, function and evolution of alternative splicing, functional annotation of genes and regulatory signals.
Contributor Information
E.E. Khrameeva, Email: e.khrameeva@skoltech.ru, ekhrameeva@gmail.com, Institute for Information Transmission Problems (the Kharkevich Institute), Russian Academy of Sciences, Bolshoy Karetny per. 19, build. 1, Moscow, 127051, Russian Federation; Skolkovo Institute of Science and Technology, Skolkovo Innovation Center, build. 3, Moscow, 143026, Russian Federation.
G. Fudenberg, Email: geoff.fudenberg@gmail.com, Department of Physics, Massachusetts Institute of Technology, 77 Massachusetts Avenue, Cambridge, Massachusetts 02139, United States of America.
M.S. Gelfand, Email: mikhail.gelfand@gmail.com, gelfand@iitp.ru, Institute for Information Transmission Problems (the Kharkevich Institute), Russian Academy of Sciences, Bolshoy Karetny per. 19, build. 1, Moscow, 127051, Russian Federation; Faculty of Bioengineering and Bioinformatics, M.V. Lomonosov Moscow State University, Leninskiye Gory 1-73, Moscow, 119991, Russian Federation.
L.A. Mirny, Email: leonid@mit.edu, Department of Physics, Massachusetts Institute of Technology, 77 Massachusetts Avenue, Cambridge, Massachusetts 02139, United States of America.
References
- 1.Belton JM, Dekker J. Hi-C in Budding Yeast. Cold Spring Harbor Protocols. 2015;2015(7) doi: 10.1101/pdb.prot085209. pdb.prot085209. URL http://cshprotocols.cshlp.org/content/2015/7/pdb.prot085209.abstract. [DOI] [PubMed] [Google Scholar]
- 2.Byrne KP, Wolfe KH. The Yeast Gene Order Browser: combining curated homology and syntenic context reveals gene fate in polyploid species. Genome research. 2005;15(10):1456–61. doi: 10.1101/gr.3672305. URL http://www.pubmedcentral.nih.gov/articlerender.fcgi?artid=1240090\&tool=pmcentrez\&rendertype=abstract. [DOI] [PMC free article] [PubMed] [Google Scholar]
- 3.Bystricky K, Heun P, Gehlen L, Langowski J, Gasser SM. Long-range compaction and flexibility of interphase chromatin in budding yeast analyzed by high-resolution imaging techniques. Proceedings of the National Academy of Sciences of the United States of America. 2004;101(47):16495–500. doi: 10.1073/pnas.0402766101. URL http://www.pubmedcentral.nih.gov/articlerender.fcgi?artid=534505\&tool=pmcentrez\&rendertype=abstract. [DOI] [PMC free article] [PubMed] [Google Scholar]
- 4.Cremer T, Cremer C. Chromosome territories, nuclear architecture and gene regulation in mammalian cells. Nature reviews Genetics. 2001;2(4):292–301. doi: 10.1038/35066075. URL http://dx.doi.org/10.1038/35066075. [DOI] [PubMed] [Google Scholar]
- 5.Dai Z, Xiong Y, Dai X. Neighboring genes show interchromosomal colocalization after their separation. Molecular biology and evolution. 2014;31(5):1166–72. doi: 10.1093/molbev/msu065. URL http://mbe.oxfordjournals.org/content/early/2014/02/21/molbev.msu065.full. [DOI] [PubMed] [Google Scholar]
- 6.De S, Michor F. DNA replication timing and long-range DNA interactions predict mutational landscapes of cancer genomes. Nature biotechnology. 2011;29(12):1103–8. doi: 10.1038/nbt.2030. URL http://dx.doi.org/10.1038/nbt.2030. [DOI] [PMC free article] [PubMed] [Google Scholar]
- 7.Duan Z, Andronescu M, Schutz K, McIlwain S, Kim YJ, Lee C, Shendure J, Fields S, Blau CA, Noble WS. A three-dimensional model of the yeast genome. Nature. 2010;465(7296):363–7. doi: 10.1038/nature08973. URL http://www.pubmedcentral.nih.gov/articlerender.fcgi?artid=2874121\&tool=pmcentrez\&rendertype=abstract. [DOI] [PMC free article] [PubMed] [Google Scholar]
- 8.Fudenberg G, Getz G, Meyerson M, Mirny LA. High order chromatin architecture shapes the landscape of chromosomal alterations in cancer. Nature biotechnology. 2011;29(12):1109–13. doi: 10.1038/nbt.2049. URL http://dx.doi.org/10.1038/nbt.2049. [DOI] [PMC free article] [PubMed] [Google Scholar]
- 9.Gibcus JH, Dekker J. The hierarchy of the 3D genome. Molecular cell. 2013;49(5):773–82. doi: 10.1016/j.molcel.2013.02.011. URL http://www.sciencedirect.com/science/article/pii/S1097276513001391. [DOI] [PMC free article] [PubMed] [Google Scholar]
- 10.Gordon JL, Byrne KP, Wolfe KH. Additions, losses, and rearrangements on the evolutionary route from a reconstructed ancestor to the modern Saccharomyces cerevisiae genome. PLoS genetics. 2009;5(5):e1000485. doi: 10.1371/journal.pgen.1000485. URL http://www.pubmedcentral.nih.gov/articlerender.fcgi?artid=2675101\&tool=pmcentrez\&rendertype=abstract. [DOI] [PMC free article] [PubMed] [Google Scholar]
- 11.Gorkin DU, Leung D, Ren B. The 3D genome in transcriptional regulation and pluripotency. Cell stem cell. 2014;14(6):762–75. doi: 10.1016/j.stem.2014.05.017. URL http://www.sciencedirect.com/science/article/pii/S1934590914002045. [DOI] [PMC free article] [PubMed] [Google Scholar]
- 12.Guacci V, Hogan E, Koshland D. Centromere position in budding yeast: evidence for anaphase A. Molecular biology of the cell. 1997;8(6):957–72. doi: 10.1091/mbc.8.6.957. URL http://www.pubmedcentral.nih.gov/articlerender.fcgi?artid=305706\&tool=pmcentrez\&rendertype=abstract. [DOI] [PMC free article] [PubMed] [Google Scholar]
- 13.Hakim O, Resch W, Yamane A, Klein I, Kieffer-Kwon KR, Jankovic M, Oliveira T, Bothmer A, Voss TC, Ansarah-Sobrinho C, Mathe E, Liang G, Cobell J, Nakahashi H, Robbiani DF, Nussenzweig A, Hager GL, Nussenzweig MC, Casellas R. DNA damage defines sites of recurrent chromosomal translocations in B lymphocytes. Nature. 2012;484(7392):69–74. doi: 10.1038/nature10909. URL http://www.pubmedcentral.nih.gov/articlerender.fcgi?artid=3459314\&tool=pmcentrez\&rendertype=abstract. [DOI] [PMC free article] [PubMed] [Google Scholar]
- 14.Jin Q, Fuchs J, Loidl J. Centromere clustering is a major determinant of yeast interphase nuclear organization. J Cell Sci. 2000;113(11):1903–1912. doi: 10.1242/jcs.113.11.1903. URL http://jcs.biologists.org/content/113/11/1903.long. [DOI] [PubMed] [Google Scholar]
- 15.Jin Q, Trelles-Sticken E, Scherthan H, Loidl J. Yeast nuclei display prominent centromere clustering that is reduced in nondividing cells and in meiotic prophase. The Journal of cell biology. 1998;141(1):21–9. doi: 10.1083/jcb.141.1.21. URL http://www.pubmedcentral.nih.gov/articlerender.fcgi?artid=2132713\&tool=pmcentrez\&rendertype=abstract. [DOI] [PMC free article] [PubMed] [Google Scholar]
- 16.Lajoie BR, Dekker J, Kaplan N. The Hitchhikers guide to Hi-C analysis: Practical guidelines. Methods. 2015;72:65–75. doi: 10.1016/j.ymeth.2014.10.031. URL http://www.ncbi.nlm.nih.gov/pubmed/25448293. [DOI] [PMC free article] [PubMed] [Google Scholar]
- 17.Misteli T. Higher-order genome organization in human disease. Cold Spring Harbor perspectives in biology. 2010;2(8):a000794. doi: 10.1101/cshperspect.a000794. URL http://cshperspectives.cshlp.org/content/2/8/a000794.long. [DOI] [PMC free article] [PubMed] [Google Scholar]
- 18.Rocha PP, Chaumeil J, Skok JA. Molecular biology. Finding the right partner in a 3D genome. Science (New York, NY) 2013;342(6164):1333–4. doi: 10.1126/science.1246106. URL http://www.sciencemag.org/content/342/6164/1333.full. [DOI] [PMC free article] [PubMed] [Google Scholar]
- 19.Roukos V, Misteli T. The biogenesis of chromosome translocations. Nature cell biology. 2014;16(4):293–300. doi: 10.1038/ncb2941. URL http://dx.doi.org/10.1038/ncb2941. [DOI] [PMC free article] [PubMed] [Google Scholar]
- 20.Roukos V, Voss TC, Schmidt CK, Lee S, Wangsa D, Misteli T. Spatial Dynamics of Chromosome Translocations in Living Cells. Science. 2013;341(6146):660–664. doi: 10.1126/science.1237150. URL http://www.sciencemag.org/content/341/6146/660.long. [DOI] [PMC free article] [PubMed] [Google Scholar]
- 21.Therizols P, Duong T, Dujon B, Zimmer C, Fabre E. Chromosome arm length and nuclear constraints determine the dynamic relationship of yeast subtelomeres. Proceedings of the National Academy of Sciences of the United States of America. 2010;107(5):2025–30. doi: 10.1073/pnas.0914187107. URL http://www.pubmedcentral.nih.gov/articlerender.fcgi?artid=2836701\&tool=pmcentrez\&rendertype=abstract. [DOI] [PMC free article] [PubMed] [Google Scholar]
- 22.Thévenin A, Ein-Dor L, Ozery-Flato M, Shamir R. Functional gene groups are concentrated within chromosomes, among chromosomes and in the nuclear space of the human genome. Nucleic acids research. 2014;42(15):9854–61. doi: 10.1093/nar/gku667. URL http://nar.oxfordjournals.org/content/early/2014/07/22/nar.gku667.full. [DOI] [PMC free article] [PubMed] [Google Scholar]
- 23.Tjong H, Gong K, Chen L, Alber F. Physical tethering and volume exclusion determine higher-order genome organization in budding yeast. Genome Research. 2012;22(7):1295–1305. doi: 10.1101/gr.129437.111. URL http://genome.cshlp.org/content/22/7/1295.abstract. [DOI] [PMC free article] [PubMed] [Google Scholar]
- 24.Véron AS, Lemaitre C, Gautier C, Lacroix V, Sagot MF. Close 3D proximity of evolutionary breakpoints argues for the notion of spatial synteny. BMC genomics. 2011;12(1):303. doi: 10.1186/1471-2164-12-303. URL http://www.biomedcentral.com/1471-2164/12/303. [DOI] [PMC free article] [PubMed] [Google Scholar]
- 25.Wijchers PJ, de Laat W. Genome organization influences partner selection for chromosomal rearrangements. Trends in genetics: TIG. 2011;27(2):63–71. doi: 10.1016/j.tig.2010.11.001. URL http://www.sciencedirect.com/science/article/pii/S0168952510002210. [DOI] [PubMed] [Google Scholar]
- 26.Wong H, Marie-Nelly H, Herbert S, Carrivain P, Blanc H, Koszul R, Fabre E, Zimmer C. A predictive computational model of the dynamic 3D interphase yeast nucleus. Current biology: CB. 2012;22(20):1881–90. doi: 10.1016/j.cub.2012.07.069. URL http://www.sciencedirect.com/science/article/pii/S096098221200927X. [DOI] [PubMed] [Google Scholar]
- 27.Yaffe E, Farkash-Amar S, Polten A, Yakhini Z, Tanay A, Simon I. Comparative analysis of DNA replication timing reveals conserved large-scale chromosomal architecture. PLoS genetics. 2010;6(7):e1001011. doi: 10.1371/journal.pgen.1001011. URL http://journals.plos.org/plosgenetics/article?id=10.1371/journal.pgen.1001011. [DOI] [PMC free article] [PubMed] [Google Scholar]
- 28.Zhang Y, McCord RP, Ho YJ, Lajoie BR, Hildebrand DG, Simon AC, Becker MS, Alt FW, Dekker J. Spatial organization of the mouse genome and its role in recurrent chromosomal translocations. Cell. 2012;148(5):908–21. doi: 10.1016/j.cell.2012.02.002. URL http://www.pubmedcentral.nih.gov/articlerender.fcgi?artid=3320767\&tool=pmcentrez\&rendertype=abstract. [DOI] [PMC free article] [PubMed] [Google Scholar]
- 29.Zimmer C, Fabre E. Principles of chromosomal organization: lessons from yeast. The Journal of cell biology. 2011;192(5):723–33. doi: 10.1083/jcb.201010058. URL http://jcb.rupress.org/content/192/5/723.abstract. [DOI] [PMC free article] [PubMed] [Google Scholar]
Associated Data
This section collects any data citations, data availability statements, or supplementary materials included in this article.


