Abstract
Background:
High fasting plasma glucose (FPG) is one of the main leading risk factors of ischemic heart disease (IHD), stroke, and chronic kidney diseases (CKDs). We estimated population attributable fraction (PAF) and attributed death of these fatal outcomes of high FPG at national and subnational levels in 25–64 years old Iranian adult.
Methods:
We used national and subnational data of the Non-Communicable Disease Surveillance Survey for exposure to risk factors in 2005 and 2011 among Iranian adults of 25–64 years old. For estimating the attributed death, using the death registration system data of Iran, we multiply the cause-specific PAFs by the number of outcome-specific deaths.
Results:
In Iran, high FPG was responsible for about 31% of attributed total deaths of IHD, stroke, and CKD in 2011. The related attributed deaths had increased from 2005 to 2011. In females, the PAFs for the effect of high FPG on IHD, stroke, and CKD were higher in 2011 than 2005 in all age groups. In males, this increase has occurred in over 45 years old. The highest PAFs of high FPG outcomes mostly related to central provinces of Iran. The central region of Iran had the highest and the southeast of the country had the lowest levels of attributed deaths.
Conclusions:
Considering the global 25 × 25 targets for noncommunicable disease mortality reduction, high FPG as a leading risk factor of fatal outcomes should be more targeted through the dietary, behavioral, and pharmacological interventions in Iran.
Keywords: Comparative risk assessment, high fasting plasma glucose, Iran, mortality
INTRODUCTION
Cardiovascular and circulatory diseases are the leading causes of death in the world, particularly in the Middle East and North Africa regions.[1,2] In Iran, based on Global Burden of Disease Study (GBD) 2010 results, 31.34% of total deaths are attributed to ischemic heart disease (IHD), ischemic stroke, and chronic kidney diseases (CKDs). In 1990, these outcomes were responsible to 12.79% of total death.[1,2,3]
In this regard, high fasting plasma glucose (FPG) as an important modifiable risk factor had an adverse change in national list of death related risk factors between 1990 and 2010.[3]
There is a progressive need to applicable and comparable information for priority setting and policy making for appropriate interventions on modifying risk factor.[4,5] Despite the priority of the problem and the urgent needs for evidence-based planning, there are considerable gaps in required information. Although the information on total attributed deaths of metabolic risk factors is available for Iran, no information is available at provincial level. In addition, a little information existed about population at risk and attributed death changes in provinces.[6]
The comparative risk assessment (CRA), as a responsive approach in health planning, evaluates the scenario of population health changes that would be happen following the modification of population distribution and risk factor/s exposure.[7] Through which, comparing different situations of interest lead to more accurate selection of target groups and cost-effective interventions.[7]
Thus, we estimated population attributable fraction (PAF) and attributed death (and uncertainty intervals) of the main fatal outcomes of high FPG including, IHD, stroke, and CKD, at national and subnational levels in 25–64 years old Iranian adult.
METHODS
Using CRA, we compared the population exposure to high FPG at national and subnational level by sex, age group, in 2005 and 2011. Our data source was the Non-Communicable Disease Surveillance Surveys following a STEPwise approach based on the WHO guidelines. The population representative data for FPG are available for 2005, and 2011.[8] In the present study, we estimated PAFs of main outcomes of high FPG including IHD, stroke, and CKD in 16 age groups (25–64 years) for both sexes, and 31 provinces for 2005 and 2011. In the next step, attributed death for each outcome has been estimated by sex, province, and age groups.
To CRA analysis, we followed these steps: (a) Estimation of high FPG exposure distribution, (b) selection high FPG pairs’ outcome, (c) specification of the etiological effect size of risk factor for each outcome, (d) determination the theoretical minimum risk exposure distributions for counterfactual comparison, (e) estimation number of cause-specific deaths.
Estimation high fasting plasma glucose exposure distribution
Based on STEPS surveys’ data, considering sampling weight of each year, we estimated mean and standard deviations (SDs) of FPG distributions of both sexes by age groups in 2005 and 2011, at national and subnational levels. The total number of study participants in 2005 and 2011 were 83,937 and 12,236, respectively. The values of FPG measures were available in 49,768 participants in 2005 and 5412 persons in 2011. Considering geographical variations of provincial divisions, using the districts’ information, data were rearranged for 31 provinces.
Selection high fasting plasma glucose pairs’ outcome
According to their considerable burden,[9] sufficient evidence for causal effects,[3] and availability of etiological effect size,[10] IHD, stroke, and CKD were selected as the main paired outcomes of high FPG.
Specification of the etiological effect size of risk factor for each outcome
The effect size of high FPG for outcomes’ specific mortality was included by relative risk (RR). As, in Iran, we have not comprehensive evidence for etiological effects, we used recent relevant meta-analyses of international cohorts evidence.[10]
Determination theoretical minimum risk exposure distributions for counterfactual comparison
In CRA, PAFs of outcomes attributable to risk factors estimated by comparison exposure distribution with counterfactual distribution as expected condition. To assess the full effects of FPG distribution as an “exposure” following the CRA processes, the counterfactual was considered as an FPG distribution with a mean of 88.2 mg/dl and an SD of 5.4.[10]
Estimation of the number of cause-specific deaths
The Ministry of Health and Medical Education collected death events by cause through death registration systems. Deputy of Research and Technology collected data from 1996 to 2001 and Deputy of Public Health was responsible for collection of death data from 2001 to 2010.[11] We used estimates of deaths number by underlying cause, age, sex, and province.
Mortality and disease burden attributable to high fasting plasma glucose
The contribution of high FPG in disease burden or mortality verified by PAF and attributed mortality.[7] PAFs estimate the proportional reduction in disease or death for the situation in which exposure to the risk factor was reduced to the counterfactual distribution.[7] We compared PAF of each outcome of high FPG for both sexes by age groups and province in 2005 and 2011.
PAF estimated by this formula:

RR (x) is the RR at exposure level x,
P (x) is the population distribution of exposure,
P’(x) is the counterfactual distribution of exposure,
m is the maximum exposure level.
As a result of within-person variation of metabolic risk factors, the SD of the usual population exposure distribution in health surveys overestimated. Thus, in estimation of PAF, we quantified the usual population SD of FPG by multiplying the FPG mean's SD in the STEPS survey sample by the dilution ratio from studies that had multiple exposure measurements.[12]
In addition, through the following formula, we estimated attributed mortality for each outcome by sex and province in mentioned years:
AMij = PAFM-ij × Mj
AMij is attributed mortality for risk factor i and outcome j,
PAFM−ij is PAF of risk factor i and outcome j,
Mj is mortality number of outcome j.
In estimation of attributed mortality to high FPG, we quantified uncertainty interval of the deaths number attributable to high FPG, accounting for uncertainty due to sampling variability. In these processes, we used a simulation approach to combine the uncertainties of exposure distributions, RRs, and outcome-specific mortality in each sex, age group. The uncertainty of death registration incompleteness considered variance of the estimated level of completeness by assuming an SD of 20% of the estimated completeness.[13] We used 1000 draws for each of mentioned parameters in repeated calculations and reported 95% uncertainty intervals based on the distributions of 1000 estimated attributable deaths. This analysis did not consider the uncertainty of the basic assumptions on the extrapolation of age patterns and RRs across populations.[3]
These analyses were conducted using STATA software (Version 11; StataCorp, College Station, TX) and R software (Version 3.0.2, The R Foundation) (version 3.0.2). All graphs have been drawn by R software.
RESULTS
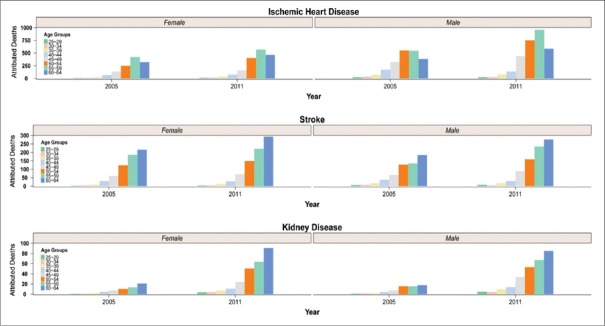
In 2011, 21,807 deaths occurred due to the IHD, stroke, and CKD. From them, 6811 (31.23%). cases were attributed to high FPG However, in 2005, 4953 (26.20%) of total 18,899 deaths of these outcomes were attributed to high FPG. In 2011, IHD, stroke, and CKD, respectively with 68.6%, 23%, and 8.4% of high FPG attributed mortality, followed the decreasing orders. Figure 1, for both sexes, shows an increasing death of all pair's outcomes from 2005 to 2011. The national attributed deaths of high FPG on IHD and stroke have increased 34% and 31% in females and 31% and 37% in males. Further, CKD attributed deaths were increased 3.1-fold in females and 3.6-fold in males.
Figure 1.
The national attributed deaths of high fasting plasma glucose on ischemic heart disease, stroke, and chronic kidney disease by sex in 2005 and 2011 for population 25–64 years
Figure 2 demonstrates the attributed deaths of high FPG on IHD, stroke, and CKD by sex and age groups in 2005 and 2011. For both sexes, the highest attributed deaths of IHD were aligned to 55–59 age groups. For stroke and CKD, the counterpart age groups were 60–64 years.
Figure 2.
The national attributed deaths of high fasting plasma glucose on Ischemic hearth disease, stroke, and Chronic kidney disease by sex and age group, in 2005 and 2011
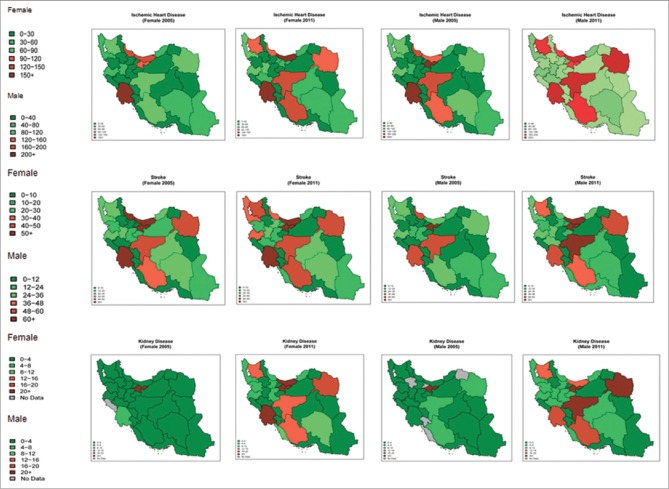
The geographical patterns of attributed deaths of high FPG on IHD, stroke, and CKD, for both sexes, at provincial level, have been compared between 2005 and 2011 [Figure 3]. High FPG is responsible for higher attributed deaths caused by IHD, stroke, and CKD in the center of the country. Constantly, southeast of the country had less attributed deaths of mentioned outcomes.
Figure 3.
The provincial attributed deaths of high fasting plasma glucose on ischemic heart disease, stroke, and chronic kidney disease by sex in 2005 and 2011 for population 25–64 years
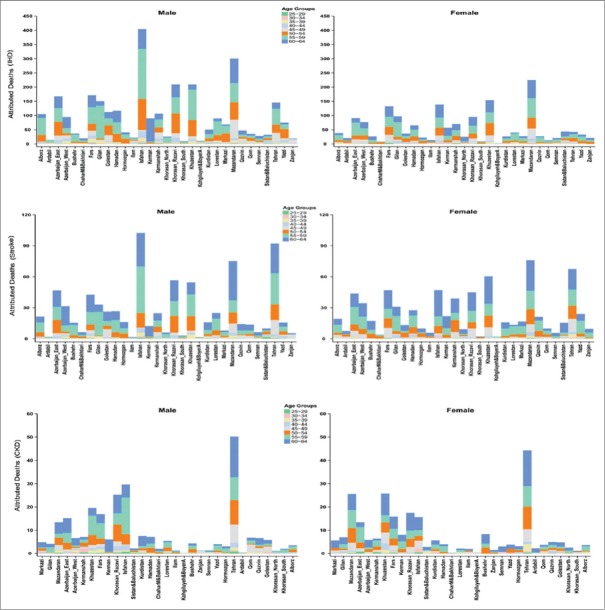
In 2011, the attributed deaths of high FPG on IHD had the highest and lowest measures in Isfahan and Kohgiluyeh and Boyer-Ahmad, respectively. In all provinces except for Sistan and Baluchestan, Zanjan, and Ardabil, the attributed deaths of IHD were more in males than in females. At the same year, the highest and lowest attributed deaths of stroke were related to Tehran and Kohgiluyeh and Boyer-Ahmad, respectively. In the most provinces, attributed deaths of stroke were higher in females than in males.
Almost, in half of the provinces, attributed deaths to CKD were higher in females than in males. In 2011, the highest and lowest attributable deaths for CKD were related to Tehran and Kohgiluyeh and Boyer-Ahmad, respectively. From 2005 to 2011, the highest increase of attributed deaths to IHD and CKD related to Isfahan and the highest rise of attributed deaths to stroke related to Tehran.
Figure 4 shows the attributed deaths of high FPG on IHD, stroke, and CKD in different age groups in 2005 and 2011.
Figure 4.
The provincial attributed deaths of high fasting plasma glucose on ischemic heart disease, stroke, and chronic kidney disease by sex, age in 2005 and 2011 for population 25–64 years
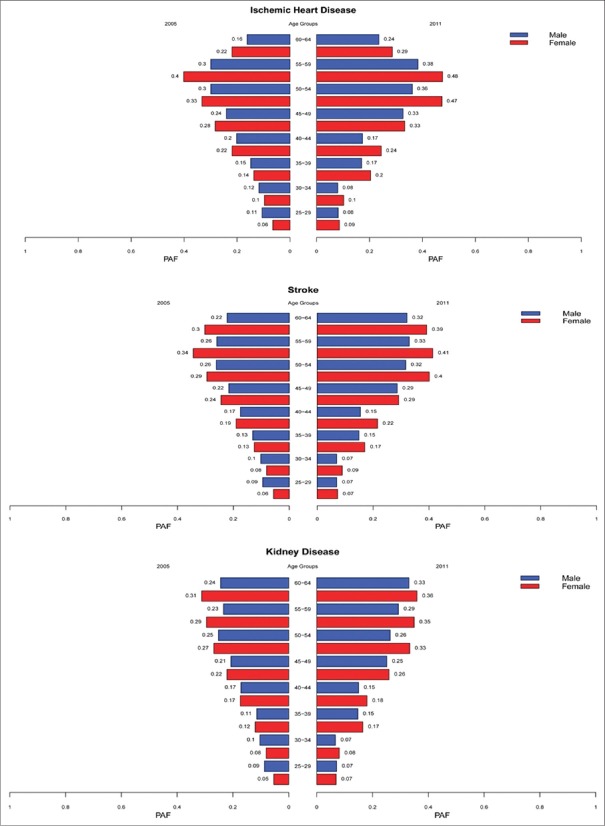
In Iran, in 2011 compared with 2005, the PAFs for the effect of high FPG on IHD, stroke, and CKD had increased in all of females’ age groups. In men, for all three outcomes, these increases have been occurred only in over 45 years old. The same pattern also observed in stroke and CKD's PAFs. The PAFs of high FPG attributed outcome have been compared in different age groups, by sex and by year in national level [Figure 5]. The highest PAFs of IHD and stroke in both sexes allied to 55–59 ages and the highest PAFs of CKD related to 60–64 years in males and females.
Figure 5.
The national population attributable fractions of the effect of high fasting plasma glucose on ischemic heart disease, stroke chronic kidney disease in 2005 and 2011 by sex and age for population 25–64 years
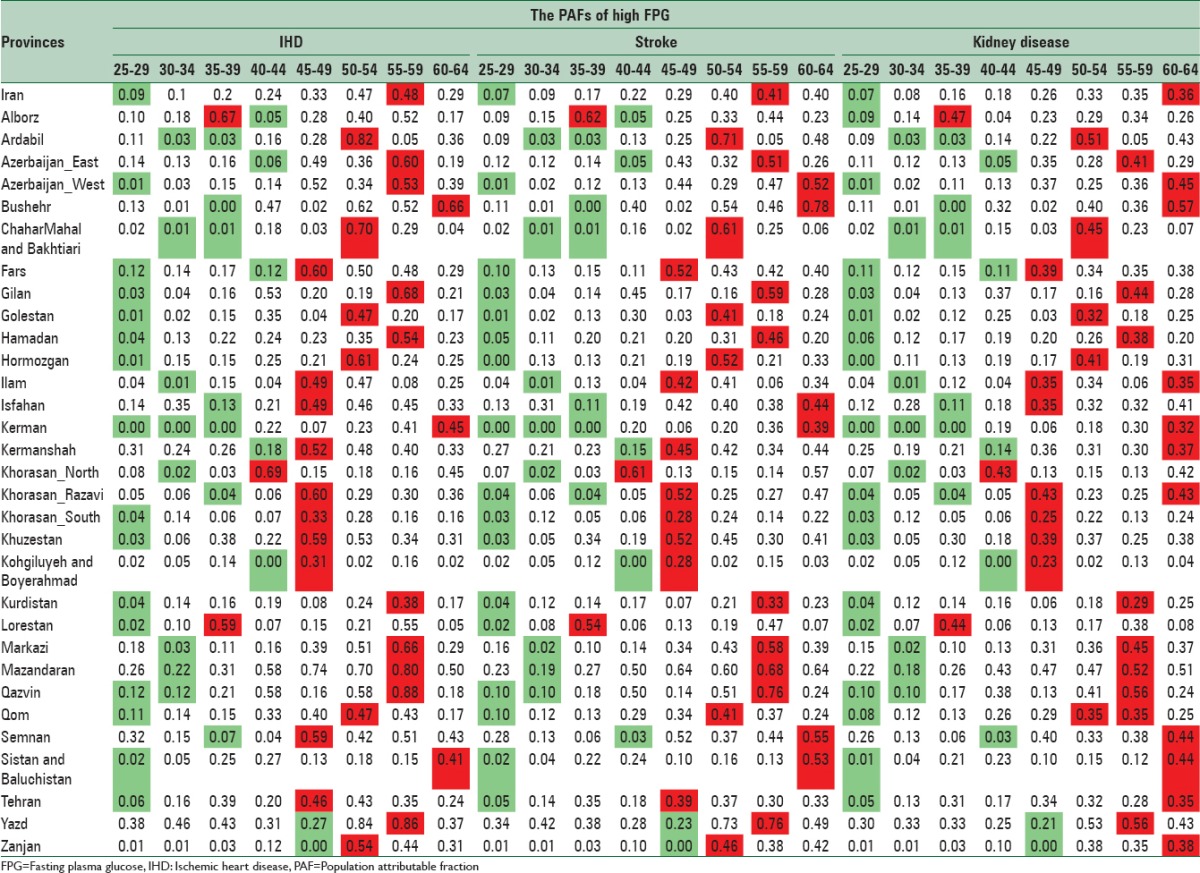
PAFs of high FPG on IHD, stroke, and CKD in 2011 have been presented by sex, age, and provinces [Tables 1 and 2]. For each province, the lowest and highest levels have been showed in green and red, respectively.
Table 1.
The population attributable fractions of high fasting plasma glucose on ischemic heart disease, stroke, and chronic kidney diseases in males by age in 2011 for population 25–64 years
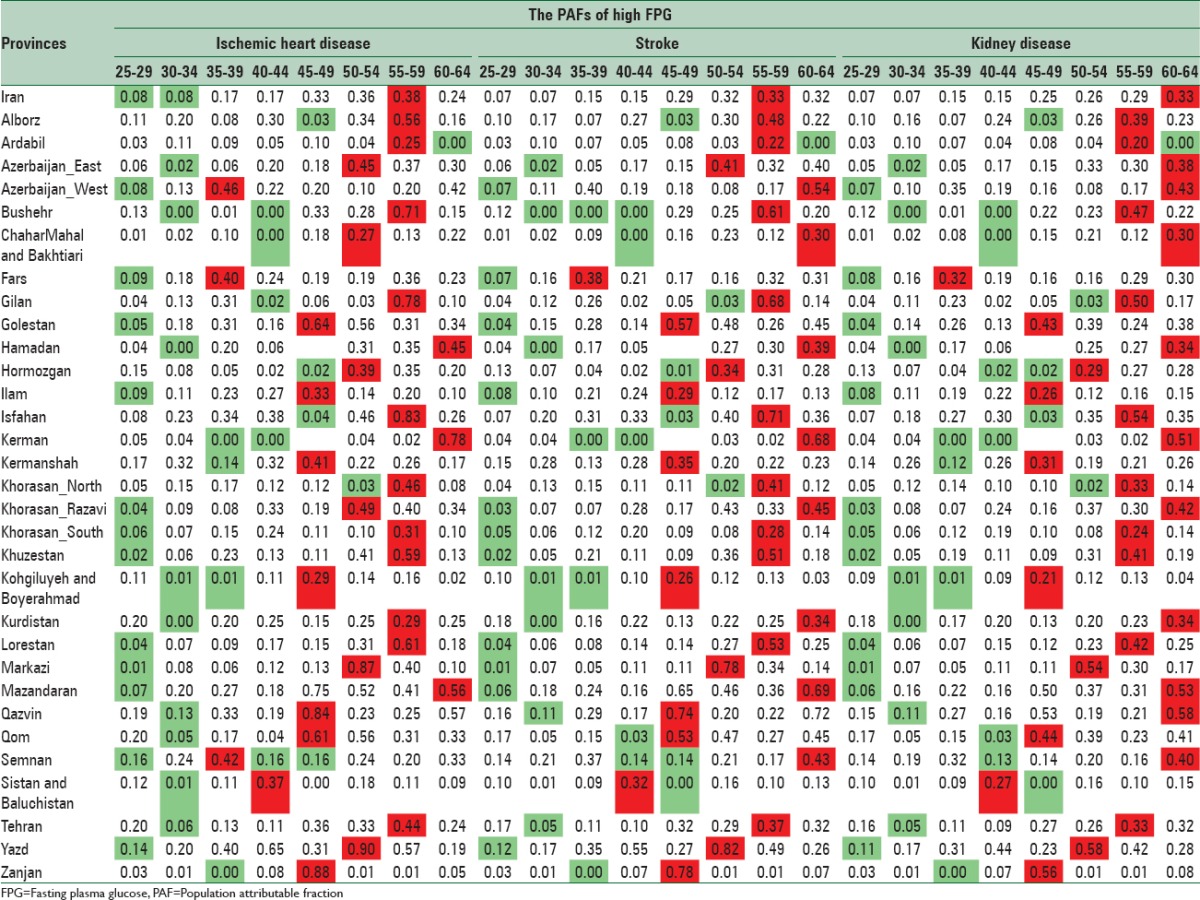
Table 2.
The population attributable fractions of high fasting plasma glucose on ischemic heart disease, stroke, and chronic kidney diseases in females by age in 2011 for population 25–64 years
DISCUSSION
According to our findings, about one-third of deaths caused by IHD, stroke, and CKD attributed to high FPG. In 2011, IHD had the highest mortality attributed to high FPG, which was followed by stroke and CKD. This pattern was seen in global level and attributable deaths to high FPG increased across the time.[3] Noteworthy, 72.7% of these deaths occurred in developing countries.[3]
Among 67 studied risk factors in 2010 GBD, high FPG was in the 7th position. In the Middle East and North Africa region, with the 4th rank of attributable burden of disease, it was responsible for more than 170,000 deaths.[3]
We found Yazd and Qazvin with the highest PAFs of high FPG on IHD, stroke, CKD in both sexes, consequently, attributed death of mentioned diseases is largest in the central region of the country. It might be due to higher exposure to risk factor. A related study showed the highest prevalence of high FPG in the central region of Iran.[4,5]
It is noteworthy that the highest attributed deaths of high FPG outcomes were related to Isfahan and Tehran which are of the wealthiest provinces of Iran. A study reported that the diabetes prevalence was highest in city corporations.[14] Unhealthy diet, high body mass index, and large population could be contributed to high attributed deaths of high FPG in these provinces. In contrast, some studies insist on relation between diabetes and low socioeconomic status.[15] Hence, there is need to comprehensive study in this regards.
At subnational level, the pattern of CRA measures is different among provinces. This heterogeneity resulted from variation in exposure to risk factors and health effects.[3,16,17,18] Reduce the current prevalence of this risk factor near to the theoretical minimum could lead to reduce avoidable deaths. Identifying peoples who needed intervention even based on the presence of a single risk factor could promote the results of years of life lost index.[19,20,21] Evidence shows that in diabetic patients, reduction of the FPG levels to minimum risk level lead to a considerable reduction in cardiovascular disease's disability-adjusted life years (6.8% in females and 3.1% in males).[22] These changes are also reported for the other risk factors.[23,24,25] Effective lifestyle interventions,[26] high-quality primary health care (PHC) for preventive interventions, and early diagnosis and control diabetes could promote this situation.[27,28,29,30]
The present study has benefited from many strength. For the first time, we conducted a more detailed analysis of the PAFs and attributed deaths in Iran at national and subnational levels. In addition, considering data uncertainty, we estimated CRA measures for different age groups and both sexes. Yet, we faced with some limitations. We used registered death data and incompleteness of data was not considered in this step, but we will pay attention to this point in the next study.[8,11,31,32,33,34] Further, we did not compute modeling uncertainty in our estimations. In addition, our analysis conducted on population 25–64 years; therefore, the attributed death for older peoples was not considered.
Our study provided comparable estimation of the effects of high FPG on IHD, stroke, and CKD that could be used for strategic planning, priority setting, and action planning.[29,30]
CONCLUSIONS
Presented evidence could help in effective governance responses to the surge of NCDs such as highlighting PHC and equitable and cost-effective population health interventions[35,36,37,38] and prioritize prevention to achieve the global 25 × 25 targets for noncommunicable disease mortality.
Considering our lesson learned, following these steps, benefiting from advanced methodological methods, we are conducting the comprehensive study on the National and Sub-national Burden of Disease in Iran.[8,11,31,32,33,34,39,40]
Financial support and sponsorship
Nil.
Conflicts of interest
There are no conflicts of interest.
Acknowledgements
The present study was the part of a Ph.D. dissertation completed by Niloofar Peykari. We would like to express our thanks to NCDRC. The study is granted by Ministry of Health and Medical Education of Islamic Republic of Iran and Setad-e-Ejrayie Farmane Imam.
REFERENCES
- 1.Lozano R, Naghavi M, Foreman K, Lim S, Shibuya K, Aboyans V, et al. Global and regional mortality from 235 causes of death for 20 age groups in 1990 and 2010: A systematic analysis for the Global Burden of Disease Study 2010. Lancet. 2012;380:2095–128. doi: 10.1016/S0140-6736(12)61728-0. [DOI] [PMC free article] [PubMed] [Google Scholar]
- 2.Global Burden of Diseases. [Last accessed on 2015 Dec 22]. Available from: http://www.vizhub.healthdata.org/gbd-compare/
- 3.Lim SS, Vos T, Flaxman AD, Danaei G, Shibuya K, Adair-Rohani H, et al. A comparative risk assessment of burden of disease and injury attributable to 67 risk factors and risk factor clusters in 21 regions, 1990-2010: A systematic analysis for the Global Burden of Disease Study 2010. Lancet. 2012;380:2224–60. doi: 10.1016/S0140-6736(12)61766-8. [DOI] [PMC free article] [PubMed] [Google Scholar]
- 4.Farzadfar F, Danaei G, Namdaritabar H, Rajaratnam JK, Marcus JR, Khosravi A, et al. National and subnational mortality effects of metabolic risk factors and smoking in Iran: A comparative risk assessment. Popul Health Metr. 2011;9:55. doi: 10.1186/1478-7954-9-55. [DOI] [PMC free article] [PubMed] [Google Scholar]
- 5.Danaei G, Rimm EB, Oza S, Kulkarni SC, Murray CJ, Ezzati M. The promise of prevention: The effects of four preventable risk factors on national life expectancy and life expectancy disparities by race and county in the United States. PLoS Med. 2010;7:e1000248. doi: 10.1371/journal.pmed.1000248. [DOI] [PMC free article] [PubMed] [Google Scholar]
- 6.Larijani FA, Parsaeian M, Motamedi SM, Khosravi A, Farzadfar F, Larijani B. National trends in mortality attributable to metabolic risk factors in Iran. Lancet. 2013;381:S79. [Google Scholar]
- 7.Lopez AD, Mathers CD, Ezzati M, Jamison DT, Murray CJ, Ezzati M, et al. World Bank; 2006. Comparative Quantification of Mortality and Burden of Disease Attributable to Selected Risk Factors. [PubMed] [Google Scholar]
- 8.Peykari N, Sepanlou SG, Djalalinia S, Kasaeian A, Parsaeian M, Ahmadvand A, et al. National and sub-national prevalence, trend, and burden of metabolic risk factors (MRFs) in Iran: 1990-2013, study protocol. Arch Iran Med. 2014;17:54–61. [PubMed] [Google Scholar]
- 9.Murray CJ, Vos T, Lozano R, Naghavi M, Flaxman AD, Michaud C, et al. Disability-adjusted life years (DALYs) for 291 diseases and injuries in 21 regions, 1990-2010: A systematic analysis for the Global Burden of Disease Study 2010. Lancet. 2012;380:2197–223. doi: 10.1016/S0140-6736(12)61689-4. [DOI] [PubMed] [Google Scholar]
- 10.Danaei G, Ding EL, Mozaffarian D, Taylor B, Rehm J, Murray CJ, et al. The preventable causes of death in the United States: Comparative risk assessment of dietary, lifestyle, and metabolic risk factors. PLoS Med. 2009;6:e1000058. doi: 10.1371/journal.pmed.1000058. [DOI] [PMC free article] [PubMed] [Google Scholar]
- 11.Mohammadi Y, Parsaeian M, Farzadfar F, Kasaeian A, Mehdipour P, Sheidaei A, et al. Levels and trends of child and adult mortality rates in the Islamic Republic of Iran, 1990-2013; protocol of the NASBOD study. Arch Iran Med. 2014;17:176–81. [PubMed] [Google Scholar]
- 12.MacMahon S, Peto R, Cutler J, Collins R, Sorlie P, Neaton J, et al. Blood pressure, stroke, and coronary heart disease. Part 1, prolonged differences in blood pressure: Prospective observational studies corrected for the regression dilution bias. Lancet. 1990;335:765–74. doi: 10.1016/0140-6736(90)90878-9. [DOI] [PubMed] [Google Scholar]
- 13.Danaei G, Lu Y, Singh GM, Carnahan E, Stevens GA, Cowan MJ, et al. Cardiovascular disease, chronic kidney disease, and diabetes mortality burden of cardiometabolic risk factors from 1980 to 2010: A comparative risk assessment. Lancet Diabetes Endocrinol. 2014;2:634–47. doi: 10.1016/S2213-8587(14)70102-0. [DOI] [PMC free article] [PubMed] [Google Scholar]
- 14.Khan MM, Gruebner O, Kraemer A. The geography of diabetes among the general adults aged 35 years and older in Bangladesh: Recent evidence from a cross-sectional survey. PLoS One. 2014;9:e110756. doi: 10.1371/journal.pone.0110756. [DOI] [PMC free article] [PubMed] [Google Scholar]
- 15.Hosseinpoor AR, Bergen N, Mendis S, Harper S, Verdes E, Kunst A, et al. Socioeconomic inequality in the prevalence of noncommunicable diseases in low- and middle-income countries: Results from the World Health Survey. BMC Public Health. 2012;12:474. doi: 10.1186/1471-2458-12-474. [DOI] [PMC free article] [PubMed] [Google Scholar]
- 16.Shadmani FK, Karami M. Joint effect of modifying selected risk factors on attributable burden of cardiovascular diseases. Int J Prev Med. 2013;4:1461–7. [PMC free article] [PubMed] [Google Scholar]
- 17.Garay J, Cartagena R, Esensoy AV, Handa K, Kane E, Kaw N, et al. Strategic analytics: Towards fully embedding evidence in healthcare decision-making. Healthc Q. 2015;17:23–7. doi: 10.12927/hcq.2014.24005. [DOI] [PubMed] [Google Scholar]
- 18.Li Q, Blume SW, Huang JC, Hammer M, Graf TR. The economic burden of obesity by glycemic stage in the United States. Pharmacoeconomics. 2015;33:735–48. doi: 10.1007/s40273-014-0248-5. [DOI] [PMC free article] [PubMed] [Google Scholar]
- 19.Hunter DJ, Reddy KS. Noncommunicable diseases. N Engl J Med. 2013;369:1336–43. doi: 10.1056/NEJMra1109345. [DOI] [PubMed] [Google Scholar]
- 20.Singh GM, Danaei G, Farzadfar F, Stevens GA, Woodward M, Wormser D, et al. The age-specific quantitative effects of metabolic risk factors on cardiovascular diseases and diabetes: A pooled analysis. PLoS One. 2013;8:e65174. doi: 10.1371/journal.pone.0065174. [DOI] [PMC free article] [PubMed] [Google Scholar]
- 21.Flegal KM, Panagiotou OA, Graubard BI. Estimating population attributable fractions to quantify the health burden of obesity. Ann Epidemiol. 2015;25:201–7. doi: 10.1016/j.annepidem.2014.11.010. [DOI] [PMC free article] [PubMed] [Google Scholar]
- 22.Karami M, Khalili D, Eshrati B. Estimating the proportion of diabetes to the attributable burden of cardiovascular diseases in Iran. Iran J Public Health. 2012;41:50–5. [PMC free article] [PubMed] [Google Scholar]
- 23.Karami M, Soori H, Monfared AB. Estimating the contribution of selected risk factors in attributable burden to stroke in Iran. Iran J Public Health. 2012;41:91–6. [PMC free article] [PubMed] [Google Scholar]
- 24.Saito I, Kokubo Y, Yamagishi K, Iso H, Inoue M, Tsugane S. Diabetes and the risk of coronary heart disease in the general Japanese population: The Japan Public Health Center-based prospective (JPHC) study. Atherosclerosis. 2011;216:187–91. doi: 10.1016/j.atherosclerosis.2011.01.021. [DOI] [PubMed] [Google Scholar]
- 25.Sadeghi-Bazargani H, Jafarzadeh H, Fallah M, Hekmat S, Bashiri J, Hosseingolizadeh GH, et al. Risk factor investigation for cardiovascular health through WHO STEPS approach in Ardabil, Iran. Vasc Health Risk Manag. 2011;7:417–24. doi: 10.2147/VHRM.S22727. [DOI] [PMC free article] [PubMed] [Google Scholar]
- 26.Danaei G, Singh GM, Paciorek CJ, Lin JK, Cowan MJ, Finucane MM, et al. The global cardiovascular risk transition: Associations of four metabolic risk factors with national income, urbanization, and Western diet in 1980 and 2008. Circulation. 2013;127:1493. doi: 10.1161/CIRCULATIONAHA.113.001470. [DOI] [PMC free article] [PubMed] [Google Scholar]
- 27.Di Cesare M, Khang YH, Asaria P, Blakely T, Cowan MJ, Farzadfar F, et al. Inequalities in non-communicable diseases and effective responses. Lancet. 2013;381:585–97. doi: 10.1016/S0140-6736(12)61851-0. [DOI] [PubMed] [Google Scholar]
- 28.Farzadfar F, Murray CJ, Gakidou E, Bossert T, Namdaritabar H, Alikhani S, et al. Effectiveness of diabetes and hypertension management by rural primary health-care workers (Behvarz workers) in Iran: A nationally representative observational study. Lancet. 2012;379:47–54. doi: 10.1016/S0140-6736(11)61349-4. [DOI] [PubMed] [Google Scholar]
- 29.Khatibzadeh S, Farzadfar F, Oliver J, Ezzati M, Moran A. Worldwide risk factors for heart failure: A systematic review and pooled analysis. Int J Cardiol. 2013;168:1186–94. doi: 10.1016/j.ijcard.2012.11.065. [DOI] [PMC free article] [PubMed] [Google Scholar]
- 30.Lim SS, Gaziano TA, Gakidou E, Reddy KS, Farzadfar F, Lozano R, et al. Prevention of cardiovascular disease in high-risk individuals in low-income and middle-income countries: Health effects and costs. Lancet. 2007;370:2054–62. doi: 10.1016/S0140-6736(07)61699-7. [DOI] [PubMed] [Google Scholar]
- 31.Farzadfar F, Delavari A, Malekzadeh R, Mesdaghinia A, Jamshidi HR, Sayyari A, et al. NASBOD 2013: Design, definitions, and metrics. Arch Iran Med. 2014;17:7–15. [PubMed] [Google Scholar]
- 32.Ghasemian A, Ataie-Jafari A, Khatibzadeh S, Mirarefin M, Jafari L, Nejatinamini S, et al. National and Sub-national Burden of Chronic Diseases attributable to lifestyle risk factors in Iran 1990-2013; study protocol. Arch Iran Med. 2014;17:146–58. [PubMed] [Google Scholar]
- 33.Kelishadi R, Hovsepian S, Qorbani M, Jamshidi F, Fallah Z, Djalalinia S, et al. National and sub-national prevalence, trend, and burden of cardiometabolic risk factors in Iranian children and adolescents, 1990-2013. Arch Iran Med. 2014;17:71–80. [PubMed] [Google Scholar]
- 34.Vos T, Flaxman AD, Naghavi M, Lozano R, Michaud C, Ezzati M, et al. Years lived with disability (YLDs) for 1160 sequelae of 289 diseases and injuries 1990-2010: A systematic analysis for the Global Burden of Disease Study 2010. Lancet. 2012;380:2163–96. doi: 10.1016/S0140-6736(12)61729-2. [DOI] [PMC free article] [PubMed] [Google Scholar]
- 35.Demaio AR, Kragelund Nielsen K, Pinkowski Tersbøl B, Kallestrup P, Meyrowitsch DW. Primary Health Care: A strategic framework for the prevention and control of chronic non-communicable disease. Glob Health Action. 2014;7:24504. doi: 10.3402/gha.v7.24504. [DOI] [PMC free article] [PubMed] [Google Scholar]
- 36.Gostin LO. Non-communicable diseases: Healthy living needs global governance. Nature. 2014;511:147–9. doi: 10.1038/511147a. [DOI] [PubMed] [Google Scholar]
- 37.Norheim OF, Jha P, Admasu K, Godal T, Hum RJ, Kruk ME, et al. Avoiding 40% of the premature deaths in each country, 2010-30: Review of national mortality trends to help quantify the UN sustainable development goal for health. Lancet. 2015;385(9964):239–52. doi: 10.1016/S0140-6736(14)61591-9. [DOI] [PubMed] [Google Scholar]
- 38.Kontis V, Mathers CD, Rehm J, Stevens GA, Shield KD, Bonita R, et al. Contribution of six risk factors to achieving the 25×25 non-communicable disease mortality reduction targets: A modeling study. Lancet. 2014;384:427–37. doi: 10.1016/S0140-6736(14)60616-4. [DOI] [PubMed] [Google Scholar]
- 39.Kasaeian A, Eshraghian MR, Rahimi Foroushani A, Niakan Kalhori SR, Mohammad K, Farzadfar F. Bayesian autoregressive multilevel modeling of burden of diseases, injuries and risk factors in Iran 1990-2013. Arch Iran Med. 2014;17:22–7. [PubMed] [Google Scholar]
- 40.Parsaeian M, Farzadfar F, Zeraati H, Mahmoudi M, Rahimighazikalayeh G, Navidi I, et al. Application of spatio-temporal model to estimate burden of diseases, injuries and risk factors in Iran 1990-2013. Arch Iran Med. 2014;17:28–33. [PubMed] [Google Scholar]


