

Abstract
The aim of this study is to investigate the genetic influence on the cerebral cortex, based on the analyses of heritability and genetic correlation between grey matter (GM) thickness, derived from structural MR images (sMRI), and associated white matter (WM) connections obtained from diffusion MRI (dMRI). We measured on sMRI the cortical thickness (CT) from a large twin imaging cohort using a surface‐based approach (N = 308, average age 22.8 ± 2.3 SD). An ACE model was employed to compute the heritability of CT. WM connections were estimated based on probabilistic tractography using fiber orientation distributions (FOD) from dMRI. We then fitted the ACE model to estimate the heritability of CT and FOD peak measures along WM fiber tracts. The WM fiber tracts where genetic influence was detected were mapped onto the cortical surface. Bivariate genetic modeling was performed to estimate the cross‐trait genetic correlation between the CT and the FOD‐based connectivity of the tracts associated with the cortical regions. We found some cortical regions displaying heritable and genetically correlated GM thickness and WM connectivity, forming networks under stronger genetic influence. Significant heritability and genetic correlations between the CT and WM connectivity were found in regions including the right postcentral gyrus, left posterior cingulate gyrus, right middle temporal gyri, suggesting common genetic factors influencing both GM and WM. Hum Brain Mapp 37:2331–2347, 2016. © 2016 Wiley Periodicals, Inc.
Keywords: cerebral cortex, heritability, genetic correlation, grey matter, white matter, diffusion MRI, structural MRI
Abbreviations
- CSF
cerebrospinal fluid
- CT
cortical thickness
- dMRI
diffusion MRI
- DTI
diffusion tensor imaging
- FOD
fibre orientation distribution
- GM
grey matter
- MPRAGE
magnetization‐prepared rapid gradient echo
sMRI
structural MRI
- WM
white matter
- FA
fractional anisotropy
- MD
mean diffusivity
- MZ
monozygotic
- DZ
dizygotic
INTRODUCTION
A vast number of neurons whose cell bodies reside in the cortical gray matter (GM) connect with other parts of the central and peripheral nervous system via white matter (WM) pathways beneath the cortex. The extent to which these neural networks are genetically determined and the common genetic influences underlying both WM and GM in these networks are of considerable interest for improving our understanding of brain development and diseases.
The cortical thickness (CT) and WM integrity measured by diffusion tensor imaging (DTI) were found to be positively correlated across the lifespan [Kochunov et al., 2011a], while GM density was found to decrease during WM growth [Sowell et al., 2003]. In developing brains, CT starts to decrease from childhood, and continues throughout adolescence into adulthood [Shaw et al., 2008, Wierenga et al., 2014]. Potential common mechanism has been postulated to underlie the trajectory of WM developments and cortical GM thickness changes over the live time [Kochunov et al., 2011a], and a number of genes were suggested to have influences on GM and WM jointly [Kochunov et al., 2011b].
In this study, we aimed to investigate the genetic influences upon the cerebral cortex within a large twin cohort synthesizing information derived from cortical GM and the associated WM pathways that connect the various cortical and subcortical structures. To achieve this goal, we measured CT of GM using structural MRI (sMRI) and analyzed the WM tracts using diffusion MRI (dMRI) in an independent fashion. The heritability patterns shared by independent WM and GM measurements allowed us to identify neural networks formed by WM tracts under strong genetic influence which also connect the cortical regions with heritable GM measures. We used a bivariate model to estimate the phenotypic and the genetic correlation between WM and cortical GM thickness on the twin cohort. By genetic analysis using twin data, we are able not only to ascertain the correlation between CT and the WM development, but also to explore if they may be attributed to the influences of common genes.
The patterns of genetic influences on cortical structures derived from sMRI have been extensively reported in the literature [Eyler et al., 2012; Hulshoff et al., 2006; Joshi et al., 2011; Lenroot et al., 2009; Panizzon et al., 2009; Thompson et al., 2001; Winkler et al., 2010]. As cortical folding varies significantly among population, even between monozygotic twins [Bartley et al., 1997; Biondi et al., 1998], we carried out the genetic analysis using a surface‐based approach [Joshi et al., 2011]. We estimated the thickness of cortical GM on structural MR images [Acosta et al., 2009] and used a surface‐based approach to establish the correspondence of cortex across the population. Vertex‐based statistical analysis [Acosta et al., 2012] was employed to evaluate the genetic influence on the GM thickness.
As for the WM, a number of studies using DTI have found heritable measures in fractional anisotropy [(FA), Chiang et al., 2009; Jahanshad et al., 2010; Kochunov et al., 2010], geodesic anisotropy [Jahanshad et al., 2010], mean diffusivity [(MD), Jahanshad et al., 2010], radial and axial anisotropy [Jahanshad et al., 2010; Brouwer et al., 2010], and full diffusion tensor [Lee et al., 2009, 2010]. It is now well established that tensor based metrics, such as FA or MD, are not optimal for studying connectivity within complex WM architecture [Tuch et al., 2003; Vos et al., 2011]. We used measurements based on the Fibre Orientation Distribution (FOD) reconstructions by constrained spherical deconvolution [Tournier et al., 2008] on HARDI data, and mapped the heritability of FOD‐based measures to the connected cortical regions. Using this approach we reported earlier that anatomical connectivity networks exhibit different degrees of heritability [Shen et al., 2014].
MATERIALS AND METHODS
Participants
The twin participants in our study were from a subsample of the Queensland Twin Imaging (QTIM) cohort. It consisted of 328 subjects, among which 71 pairs of monozygotic (MZ) twins and 90 pairs of dizygotic (DZ) twins were used in the previous heritability analysis of dMRI [Shen et al., 2014]. Using the same cohort, the sMRI of 308 subjects consisting of 70 MZ pairs and 84 DZ pairs that passed visual image quality control and were successfully analyzed by CT estimation pipeline, were used in the heritability analysis of CT. A subset of 38 subjects with CT estimated on repeated scans were analyzed to establish the test‐retest reliability of the CT. These subjects were scanned twice on average 3‐month intervals (109 ± 51 days, range 36‐258 days). The demographic information of the subjects used in each analysis is shown in Table 1. For comparison, the demographic information of previously published dMRI analysis on the same cohort [Shen et al., 2014] is also listed.
Table 1.
Subjects and their demographics
| Subjects with test‐retest cortical thickness estimation | Subjects with cortical thickness estimations | Subjects with diffusion MRI analysis (Shen et al., 2014) | Total cohort | |
|---|---|---|---|---|
| N | 38 | 308 | 322 | 328 |
| Sex | 15M, 23F | 111M, 197F | 117M, 205F | 118M, 210F |
| Age (s.d.) | 23.2 (2.4), range 20–28 | 22.8 (2.3), range 19–29 | 22.7 (2.3), range 19–29 | 22.7 (2.3), range 19–29 |
| Zygosity | 5 MZ pairs (N=10), 9 DZ pairs (N=18), 10 unpaired | 70 MZ pairs (N=140), 84 DZ pairs (N=168) | 71 MZ pairs (N=142), 90 DZ pairs (N=180) | 71 MZ pairs (N=142), 90 DZ pairs (N=180), 6 unpaired |
Zygosity was determined by genome‐wide single nucleotide polymorphism genotyping (Illumina 610K chip) in approximately 90% of participants. If this was not available, zygosity was established by genotyping nine independent DNA microsatellite polymorphisms using polymerase chain reaction, and cross‐checked with blood group results and phenotypic data [Wright and Martin, 2004]. All subjects included in the cohort are right‐handed, assessed based on 12 items from Annett's Handedness Questionnaire (Annett et al., 1970). All subjects were screened using a detailed neurocognitive evaluation to exclude cases of pathology known to affect brain structure. No subject reported a history of significant head injury, neurological or psychiatric illness, substance abuse or dependence, or had a first‐degree relative with a psychiatric disorder [Wright and Martin, 2004].
Image Acquisition
The T1‐weighted and diffusion‐weighted images were acquired on a 4T Bruker Medspec whole‐body scanner (Bruker Medical, Ettingen, Germany). Three‐dimensional T1‐weighted images were acquired with a magnetization‐prepared rapid gradient echo (MPRAGE) sequence to resolve anatomy at high resolution. Acquisition parameters were: inversion time (TI)/repetition time (TR)/echo time (TE)=700/1500/3.35ms, flip angle = 8°, slice thickness = 0.9 mm with a 256 × 256 × 256 acquisition matrix. Diffusion images were acquired using a commercial single shot echo planar multi‐direction diffusion weighted sequence, employing a dual bipolar diffusion gradient and a double spin echo. The imaging parameters were: 55 axial slices; 2 mm slice thickness; field of view 23 cm × 23 cm; TR/TE 150/92.3 ms; acquisition matrix 128 × 128, resulting in an in‐plane resolution of 1.80 x 1.80 mm. Ninety four diffusion‐weighted images were acquired at b = 1159 s/mm2, in which the encoding gradients were distributed in space using the electrostatic approach [Jones et al., 1999], along with 11 non‐diffusion weighted images (b = 0).
Structural MR Image Processing and Cortical Thickness Estimation
Details of the surface‐based approach we used for CT estimation analysis were described by Acosta et al., [2012]. Briefly, for each subject, the 3‐dimensional T1‐weighted image was segmented into GM, WM, and cerebrospinal fluid (CSF) using an expectation maximization (EM) segmentation algorithm [Acosta et al., 2009]. The EM algorithm computed probability maps for each tissue type, which were discretized by assigning each voxel to its most likely tissue type. Partial‐volume effects due to the limited imaging resolution relative to the size of some anatomical structures was taken into account by the classification and estimation of tissue composition in voxels to increase the precision of CT estimation in regions such as deep sulci. Topological corrections were also applied to deep sulci, and the GM segmentation was constrained to be a continuous layer covering the WM [Rueda et al., 2010]. The segmentation method used 9 different atlases to reduce the error induced by misregistration of the atlases. Each individual T1‐weighted image was then segmented nine times and a majority voting rule was used to establish a consensus for pure tissue segmentation.
Once pure tissue segmentation and partial tissue classification were performed, the CT of the resulting GM was computed using a combined voxel‐based approach. The cortical thickness values were mapped from the image to the cortical surface mesh, which was geometrically smoothed and registered to a common template mesh by a multi‐scale EM‐ICP algorithm [Dore et al., 2011]. A 10‐mm Laplace‐Beltrami smoothing was then applied to the CT values on the template mesh.
In addition to the analysis of vertex‐based CT values, we also performed ROI‐based analyses of CT. In the ROI‐based analysis, we computed the average CT in each cortical ROI, which reduced the noise. The cortical ROIs in our analysis were defined by Automated Anatomical Labeling [(AAL), Tzourio‐Mazoyer et al., 2002] atlas on the common template. Although ROI‐based analysis has higher statistical power by averaging a large number of points in each ROI, it is less specific spatially compared to vertex‐based analysis.
Diffusion MR Image Processing
The method for dMRI data processing and analysis was described previously [Shen et al., 2014], a brief description follows. The diffusion‐weighted images were pre‐processed using point spread function mapping [Zaitsev et al., 2004], with bias field [Tustison et al., 2010] and motion artifacts corrected [Raffelt et al., 2012; Rohlfing et al., 2008]. Constrained spherical deconvolution [Tournier et al., 2008] was used to estimate the distribution of the fiber population in each voxel, using the response signal from coherently aligned fibers [Leow et al., 2009] in the corpus callosum.
All the subjects' datasets were warped to a population brain atlas estimated iteratively. A population average template was created by averaging all the subjects' transformed data [Raffelt et al., 2012]. The same transformation field from each subject to the template was also used to transform the diffusion tensor map of each subject and to create an average FA map. By registering the average FA map to the JHU DTI atlas [Mori et al., 2005; Wakana et al., 2007; Hua et al., 2008], the FOD map of each subject was realigned to the standard MNI space (Fig. 1 for a visualization of FODs).
Figure 1.
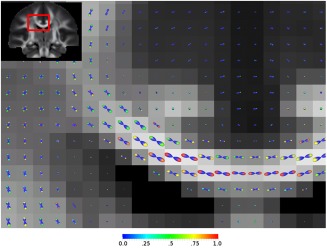
Fiber orientation distribution (FOD), with the cap of corresponding peak color‐coded by the heritability index h2 of its amplitude, overlaid on the fractional anisotropy (FA) map. The body of FOD apart from the peak colored in blue.
The amplitude of FOD peaks was measured on each subject spatially normalized to the MNI space. The three principal FOD peak amplitudes were identified in each voxel of the average FOD template using MRtrix [Tournier et al., 2012], which were then used as template to match the likely peaks in each subject based on angular error. In voxels where the FOD peak the template failed to match the subject, the size of peak will be considered 0. For each voxel, the two largest FOD peaks were used in subsequent analyses described below, unless the second highest FOD peak was lower than 0.1, in which case only one FOD peak was considered [Jeurissen et al., 2013].
Tract‐Based Measures of Connectivity
We performed whole brain probabilistic fiber tracking [Tournier et al., 2012] on the population average FOD template, creating a tractogram of WM tracts consisting of cortico‐cortical connections between various regions of cortical mantle (GM), and links between the cerebral cortex and subcortical nuclei. Using AAL atlas, we generated 2 million tracts from each cortical and subcortical region, resulting a whole‐brain tractogram of approximately 170 million tracts. To compute the average connectivity of a tract, we projected the size of FOD peaks in each subject onto the fiber tracts in the template tractogram. When a tract intersects voxels with two distinct peaks, the size of the peak along the direction of the tract was chosen. We considered an FOD peak and the passing tract to be in the same direction when they form an angle less than 45° [Shen et al.,, 2014]. In case where the tract passes a voxel where no peak was found to be in the same direction, the value projected was set to zero. A reliability mask was used to filter the estimates with test‐retest reliability over 0.6 [Guo et al., 2012]. To characterize the connectivity of each tract, we used the “trimmed” mean over the entire stretch of the tract, removing extreme values that arose due to large deviations away from the FOD peak directions or low reliability. The trimmed mean was computed by removing the 5% highest and the 5% lowest values.
We identified the set of tracts in the tractogram that ended in each cortical ROI, and computed the connectivity between each pair of ROIs by averaging the FOD measures along all tracts between them. To characterize the connectivity of a particular cortical ROI with the rest of the brain, and we also computed the average FOD measures along all tracts that ended in that given region.
Estimation of Heritability
We compared subjects with repeated scans to evaluate the test‐retest reliability of our measurements. We used the intraclass correlation [(ICC), Shrout and Fleiss 1979] to evaluate the test‐retest reliability of CT and FOD measures. Negative ICC estimates were clamped to zero (Bartko, 1976], such that the variance remained non‐negative, consistent with the interpretation of ICC. Measurements were corrected for age and sex.
The covariance of genetic and environmental factors were expected to be different among MZ twins and DZ twins, as MZ twins share identical genes whereas DZ twins share on average only half of their genetic variants. Using an ACE model, FOD peak amplitudes were assumed to be subject to the influence of three factors: additive genetics A, common environment C, and residual E due to unique environment and measurement errors which are independent between individuals. We thus assumed that
where observed measurement Y is vertex‐based CT value or cortical ROI‐average CT in the analysis of GM using sMRI, and the FOD peak measure in the analysis of WM using dMRI.
APACE package [Chen et al., 2013]1 was used to compute the non‐negative least squares estimates [Lawson and Hanson 1995] of the variance components, which provides estimates with the mean squared error within ± 5% of that of the standard package OpenMx [Boker et al., 2011] and similar bias and variance properties. Based on the variance estimation, we calculated the heritability index and the proportion of variance due to common environment .
A likelihood‐ratio test (LRT) comparing ACE model with CE model (i.e., common environment C and unique environment E) was used to assess the significance of the additive component A and to decide whether to reject the null hypothesis A = 0 [Visscherv 2004]. The P‐value of the test was estimated from the probability distribution of the test statistic, which is asymptotically a chi‐squared distribution with 1 degree of freedom. Likewise, the significance of the variance component C of the common environment is evaluated by a LRT comparing ACE model with AE model (additive component A and unique environment E only).
In the vertex‐based analysis of CT, the total number of LRTs is the number of vertices in the template mesh of both hemispheres. In the FOD‐based WM analysis, the total number of LRTs is the number of FOD peaks (namely, the number of WM voxels with at least one FOD peak + number of voxels with two FOD peaks). To address the issue of multiple comparisons, we applied the False Discovery Rate [(FDR), Benjamini and Hochberg, 1995] to control for the significance of LRTs on FOD peaks and cortical surface vertices.
Genetic Correlation Between Connectivity and Cortical Thickness
The CT is calculated for each region individually in the typical settings of an ROI‐based analysis, while the WM connectivity derived from dMRI is usually measured between a pair of brain regions. To examine the common genetic influences between these two types of measures, we computed the cross‐trait genetic correlation first for each cortical region (the two traits being the given region's average FOD connectivity measure and its CT), and then for each pairwise connection (the two traits being the FOD connectivity measure of the connection and the average CT of the regions linked by the given connection).
For each cortical ROI, the regional average connectivity is computed by averaging the mean FOD peak size along all the tracts connecting to that cortical region. We used this connectivity measure as one variable and the average cortical GM thickness of the given ROI as the other to calculate the genetic correlation. To reduce the number of statistical tests, we limited our analyses to the regions with (1) the reliabilities of the average FOD measure and the CT are greater than 0.6; (2) the heritabilities of the average CT and the average FOD computed for the given region should be greater than 0.2, as the variance of cross‐trait genetic correlation estimator is inversely proportional to the heritabilities of both traits [Visscher, 2004].
For the analysis of pairwise connections, we computed the average FOD peak size along all the tracts terminating in them as the measure of connectivity for the pair, and the average CT of the given two ROIs as the other variable in the calculation of genetic correlation. Apart from the same inclusion criteria selecting the pairwise connections between regions with CT and FOD reliabilities >0.6, as well as average CT and FOD h 2 > 0.2, we also excluded connections with less than 250 tracts in the tractogram from the analysis as few tracts generated may not represent a viable connection between them.
A bivariate AE model was used to estimate the cross‐trait genetic correlation. The genetic correlation is computed by maximum‐likelihood estimation using OpenMx package [Boker et al., 2011]. The phenotypic correlation and the correlation between the cross‐trait environment components were also estimated. The LRT was used to assess the significance of the cross‐trait correlations. The significance of the genetic correlation and that of the environment correlation were assessed by the LRT comparing the AE model with a constrained model with fixed zero cross‐trait genetic correlation, and with a model with zero correlation between cross‐trait environment components, respectively. To estimate the significance of the phenotypic correlation, the LRT compared the AE model with a model in which both genetic and environment correlation were fixed to zero. The FDR adjustment was then applied to address the issue of multiple comparisons.
RESULTS
ACE Decomposition of Cortical Thickness
The vertex‐wise CT heritability was mapped onto the cortical surface shown in Figure 2, and the average heritability in each ROI is listed in Table 2. In vertex‐based analysis, bilateral postcentral gyri, paracentral lobules, superior parietal gyri, right medial superior frontal gyrus, and left superior occipital gyrus were among the heritable cortical regions with average h 2 > 0.4. Significant additive genetic component (FDR adjusted P < 0.05) was found on vertices in the bilateral postcentral gyri, superior occipital gyri, superior parietal gyri, precuneus, the orbital part of the right frontal gyrus, right medial superior frontal gyrus, right middle occipital gyrus, right paracentral lobule, left precentral gyrus, and left dorsolateral superior frontal gyrus.
Figure 2.
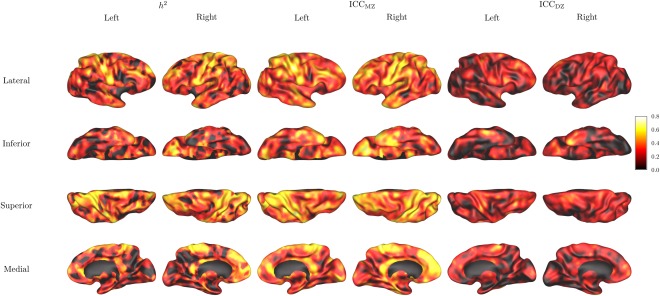
Vertex‐based heritability maps. From left to right: heritability index h 2, intraclass correlation between monozygotic twins ICCMZ, intraclass correlation between dizygotic twins ICCDZ.
Table 2.
Average heritability h 2 of cortical thickness by cortical regions of interest. The heritability was estimated for each vertex
| Cortical regions | Heritability h 2 | ICCMZ | ICCDZ | |||
|---|---|---|---|---|---|---|
| Left | Right | Left | Right | Left | Right | |
| Frontal lobe | ||||||
| Precentral gyrus | 0.320 | 0.308 | 0.404 | 0.364 | 0.226 | 0.174 |
| Superior Frontal gyrus dorsolateral | 0.263 | 0.376 | 0.325 | 0.433 | 0.247 | 0.228 |
| Superior frontal gyrus orbital part | 0.236 | 0.360 | 0.383 | 0.441 | 0.187 | 0.219 |
| Middle Frontal gyrus | 0.281 | 0.319 | 0.319 | 0.380 | 0.195 | 0.150 |
| Middle frontal gyrus orbital part | 0.165 | 0.325 | 0.275 | 0.351 | 0.134 | 0.127 |
| Inferior frontal gyrus opercular part | 0.161 | 0.309 | 0.290 | 0.370 | 0.207 | 0.128 |
| Inferior frontal gyrus triangular part | 0.194 | 0.260 | 0.292 | 0.306 | 0.128 | 0.086 |
| Inferior frontal gyrus orbital part | 0.150 | 0.281 | 0.234 | 0.341 | 0.110 | 0.169 |
| Rolandic operculum | 0.296 | 0.274 | 0.332 | 0.385 | 0.180 | 0.188 |
| Supplementary motor area | 0.337 | 0.259 | 0.387 | 0.348 | 0.258 | 0.225 |
| Olfactory cortex | 0.110 | 0.083 | 0.122 | 0.088 | 0.042 | 0.046 |
| Superior frontal gyrus medial | 0.299 | 0.442 | 0.397 | 0.527 | 0.227 | 0.206 |
| Superior frontal gyrus medial orbital | 0.167 | 0.440 | 0.260 | 0.463 | 0.169 | 0.249 |
| Gyrus rectus | 0.228 | 0.384 | 0.281 | 0.400 | 0.096 | 0.209 |
| Paracentral lobule | 0.411 | 0.523 | 0.540 | 0.524 | 0.324 | 0.275 |
| Insula and cingulate gyri | ||||||
| Insula | 0.085 | 0.146 | 0.096 | 0.167 | 0.047 | 0.064 |
| Anterior cingulate and paracingulate gyri | 0.280 | 0.357 | 0.371 | 0.406 | 0.199 | 0.146 |
| Median cingulate and paracingulate gyri | 0.192 | 0.200 | 0.252 | 0.279 | 0.173 | 0.132 |
| Posterior cingulate gyrus | 0.322 | 0.299 | 0.416 | 0.432 | 0.075 | 0.199 |
| Occipital lobe | ||||||
| Calcarine fissure and surrounding cortex | 0.101 | 0.119 | 0.220 | 0.165 | 0.169 | 0.069 |
| Cuneus | 0.230 | 0.159 | 0.381 | 0.180 | 0.134 | 0.026 |
| Lingual gyrus | 0.150 | 0.123 | 0.242 | 0.179 | 0.050 | 0.052 |
| Superior occipital gyrus | 0.419 | 0.275 | 0.478 | 0.362 | 0.105 | 0.087 |
| Middle occipital gyrus | 0.281 | 0.236 | 0.383 | 0.314 | 0.035 | 0.087 |
| Inferior occipital gyrus | 0.185 | 0.216 | 0.307 | 0.281 | 0.126 | 0.044 |
| Parietal lobe | ||||||
| Postcentral gyrus | 0.419 | 0.403 | 0.456 | 0.455 | 0.162 | 0.210 |
| Superior parietal gyrus | 0.451 | 0.411 | 0.487 | 0.444 | 0.157 | 0.237 |
| Inferior parietal gyrus | 0.235 | 0.295 | 0.320 | 0.355 | 0.183 | 0.191 |
| SupraMarginal gyrus | 0.234 | 0.223 | 0.340 | 0.293 | 0.157 | 0.118 |
| Angular gyrus | 0.281 | 0.283 | 0.343 | 0.307 | 0.068 | 0.168 |
| Precuneus | 0.211 | 0.234 | 0.313 | 0.329 | 0.103 | 0.137 |
| Temporal lobe | ||||||
| Hippocampus | 0.121 | 0.119 | 0.132 | 0.240 | 0.100 | 0.121 |
| Para hippocampal gyrus | 0.039 | 0.056 | 0.043 | 0.117 | 0.005 | 0.037 |
| Amygdala | 0.043 | 0.014 | 0.091 | 0.018 | 0.042 | 0.001 |
| Fusiform gyrus | 0.123 | 0.139 | 0.153 | 0.236 | 0.069 | 0.056 |
| Heschl gyrus | 0.393 | 0.363 | 0.443 | 0.417 | 0.140 | 0.148 |
| Superior temporal gyrus | 0.185 | 0.308 | 0.292 | 0.354 | 0.169 | 0.123 |
| Temporal pole superior temporal gyrus | 0.111 | 0.026 | 0.214 | 0.036 | 0.175 | 0.012 |
| Middle temporal gyrus | 0.209 | 0.234 | 0.278 | 0.269 | 0.093 | 0.133 |
| Temporal pole middle temporal gyrus | 0.099 | 0.237 | 0.118 | 0.271 | 0.042 | 0.082 |
| Inferior temporal gyrus | 0.225 | 0.188 | 0.312 | 0.315 | 0.201 | 0.174 |
Abbreviations: h 2, heritability index; ICCMZ, intraclass correlation between monozygotic twins; ICCDZ, intraclass correlation between dizygotic twins.
The heritability of ROI‐average CT is shown in Figure 3, and detailed results are listed in Table 3. In the ROI‐based analysis, with FDR adjustment for 82 ROIs, we detected significant additive genetic influence on the average cortical thickness in bilateral precentral and postcentral gyri, paracentral lobules, middle frontal, superior and middle occipital, superior parietal, middle temporal gyri, left supplementary motor area, triangular part of the left inferior frontal gyrus, left rolandic operculum, posterior cingulate, angular gyrus, the medial, orbital and dorsolateral part of the right superior frontal, opercular part of the right inferior frontal, right anterior cingulate and paracigulate gyri, right inferior occipital, inferior parietal, supra‐marginal gyrus, precuneus, fusiform, superior temporal gyri.
Figure 3.
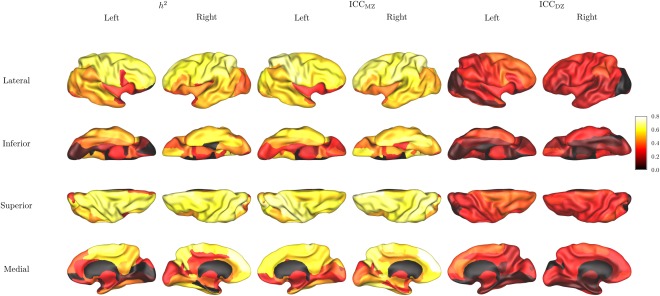
Heritability maps for region‐average cortical thickness. From left to right: heritability index h 2, intraclass correlation between monozygotic twins ICCMZ, intraclass correlation between dizygotic twins ICCDZ.
Table 3.
Heritability of regional average cortical thickness
| Cortical regions | Heritability h 2 | ICCMZ | ICCDZ | LRT ACE vs. CE | LRT ACE vs. E | |||||||||||||
|---|---|---|---|---|---|---|---|---|---|---|---|---|---|---|---|---|---|---|
| Left | Right | Left | Right | Left | Right | Left | Right | Left | Right | |||||||||
| statistic | Unadjusted P | FDR adjusted P | statisitc | Unadjusted P | FDR adjusted P | statistic | Unadjusted P | FDR adjusted P | statistic | Unadjusted P | FDR adjusted P | |||||||
| Frontal lobe | ||||||||||||||||||
| Precentral gyrus | 0.655 | 0.605 | 0.654 | 0.612 | 0.326 | 0.287 | 10.44 | <0.001 | 0.036 | 9.97 | <0.001 | 0.045 | 48.57 | <10−10 | <10−9 | 39.72 | <10−8 | <10−7 |
| Superior Frontal gyrus dorsolateral | 0.621 | 0.658 | 0.541 | 0.663 | 0.396 | 0.326 | 4.35 | 0.019 | 0.567 | 9.84 | <0.001 | 0.048 | 38.93 | <10−8 | <10−7 | 49.42 | <10−11 | <10−9 |
| Superior frontal gyrus orbital part | 0.015 | 0.518 | 0.370 | 0.625 | 0.238 | 0.340 | 0.06 | 0.400 | 5.90 | 0.008 | 0.302 | 14.96 | 0.0003 | 0.003 | 44.42 | <10−9 | <10−8 | |
| Middle Frontal gyrus | 0.650 | 0.607 | 0.616 | 0.654 | 0.367 | 0.232 | 8.08 | 0.002 | 0.107 | 13.20 | <0.001 | 0.009 | 45.93 | <10−10 | <10−8 | 41.76 | <10−9 | <10−7 |
| Middle frontal gyrus orbital part | 0.000 | 0.350 | 0.226 | 0.384 | 0.171 | 0.133 | 0.00 | 1 | 2.51 | 0.056 | 6.21 | 0.022 | 0.128 | 12.16 | 0.001 | 0.010 | ||
| Inferior frontal gyrus opercular part | 0.244 | 0.499 | 0.530 | 0.527 | 0.408 | 0.197 | 1.13 | 0.144 | 6.89 | 0.004 | 0.187 | 38.01 | <10−8 | <10−6 | 25.18 | <10−5 | <10−4 | |
| Inferior frontal gyrus triangular part | 0.545 | 0.446 | 0.564 | 0.483 | 0.249 | 0.163 | 5.83 | 0.008 | 0.308 | 5.30 | 0.011 | 0.393 | 31.67 | <10−7 | <10−5 | 19.71 | <10−4 | 0.0005 |
| Inferior frontal gyrus orbital part | 0.135 | 0.360 | 0.298 | 0.420 | 0.107 | 0.163 | 0.74 | 0.194 | 2.51 | 0.057 | 7.49 | 0.011 | 0.083 | 15.51 | <0.001 | 0.004 | ||
| Rolandic Operculum | 0.605 | 0.297 | 0.600 | 0.513 | 0.304 | 0.282 | 9.17 | 0.001 | 0.066 | 2.18 | 0.070 | 39.11 | <10−8 | <10−7 | 27.98 | <10−6 | <10−4 | |
| Supplementary motor area | 0.651 | 0.565 | 0.600 | 0.552 | 0.373 | 0.344 | 7.99 | 0.002 | 0.111 | 4.39 | 0.018 | 0.567 | 45.72 | <10−10 | <10−8 | 36.47 | <10−8 | <10−6 |
| Superior frontal gyrus medial | 0.364 | 0.576 | 0.351 | 3.02 | 0.041 | 0.944 | 38.79 | <10−8 | <10−7 | |||||||||
| Superior frontal gyrus medial orbital | 0.000 | 0.613 | 0.214 | 0.599 | 0.248 | 0.326 | 0.00 | 1 | 7.84 | 0.003 | 0.118 | 8.34 | 0.008 | 0.062 | 40.22 | <10−9 | <10−7 | |
| Gyrus rectus | 0.209 | 0.550 | 0.269 | 0.569 | 0.004 | 0.237 | 1.69 | 0.097 | 8.29 | 0.002 | 0.101 | 4.18 | 0.062 | 0.128 | 31.57 | <10−7 | <10−5 | |
| Paracentral Lobule | 0.630 | 0.664 | 0.656 | 0.664 | 0.392 | 0.334 | 8.30 | 0.002 | 0.101 | 13.48 | <0.001 | 0.008 | 54.25 | <10−12 | <10−10 | 50.26 | <10−11 | <10−9 |
| Insula and cingulate gyri | ||||||||||||||||||
| Anterior cingulate and paracingulate gyri | 0.253 | 0.491 | 0.582 | 0.549 | 0.399 | 0.155 | 1.80 | 0.090 | 6.80 | 0.005 | 0.191 | 43.07 | <10−9 | <10−7 | 26.07 | <10−5 | <10−4 | |
| Median cingulate and paracingulate gyri | 0.550 | 0.307 | 0.533 | 0.465 | 0.300 | 0.237 | 4.54 | 0.017 | 0.563 | 2.05 | 0.076 | 30.84 | <10−6 | <10−5 | 21.45 | <10−4 | <0.001 | |
| Posterior cingulate gyrus | 0.462 | 0.338 | 0.545 | 0.604 | 0.082 | 0.305 | 7.79 | 0.003 | 0.118 | 3.63 | 0.028 | 0.736 | 23.23 | <10−5 | <0.001 | 40.12 | <10−9 | <10−7 |
| Occipital lobe | ||||||||||||||||||
| Calcarine fissure and surrounding cortex | 0.000 | 0.243 | 0.365 | 0.371 | 0.268 | 0.259 | 0.00 | 1 | 0.72 | 0.199 | 17.63 | <10−4 | 0.001 | 16.91 | 0.0001 | 0.001 | ||
| Cuneus | 0.304 | 0.224 | 0.505 | 0.296 | 0.200 | −0.046 | 2.82 | 0.047 | 0.951 | 2.23 | 0.068 | 24.00 | 10−5 | 10−4 | 3.61 | 0.082 | 0.128 | |
| Lingual gyrus | 0.067 | 0.440 | 0.309 | 0.482 | 0.052 | 0.160 | 0.54 | 0.232 | 4.04 | 0.022 | 0.620 | 6.30 | 0.021 | 0.128 | 20.93 | <10−4 | <0.001 | |
| Superior occipital gyrus | 0.599 | 0.518 | 0.694 | 0.632 | 0.112 | 0.076 | 18.27 | <10−4 | <0.001 | 12.81 | <0.001 | 0.011 | 42.79 | <10−9 | <10−7 | 29.94 | <10−6 | <10−5 |
| Middle occipital gyrus | 0.485 | 0.363 | 0.591 | 0.470 | 0.035 | 0.001 | 10.55 | 0.0006 | 0.035 | 5.75 | 0.008 | 0.313 | 26.37 | <10−6 | <10−4 | 14.19 | <0.001 | 0.004 |
| Inferior occipital gyrus | 0.357 | 0.395 | 0.462 | 0.542 | 0.240 | −0.036 | 2.28 | 0.066 | 8.67 | 0.002 | 0.086 | 21.39 | <10−4 | <0.001 | 15.84 | <0.001 | 0.002 | |
| Parietal lobe | ||||||||||||||||||
| Postcentral gyrus | 0.638 | 0.646 | 0.694 | 0.672 | 0.227 | 0.268 | 18.15 | <10−4 | <0.001 | 16.19 | <10−4 | 0.002 | 48.04 | <10−10 | <10−8 | 48.30 | <10−10 | <10−8 |
| Superior parietal gyrus | 0.651 | 0.689 | 0.697 | 0.699 | 0.253 | 0.329 | 18.30 | <10−5 | <0.001 | 17.60 | <10−4 | 0.001 | 50.30 | <10−11 | <10−9 | 56.74 | <10−12 | <10−10 |
| Inferior parietal gyrus | 0.525 | 0.656 | 0.485 | 0.636 | 0.300 | 0.350 | 3.96 | 0.023 | 0.629 | 9.36 | 0.001 | 0.061 | 26.59 | <10−6 | <10−4 | 47.79 | <10−10 | <10−9 |
| SupraMarginal gyrus | 0.446 | 0.540 | 0.510 | 0.592 | 0.316 | 0.190 | 2.86 | 0.045 | 0.951 | 8.61 | 0.002 | 0.087 | 30.62 | <10−6 | <10−5 | 31.84 | <10−7 | <10−5 |
| Angular gyrus | 0.484 | 0.505 | 0.600 | 0.465 | 0.059 | 0.281 | 11.34 | <0.001 | 0.023 | 2.96 | 0.043 | 0.944 | 25.04 | <10−5 | <10−4 | 24.77 | <10−5 | <10−4 |
| Precuneus | 0.492 | 0.638 | 0.533 | 0.658 | 0.185 | 0.260 | 5.21 | 0.011 | 0.405 | 10.76 | 0.0005 | 0.032 | 27.19 | <10−6 | <10−4 | 47.16 | <10−10 | <10−8 |
| Temporal lobe | ||||||||||||||||||
| Hippocampus | 0.250 | 0.385 | 0.206 | 0.483 | 0.210 | 0.048 | 0.00 | 1 | 4.90 | 0.013 | 0.470 | 6.23 | 0.022 | 0.128 | 17.22 | <10−4 | 0.001 | |
| ParaHippocampal gyrus | 0.000 | 0.295 | 0.078 | 0.00 | 1 | 5.76 | 0.028 | 0.128 | ||||||||||
| Fusiform gyrus | 0.555 | 0.651 | 0.072 | 10.38 | <0.001 | 0.037 | 37.66 | <10−8 | <10−6 | |||||||||
| Heschl gyrus | 0.413 | 0.418 | 0.472 | 0.562 | 0.126 | 0.238 | 4.54 | 0.017 | 0.563 | 4.40 | 0.018 | 0.567 | 17.91 | <10−4 | 0.001 | 31.56 | <10−7 | <10−5 |
| Superior temporal gyrus | 0.531 | 0.520 | 0.546 | 0.576 | 0.295 | 0.172 | 4.42 | 0.018 | 0.567 | 8.30 | 0.002 | 0.101 | 31.99 | <10−7 | <10−5 | 29.17 | <10−6 | <10−5 |
| Temporal pole superior temporal gyrus | 0.200 | 0.373 | 0.350 | 0.10 | 0.379 | 21.66 | <10−5 | <0.001 | ||||||||||
| Middle temporal gyrus | 0.442 | 0.496 | 0.528 | 0.516 | 0.084 | 0.204 | 7.70 | 0.003 | 0.122 | 6.73 | 0.005 | 0.194 | 20.07 | <10−4 | <0.001 | 24.26 | <10−5 | <10−4 |
| Inferior temporal gyrus | 0.473 | 0.513 | 0.553 | 0.500 | 0.345 | 0.282 | 3.56 | 0.030 | 0.741 | 3.37 | 0.033 | 0.795 | 35.75 | <10−8 | <10−6 | 26.64 | <10−6 | <10−4 |
In each region, the average thickness is computed, and the heritability was estimated for the average thickness. The regions with cortical thickness estimates test‐retest ICC < 0.6 are omitted. The P‐values were adjusted by False Discovery Rate (FDR) for 68 regions of interest. Bold indicates the adjusted P < 0.05 in the Likelihood Ratio Test (LRT) between ACE model and CE model.
Abbreviations: h 2, heritability index; ICCMZ, intraclass correlation between monozygotic twins; ICCDZ, intraclass correlation between dizygotic twins; : test statistic of LRT.
It is interesting to note that in the orbital part of middle frontal and medial superior frontal gyrus, asymmetric heritability was found. The CT of these parts in the right hemisphere was found to be more heritable, but not in the left hemisphere.
The common environment component was not statistically significant over the cortical surface to reject the null hypothesis that the shared common environment component C = 0 in the ACE model as compared to the AE model. The effects of common environment on ROI‐average CT were also found to be marginal and not statistically significant.
ACE Analysis of WM Fiber Tracts
For the comparison between the heritability patterns of CT and WM connections, we show in Figure 3 the results of ACE analysis we previously presented [Shen et al.,, 2014]. We show in Figure 4a the sagittal projection of heritable WM fiber tracts with average heritability index h 2 > 0.45. In Figure 4b,c we show the results after mapping the average heritability along each tract on the cortical surface where it connected. For each cortical ROI defined by the AAL atlas, we plot the mean heritability of all of the tracts originating or ending in that ROI (Fig. 4b), and the percentage of tracts terminating in each ROI that were found to be heritable at the level h 2 > 0.3 is shown in Figure 4c. The average heritability of tracts ending in the medial superior frontal gyri (left and right), medial orbitofrontal gyri (left and right), right paracentral lobule, and right hippocampus was greater than 0.3. A substantial subpopulation of fiber tracts (> 10%) ending in the left superior frontal gyrus, medial superior frontal gyri (left and right), medial orbitofrontal gyri (left and right), right hippocampus, right posterior cingulate gyrus had a heritability greater than 0.4. Fibers with strong genetic influence were also found to connect to right postcentral gyrus, bilateral precuneus, bilateral cingulate gyri, the left middle frontal gyrus, and right calcarine sulcus.
Figure 4.
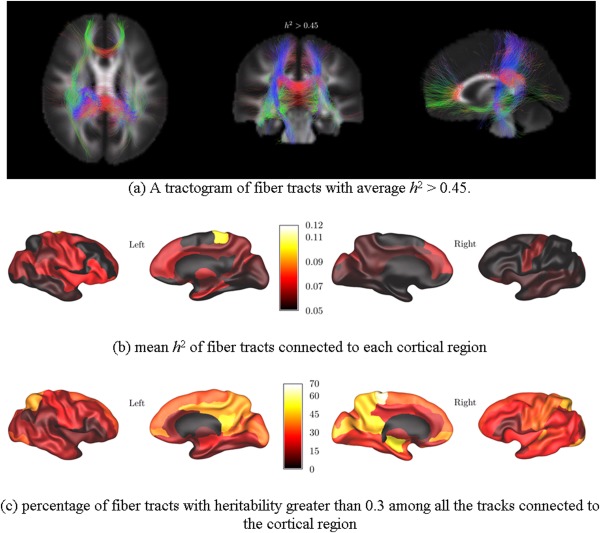
Cortical regions connected by heritable white matter (WM) tracts. The tractograms are color‐coded to indicate the direction of the fibre tract: the blue for superior‐inferior, red for left‐right, and green for anterior‐posterior. (This figure has been previously published by the authors (Shen et al., 2014), with modifications).
Genetic Correlation Between Connectivity and Cortical Thickness
We analyzed the genetic correlations between WM connectivity and GM thickness in cortical 48 cortical regions with reliable and heritable CT and FOD measures. The P‐values from the LRTs testing the significance of the genetic correlations are FDR‐adjusted for 48 regions. The results of bivariate model in these cortical regions are listed in Table 4, and the genetic correlation r g of the cortical regions are mapped to the cortical surface (Fig. 5). We found the CT of the left posterior cingulate and the WM tracts connecting to it have the highest genetic correlation, other regions such as the opercular part of left inferior frontal gyrus, right postcentral gyrus, and right middle temporal gyrus also display high genetic correlation, but are not significant enough after adjusting for multiple comparisons.
Table 4.
The phenotypic and genetic correlation between cortical thickness and WM connectivity in cortical regions
| Left | Right | |||||||
|---|---|---|---|---|---|---|---|---|
| r p | r g (95% CI) | statistic | r e | r p | r g (95% CI) | statistic | r e | |
| Frontal lobe | ||||||||
| Precentral gyrus | 0.086 a | 0.008 (−0.192 – 0.198) | 0.006 | 0.269 a | −0.042 | −0.117 (−0.315 – 0.08) | 1.36 | 0.141 |
| Superior frontal gyrus dorsolateral | 0.029 | 0.041 (−0.152 – 0.234) | 0.17 | −0.011 | −0.114 | −0.159 (−0.338 – 0.027) | 2.83 | −0.017 |
| Superior frontal gyrus orbital part | 0.089 | 0.171 (−0.053 – 0.391) | 2.25 | −0.073 | ||||
| Middle frontal gyrus | 0.091 | 0.114 (−0.074 – 0.3) | 1.42 | −0.025 | −0.113 | −0.097 (−0.277 – 0.092) | 1.03 | −0.180 |
| Middle frontal gyrus orbital part | −0.075 a | 0.002 (−0.225 – 0.252) | 0.00 | −0.313 a | ||||
| Inferior frontal gyrus opercular part | 0.165 a | 0.276 (0.055 – 0.498) a | 6.00 | −0.036 | −0.014 | −0.032 (−0.07 – −0.032) | 0.08 | 0.014 |
| Inferior frontal gyrus triangular part | −0.102 a | −0.035 (−0.062 – −0.035) | 0.10 | −0.293 a | ||||
| Inferior frontal gyrus orbital part | −0.097 | −0.15 (−0.372 – 0.078) | 1.69 | −0.066 | ||||
| Rolandic operculum | 0.063 | −0.044 (−0.272 – 0.181) | 0.15 | 0.203 | ||||
| Supplementary motor area | 0.014 | 0.017 (−0.180 – 0.212) | 0.029 | 0.008 | −0.051 | −0.129 (−0.337 – 0.082) | 1.45 | 0.086 |
| Superior frontal gyrus medial | 0.032 | 0.024 (−0.03 – 0.074) | 0.06 | −0.007 | ||||
| Superior frontal gyrus medial orbital | −0.039 | −0.081 (−0.284 – 0.123) | 0.60 | 0.004 | ||||
| Paracentralobule | −0.031 | −0.084 (−0.285 – 0.115) | 0.68 | 0.095 | −0.017 | −0.087 (−0.296 – 0.118) | 0.68 | 0.142 |
| Insula and cingulate gyri | ||||||||
| Median cingulate and paracingulate gyri | 0.016 | −0.054 (−0.274 – 0.161) | 0.24 | 0.117 | ||||
| Posterior cingulate gyrus | −0.216 a | −0.365 (−0.411 – −0.156) a, b | 11.10 | 0.019 | 0.011 | −0.047 (−0.257 – 0.162) | 0.20 | 0.114 |
| Occipital lobe | ||||||||
| Calcarine fissure and surrounding cortex | −0.043 | −0.133 (−0.394 – 0.118) | 1.08 | 0.076 | ||||
| Cuneus | −0.004 | −0.063 (−0.323 – 0.189) | 0.24 | 0.062 | 0.068 | 0.064 (−0.379 – 0.469) | 0.12 | 0.070 |
| Superior occipital gyrus | −0.039 | −0.185 (−0.437 – 0.051) | 2.34 | 0.191 | 0.051 | 0.084 (−0.132 – 0.29) | 0.60 | 0.019 |
| Middle occipital gyrus | 0.043 | 0.089 (0.049 – 0.347) | 0.43 | 0.006 | 0.068 | 0.005 (−0.275 – 0.262) | 0.001 | 0.143 |
| Inferior occipital gyrus | 0.037 | −0.069 (−0.385 – 0.219) | 0.21 | 0.141 | ||||
| Parietal lobe | ||||||||
| Postcentral gyrus | −0.063 | −0.094 (−0.299 – 0.105) | 0.85 | 0.062 | −0.120 a | −0.261 (−0.465 – −0.062) a | 6.66 | 0.256 a |
| Superior parietal gyrus | −0.001 | −0.131 (−0.38 – 0.094) | 1.26 | 0.263 a | −0.059 | −0.176 (−0.385 – 0.027) | 2.86 | 0.234 a |
| Inferior parietal gyrus | 0.016 | −0.088 (−0.367 – 0.163) | 0.45 | 0.168 | −0.022 | −0.041 (−0.249 – 0.167) | 0.15 | 0.039 |
| Supramarginal gyrus | 0.053 | 0.088 (−0.139 – 0.3) | 0.61 | 0.024 | 0.060 | 0.15 (−0.068 – 0.366) | 1.83 | −0.084 |
| Angular gyrus | −0.015 | −0.159 (−0.463 – 0.108) | 1.31 | 0.171 | 0.036 | −0.062 (−0.314 – 0.17) | 0.26 | 0.197 |
| Precuneus | −0.060 | −0.107 (−0.339 – 0.117) | 0.87 | 0.052 | −0.002 | −0.068 (−0.276 – 0.13) | 0.44 | 0.191 |
| Temporal lobe | ||||||||
| Hippocampus | −0.019 | 0.007 (−0.253 – 0.265) | 0.00 | −0.030 | ||||
| Heschl gyrus | 0.102 | 0.197 (−0.027 – 0.421) | 2.99 | −0.067 | ||||
| Superior temporal gyrus | 0.098 | 0.16 (−0.066 – 0.38) | 1.96 | −0.008 | −0.010 | −0.032 (−0.066 – 0.178) | 0.09 | 0.053 |
| Middle temporal gyrus | −0.025 | −0.139 (−0.297 – −0.139) | 1.20 | 0.136 | −0.149 a | −0.307 (−0.462 – −0.09) a | 7.58 | 0.116 |
The WM connectivity for each cortical region is computed as the average FOD peak size along all the tracts linked to that region
Unadjusted P < 0.05.
FDR adjusted P < 0.05. The P‐values are estimated by likelihood ratio tests. Only regions with reliable and heritable cortical thickness and connectivity measures (test‐retest ICC > 0.6, h 2 > 0.2) are included. The false discovery rate (FDR) adjustment was applied to the 48 regions included for test the significance of genetic correlation. r p: phenotypic correlation; r g: genetic correlation; : test statistic of LRT for genetic correlation.
Figure 5.
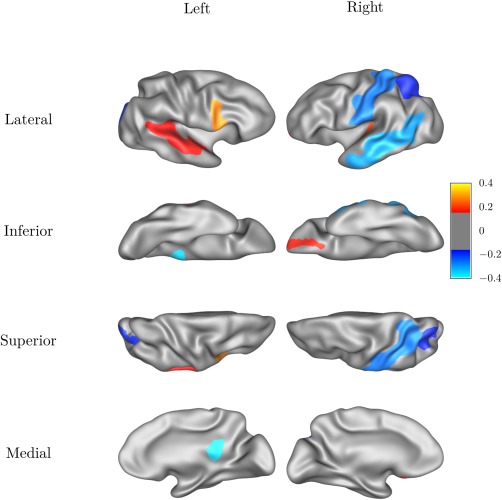
The genetic correlation rg between the cortical thickness and white matter connectivity measured for each cortical region.
With the inclusion criteria, the genetic correlation was estimated for 1662 pairwise connections between cortical regions of reliable and heritable CT and connectivity measures. The FDR‐adjustment was applied to the results of 1662 connections, and the significant findings are listed in Table 5. The tracts showing significant genetic correlation are shown in Figure 6. The majority of connections showing high degree of genetic correlation between their WM FOD measure and the cortical GM they connected were linked to the left posterior cingulate. In addition, the connection from right postcentral gyrus also showed significant genetic correlation.
Table 5.
The phenotypic and genetic correlation between cortical thickness and WM connectivity between cortical regions
| Connection | r p (FDR adjusted P) | r g (95% CI) | statistic | FDR adjusted Pg | r e |
|---|---|---|---|---|---|
| Inferior frontal gyrus triangular part (R) – Posterior cingulate gyrus (L) | −0.334 (<10−3) | −0.480 (−0.660 – −0.288) | 20.81 | 0.008 | −0.109 |
| Inferior frontal gyrus orbital part (R) – Posterior cingulate gyrus (L) | −0.357 (<10−5) | −0.581 (−0.771 – −0.385) | 26.30 | <10−3 | −0.073 |
| Gyrus rectus (R) – Posterior cingulate gyrus (L) | −0.315 (0.001) | −0.495 (−0.725 – −0.242) | 18.80 | 0.024 | −0.055 |
| Superior parietal gyrus (R) – Posterior cingulate gyrus (L) | −0.237 (0.027) | −0.493 (−0.621 – −0.293) | 21.99 | 0.005 | 0.255 (unadjusted P = 0.027) |
| Supramarginal gyrus (R) – Posterior cingulate gyrus (L) | −0.243 (0.038) | −0.476 (−0.599 – −0.284) | 20.97 | 0.008 | 0.193 |
| Precuneus (R) – Posterior cingulate gyrus (L) | −0.236 (0.108) | −0.469 (−0.583 – −0.266) | 19.08 | 0.021 | 0.174 |
| Superior temporal gyrus (R) – Posterior cingulate gyrus (L) | −0.316 (<10−3) | −0.531 (−0.7 – −0.353) | 29.05 | <10−3 | 0.113 |
| Middle temporal gyrus (R) – Posterior cingulate gyrus (L) | −0.371 (<10−6) | −0.598 (−0.747 – −0.435) | 40.11 | <10−6 | 0.125 |
| Inferior temporal gyrus (R) – Posterior cingulate gyrus (L) | −0.377 (<10−5) | −0.551 (−0.709 – −0.373) | 27.77 | <10−3 | −0.091 |
| Postcentral gyrus (R) – Posterior cingulate gyrus (L) | −0.250 (0.019) | −0.499 (−0.695 – −0.301) | 22.78 | 0.003 | 0.233 (unadjusted P = 0.044) |
| Postcentral gyrus (R) – gyrus rectus (R) | −0.226 (0.230) | −0.468 (−0.607 – −0.254) | 17.52 | 0.046 | 0.189 |
The WM connectivity was computed for each pair of cortical region as the average FOD peak size along all the tracts between them. The average cortical thickness of a pair of regions is used as the other measure in the bivariate model. Only regions with reliable and heritable cortical thickness and connectivity measures (test‐retest ICC > 0.6, h 2 > 0.2) are included. The false discovery rate (FDR) adjustment was applied to the 1662 connections included for the estimation of genetic correlation.
Abbreviations: r p, phenotypic correlation; r g, genetic correlation; r e, environment correlation; : test statistic of LRT for genetic correlation; P g: P‐value of LRT for genetic correlation. The environment correlations are not significant after FDR correlation, and therefore not listed.
Figure 6.
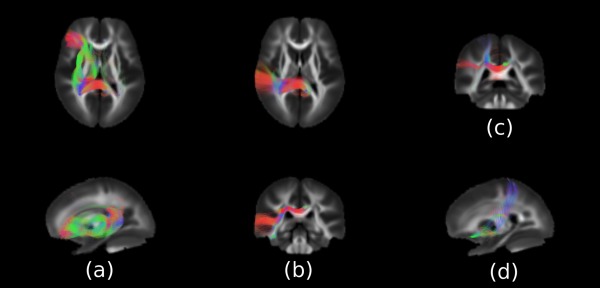
White matter connections with significant genetic correlation between connectivity measured by Fibre Orientation Distribution (FOD) and the average cortical thickness of the regions linked by the connection. The figure shows the connections (a) between the left posterior cingulate and the frontal lobe, (b) between the left cingulate and the temporal lobe (c) between the left cingulate and the parietal lobe, (d) between the right postcentral gyrus and the gyrus rectus.
DISCUSSION
There are three main findings from this study: (i) cortical thickness was found to be heritable in several cortical regions, including the paracentral gyri, various cortical regions in the frontal lobe, and the superior parietal gyri; (ii) the innervating WM tracts from these regions were also found to be heritable; (iii) in overlapping regions with heritable GM thickness and connected by heritable WM tracts, significant genetic correlations between WM connectivity and GM thickness were discovered, especially in the posterior cingulate gyrus.
In general, heritable cortical thickness measurements were found mainly in frontal and parietal lobes. Similar patterns in the heritability of cortical thickness have been reported in a prior study by Joshi et al., [2011] on the same twin study (using a different set of subjects) with the CT estimated using the FreeSurfer software. We found the pronounced heritability in the CT of precentral and postcentral gyri bilaterally along with the paracentral lobules continuous to them. Strong genetic influence has been reported in prior studies [Winkler et al., 2010], and the development of the primary somatosensory cortex in these regions has been shown to be highly genetically determined [Lenroot et al., 2009].
In the frontal lobe, we found CT in dorsolateral part of bilateral superior frontal gyri, bilateral middle frontal gyri, bilateral supplementary motor areas, medial and medial orbital parts of the right superior frontal gyrus show high heritability which have also been previously reported [Eyler et al., 2012; Panizzon et al., 2009]. Lenroot et al., [2009] found significant genetic effects on the CT in the frontal pole, dorsolateral and orbital prefrontal cortices, and prefrontal gyrus. A VBM study also revealed high heritability in GM density in medial prefrontal cortex and superior frontal gyrus [Hulshoff Pol et al., 2006]. Thickness estimated in the right orbitofrontal cortex was also found to be heritable in our study, in agreement with prior findings of genetic influence in this area [Lenroot et al., 2009; Shen et al., 2014]. In contrast, a VBM study found the GM concentration not significantly heritable in this region [Schmitt et al., 2014].
In the parietal lobe, our finding of heritable CT in the superior parietal gyrus agrees with previous reports [Lenroot et al., 2009; Panizzon et al., 2009]. Left precuneus CT was found to be heritable in one study [Panizzon et al., 2009], while in our results the right precuneus was detected with higher heritability. Our results also confirmed the heritable CT of superior temporal gyri [Lenroot et al., 2009; Schmitt et al., 2014; Winkler et al., 2010], where the GM density was also found to be heritable [Hulshoff Pol et al., 2006].
By comparing the heritability of cortical GM thickness measured on sMRI and that of WM tracts measured using dMRI, we found that the regions where the cortical GM thickness is under strong genetic influence were also linked by WM tracts that were heritable. The paracentral gyri, especially the postcentral gyri and paracentral lobules were connected by the corticospinal tracts and commissural connections through corpus callosum which we found both to be heritable in our analysis of the dMRI [Shen et al., 2014]. In the frontal lobe, The WM tractography analysis also found a number of tracts connecting these areas, via the highly heritable tracts projecting through the genu of corpus callosum [Brouwer et al., 2010; Pfefferbaum et al., 2001, Chiang et al., 2009]. The tractographic analysis revealed that among the tracts projecting into the orbitofrontal cortex, fibers with higher heritability (h 2 > 0.3) included the inter‐hemisphere connections found within the forceps minor and the inferior fronto‐occipital fasciculi connecting the orbital surface.
In cortical regions with overlapping heritable measures from sMRI and dMRI, genetic correlations between these measures were also found. In particular, in areas such as the right postcentral gyrus, left posterior cingulate gyrus, and right middle temporal gyrus, we find not only that both their GM thickness and WM connections are heritable, but also indications of a significant genetic correlation that the WM and GM traits in these regions may share common genes that influence their development. Further analyses revealed that the genetically correlated WM tracts and GM cortices were connected via association fibres in the external capsule, projection fibres in the internal capsule, and commissural fibres linking the posterior cingulate through the splenium of corpus callosum. Kochunov et al., [2011b] reported significant phenotypic correlations between global as well as regional GM‐FA trait pairs across the brain in an older cohort. Quantitative trait linkage analysis and single nucleotide polymorphism (SNP) association analyses limited to chromosome 15 localized a number of potential SNPs in RORA, NARG2, and ADAM10 genes that may influence the FA in the body of corpus callosum and the CT of the cingulate, and parietal, temporal, and occipital lobes.
It is interesting to note that in the regions where we observed significant genetic correlations between WM and GM, the environment components of WM and GM were correlated in the opposite direction. Hence the sizes of the phenotypic correlations were smaller than those of the genetic correlations. In particular, in the right postcentral gyrus, as well as its connection with the left posterior cingulate, and the connection between the left posterior cingulate and the right superior parietal gyrus, we found the genetic correlations to be significantly negative, while the environment correlations were significantly positive (unadjusted).
The process of cortex thinning is present in young population over a wide range of ages (5 – 32 years) with accelerated thinning during the adolescence [Zhou et al., 2015], while in WM tracts consistent increase in FA and decrease in MD were found [Lebel and Beaulieu, 2011]. Despite the overall positive correlation between the CT and WM integrity during the lifetime [Kochunov et al., 2011a], the correlations between WM connectivity and GM thickness are overall negative in our cohort (with the exception of the opercular part of the left inferior frontal gyrus), which falls in the age group (19 – 29) during which general cortical thinning occurs. The thinning has been attributed to cortical area expansion due to WM volume growth [Seldon, 2005], synaptic pruning [Huttenlocher and Dabholkar 1997, Sowell et al., 2004], and myelin proliferation into the cortex [Lenroot et al., 2009, Sowell et al., 2003, 2004). The cortical surface area expansion, in which the WM volume growth plays an important role [Seldon, 2005], might have contributed to the thinning, but in the age range of our study the surface area remains stable [Amlien et al., 2016]. In addition, CT and cortical surface were also suggested to be subject to distinct genetic influences as low genetic correlation between them was reported in an sMRI study, despite that they are both highly heritable [Panizzon et al., 2009]. To test the hypothesis that cortical thinning is due to the migration of myelin toward GM/WM boundary, DTI was used to measure superficial WM maturation, and did not find substantial overlap between superficial WM and cortical thinning [Wu et al., 2014], although cortical thinning and the decrease of mean diffusivity in distal WM from a depth of half of the CT beneath the GM/WM boundary was found to overlap and especially in sulcal regions [Vandekar et al., 2015].
Common environmental influences on cortical development were previously found to be minimal, with an AE model the preferred method to characterize the genetic and environmental influences on cortical thickness [Eyler et al., 2011]. In our study, little effects of common environment were detected on the CT. However this may result from the limitation of the twin study design, which in many cases tends to underestimate the common environmental component, and attribute the excess MZ correlation to genetic effects [Grayson 1989; Hopper and Visscher, 2005]. [TQ2]In addition, given the sample size and the limitation of the ACE models, the common environment effects are difficult to detect [Visscher et al., 2008].
Another limitation of the approach we used in this paper is that the heritability findings on cortex and WM were limited by the test‐retest reliability of the measurements. We masked out those areas where the test‐retest reliability was low (ICC < 0.6), so the error due to inter‐scan variability is explicitly controlled in the result. As a result, several areas were not considered in the analysis although they may also exhibit interesting patterns of heritability.
CONFLICT OF INTEREST
We declare no conflict of interest with regard to the subject matter in this submission.
ACKNOWLEDGEMENT
The authors are grateful to the twins for their generosity of time and willingness to participate in our study. They thank the many research assistants, radiographers, and other staff at QIMR Berghofer Medical Research Institute, Brisbane, and the Centre for Advanced Imaging, University of Queensland, Australia.
Footnotes
Available at http://warwick.ac.uk/tenichols/apace
REFERENCES
- Acosta O, Bourgeat P, Zuluaga MA, Fripp J, Salvado O, Ourselin S (2009): Automated voxel‐based 3D cortical thickness measurement in a combined Lagrangian–Eulerian PDE approach using partial volume maps. Med Image Anal 13:730–743 (Includes Special Section on the 12th International Conference on Medical Imaging and Computer Assisted Intervention). [DOI] [PMC free article] [PubMed]
- Acosta O, Fripp J, Doré V, Bourgeat P, Favreau J‐M, Chételat G, Rueda A, Villemagne VL, Szoeke C, Ames D, Ellis KA, Martins RN, Masters CL, Rowe CC, Bonner E, Gris F, Xiao D, Raniga P, Barra V, Salvado O (2012): Cortical surface mapping using topology correction, partial flattening and 3D shape context‐based non‐rigid registration for use in quantifying atrophy in Alzheimer's disease. J Neurosci Meth 205:96–109. [DOI] [PubMed] [Google Scholar]
- Amlien IK, Fjell AM, Tamnes CK, Grydeland H, Krogsrud SK, Chaplin TA, Rosa MGP, Walhovd KB (2016): Organizing principles of human cortical development—Thickness and area from 4 to 30 years: Insights from comparative primate neuroanatomy. Cereb Cortex 26:257–267. [DOI] [PubMed]
- Annett M (1970): A classification of hand preference by association analysis. Br J Psychol 61:303–321. [DOI] [PubMed] [Google Scholar]
- Bartko JJ (1976): On various intraclass correlation reliability coefficients. Psychol Bull 83:762–765. [Google Scholar]
- Bartley AJ, Jones DW, Weinberger DR (1997): Genetic variability of human brain size and cortical gyral patterns. Brain 120:257–269. [DOI] [PubMed] [Google Scholar]
- Benjamini Y, Hochberg Y (1995): Controlling the false discovery rate: A practical and powerful approach to multiple testing. J R Stat Soc Ser B 57:289–300. [Google Scholar]
- Biondi A, Nogueira H, Dormont D, Duyme M, Hasboun D, Zouaoui A, Chantôme M, Marsault C (1998): Are the brains of monozygotic twins similar? A three‐dimensional MR study. AJNR Am J Neuroradiol 19:1361–1367. [PMC free article] [PubMed] [Google Scholar]
- Boker S, Neale M, Maes H, Wilde M, Spiegel M, Brick T, Spies J, Estabrook R, Kenny S, Bates T, Mehta P, Fox J (2011): OpenMx: An open source extended structural equation modeling framework. Psychometrika 76:306–317. [DOI] [PMC free article] [PubMed] [Google Scholar]
- Brouwer RM, Mandl RCW, Peper JS, van Baal GCM, Kahn RS, Boomsma DI, Hulshoff Pol HE (2010): Heritability of DTI and MTR in nine‐year‐old children. NeuroImage 53:1085–1092. [DOI] [PubMed] [Google Scholar]
- Chen X, Blokland G, Strike L, Nichols T (2013): Voxel‐wise and cluster‐based heritability inferences of fMRI data. In: 19th Annual Meeting of the Organization of Human Brain Mapping (OHBM), Seattle, WA.
- Chiang M‐C, Barysheva M, Shattuck DW, Lee AD, Madsen SK, Avedissian C, Klunder AD, Toga AW, McMahon KL, Zubicaray GI, de Wright MJ, Srivastava A, Balov N Thompson PM (2009): Genetics of brain fiber architecture and intellectual performance. J Neurosci 29:2212–2224. [DOI] [PMC free article] [PubMed] [Google Scholar]
- Dore V, Fripp J, Bourgeat P, Shen K, Salvado O, Acosta O (2011): Surface‐Base approach using a multi‐scale EM‐ICP registration for statistical population analysis. In: 2011 International Conference on Digital Image Computing Techniques and Applications (DICTA). Noosa, Queensland, Australia, pp 13–18.
- Eyler LT, Prom‐Wormley E, Panizzon MS, Kaup AR, Fennema‐Notestine C, Neale MC, Jernigan TL, Fischl B, Franz CE, Lyons MJ, Grant M, Stevens A, Pacheco J, Perry ME, Schmitt JE, Seidman LJ, Thermenos HW, Tsuang MT, Chen C‐H, Thompson WK, Jak A, Dale AM, Kremen WS (2011): Genetic and environmental contributions to regional cortical surface area in humans: A magnetic resonance imaging twin study. Cereb Cortex 21:2313–2321. [DOI] [PMC free article] [PubMed] [Google Scholar]
- Eyler LT, Chen C‐H, Panizzon MS, Fennema‐Notestine C, Neale MC, Jak A, Jernigan TL, Fischl B, Franz CE, Lyons MJ, Grant M, Prom‐Wormley E, Seidman LJ, Tsuang MT, Fiecas MJA, Dale AM, Kremen WS (2012): A comparison of heritability maps of cortical surface area and thickness and the influence of adjustment for whole brain measures: A magnetic resonance imaging twin study. Twin Res Hum Genet 15:304–314. [DOI] [PMC free article] [PubMed] [Google Scholar]
- Grayson DA (1989): Twins reared together: Minimizing shared environmental effects. Behav Genet 19:593–604. [DOI] [PubMed] [Google Scholar]
- Guo CC, Kurth F, Zhou J, Mayer EA, Eickhoff SB, Kramer JH, Seeley WW (2012): One‐year test–retest reliability of intrinsic connectivity network fMRI in older adults. NeuroImage 61:1471–1483. [DOI] [PMC free article] [PubMed] [Google Scholar]
- Hopper JL, Visscher PM (2005): Variance Component Analysis In: Encyclopedia of Biostatistics. Chichester, West Sussex, England; Hoboken, NJ: John Wiley. [Google Scholar]
- Hua K, Zhang J, Wakana S, Jiang H, Li X, Reich DS, Calabresi PA, Pekar JJ, van Zijl PCM, Mori S (2008): Tract probability maps in stereotaxic spaces: Analyses of white matter anatomy and tract‐specific quantification. NeuroImage 39:336–347. [DOI] [PMC free article] [PubMed] [Google Scholar]
- Hulshoff Pol HE, Schnack HG, Posthuma D, Mandl RCW, Baaré WF, Oel C, van Haren NE, van Collins DL, Evans AC, Amunts K, Bürgel U, Zilles K, Geus E, de Boomsma DI Kahn RS (2006): Genetic contributions to human brain morphology and intelligence. J Neurosci 26:10235–10242. [DOI] [PMC free article] [PubMed] [Google Scholar]
- Huttenlocher PR, Dabholkar AS (1997): Regional differences in synaptogenesis in human cerebral cortex. J Comp Neurol 387:167–178. [DOI] [PubMed] [Google Scholar]
- Jahanshad N, Lee AD, Barysheva M, McMahon KL, de Zubicaray GI, Martin NG, Wright MJ, Toga AW, Thompson PM (2010): Genetic influences on brain asymmetry: A DTI study of 374 twins and siblings. NeuroImage 52:455–469. [DOI] [PMC free article] [PubMed] [Google Scholar]
- Jeurissen B, Leemans A, Tournier J‐D, Jones DK, Sijbers J (2013): Investigating the prevalence of complex fiber configurations in white matter tissue with diffusion magnetic resonance imaging. Hum Brain Mapp 34:2747–2766. [DOI] [PMC free article] [PubMed] [Google Scholar]
- Jones Dk, Horsfield Ma, Simmons A (1999): Optimal strategies for measuring diffusion in anisotropic systems by magnetic resonance imaging. Magn Reson Med 42:515–525. [PubMed] [Google Scholar]
- Joshi AA, Leporé N, Joshi SH, Lee AD, Barysheva M, Stein JL, McMahon KL, Johnson K, de Zubicaray GI, Martin NG, Wright MJ, Toga AW, Thompson PM (2011): The contribution of genes to cortical thickness and volume. NeuroReport 22:101–105. [DOI] [PMC free article] [PubMed] [Google Scholar]
- Kochunov P, Glahn DC, Lancaster JL, Winkler AM, Smith S, Thompson PM, Almasy L, Duggirala R, Fox PT, Blangero J (2010): Genetics of microstructure of cerebral white matter using diffusion tensor imaging. NeuroImage 53:1109–1116. [DOI] [PMC free article] [PubMed] [Google Scholar]
- Kochunov P, Glahn DC, Lancaster J, Thompson PM, Kochunov V, Rogers B, Fox P, Blangero J, Williamson DE (2011a): Fractional anisotropy of cerebral white matter and thickness of cortical gray matter across the lifespan. NeuroImage 58:41–49. [DOI] [PMC free article] [PubMed] [Google Scholar]
- Kochunov P, Glahn D, Nichols T, Winkler A, Hong E, Holcomb H, Stein J, Thompson P, Curran J, Carless M, Olvera R, Johnson MP, Cole S, Kochunov V, Kent J, Blangero J (2011b): Genetic analysis of cortical thickness and fractional anisotropy of water diffusion in the brain. Front Neurosci 5:120. [DOI] [PMC free article] [PubMed] [Google Scholar]
- Lawson CL, Hanson RJ (1995): Solving Least Squares Problems. Philadelphia: SIAM. [Google Scholar]
- Lebel C, Beaulieu C (2011): Longitudinal development of human brain wiring continues from childhood into adulthood. J Neurosci 31:10937–10947. [DOI] [PMC free article] [PubMed] [Google Scholar]
- Lee A, Leporé N, Chou Y‐Y, Brun C, Barysheva M, Chang M‐C, Madsen SK, McMahon KL, de Zubicaray G., Wright MJ, Toga A, Thompson PM (2009): The multivariate A/C/E model and the genetics of fiber architecture. In: IEEE International Symposium on Biomedical Imaging: From Nano to Macro, 2009. ISBI '09. Boston, MA, pp 125–128. [DOI] [PMC free article] [PubMed]
- Lee AD, Lepore N, Brun CC, Barysheva M, Toga AD, McMahon KL, de Zubicaray GI, Martin NG, Wright MJ, Thompson PM (2010): Genetic influences on brain architecture from multivariate diffusion tensor data. In: 16th Annual Meeting of the Organization for Human Brain Mapping (OHBM). Barcelona, Spain.
- Lenroot RK, Schmitt JE, Ordaz SJ, Wallace GL, Neale MC, Lerch JP, Kendler KS, Evans AC, Giedd JN (2009): Differences in genetic and environmental influences on the human cerebral cortex associated with development during childhood and adolescence. Hum Brain Mapp 30:163–174. [DOI] [PMC free article] [PubMed] [Google Scholar]
- Leow AD, Zhu S, Zhan L, McMahon K, de Zubicaray GI, Meredith M, Wright MJ, Toga AW, Thompson PM (2009): The tensor distribution function. Magn Reson Med 61:205–214. [DOI] [PMC free article] [PubMed] [Google Scholar]
- Mori S, Wakana S, Zijl PCM van Nagae‐Poetscher LM (2005): MRI Atlas of Human White Matter. Elsevier. [DOI] [PubMed] [Google Scholar]
- Panizzon MS, Fennema‐Notestine C, Eyler LT, Jernigan TL, Prom‐Wormley E, Neale M, Jacobson K, Lyons MJ, Grant MD, Franz CE, Xian H, Tsuang M, Fischl B, Seidman L, Dale A, Kremen WS (2009): Distinct Genetic Influences on Cortical Surface Area and Cortical Thickness. Cereb Cortex 19:2728–2735. [DOI] [PMC free article] [PubMed] [Google Scholar]
- Pfefferbaum A, Sullivan EV, Carmelli D (2001): Genetic regulation of regional microstructure of the corpus callosum in late life. [Miscellaneous Article]. Neuroreport 12:1677–1681. [DOI] [PubMed] [Google Scholar]
- Raffelt D, Tournier J‐D, Rose S, Ridgway GR, Henderson R, Crozier S, Salvado O, Connelly A (2012): Apparent fibre density: A novel measure for the analysis of diffusion‐weighted magnetic resonance images. NeuroImage 59:3976–3994. [DOI] [PubMed] [Google Scholar]
- Rohlfing T, Rademacher MH, Pfefferbaum A (2008): Volume reconstruction by inverse interpolation: Application to interleaved mr motion correction In: Metaxas D, Axel L, Fichtinger G, Székely G, editors. Medical Image Computing and Computer‐Assisted Intervention – MICCAI 2008. Springer: Berlin. Heidelberg. Lecture Notes in Computer Science; pp 798–806. [DOI] [PMC free article] [PubMed] [Google Scholar]
- Rueda A, Acosta O, Couprie M, Bourgeat P, Fripp J, Dowson N, Romero E, Salvado O (2010): Topology‐corrected segmentation and local intensity estimates for improved partial volume classification of brain cortex in MRI. J Neurosci Meth 188:305–315. [DOI] [PubMed] [Google Scholar]
- Schmitt JE, Neale MC, Fassassi B, Perez J, Lenroot RK, Wells EM, Giedd JN (2014): The dynamic role of genetics on cortical patterning during childhood and adolescence. Proc Natl Acad Sci 11:6774–6779. [DOI] [PMC free article] [PubMed]
- Seldon HL (2005): Does brain white matter growth expand the cortex like a balloon? Hypothesis and consequences. Laterality 10:81–95. [DOI] [PubMed] [Google Scholar]
- Shaw P, Kabani NJ, Lerch JP, Eckstrand K, Lenroot R, Gogtay N, Greenstein D, Clasen L, Evans A, Rapoport JL, Giedd JN, Wise SP (2008): Neurodevelopmental trajectories of the human cerebral cortex. J Neurosci 28:3586–3594. [DOI] [PMC free article] [PubMed] [Google Scholar]
- Shen K‐K, Rose S, Fripp J, McMahon KL, de Zubicaray GI, Martin NG, Thompson PM, Wright MJ, Salvado O (2014): Investigating brain connectivity heritability in a twin study using diffusion imaging data. NeuroImage 100:628–641. [DOI] [PMC free article] [PubMed] [Google Scholar]
- Shrout PE, Fleiss JL (1979): Intraclass correlations: Uses in assessing rater reliability. Psychol Bull 86:420–428. [DOI] [PubMed] [Google Scholar]
- Sowell ER, Peterson BS, Thompson PM, Welcome SE, Henkenius AL, Toga AW (2003): Mapping cortical change across the human life span. Nat Neurosci 6:309–315. [DOI] [PubMed] [Google Scholar]
- Sowell ER, Thompson PM, Leonard CM, Welcome SE, Kan E, Toga AW (2004): Longitudinal mapping of cortical thickness and brain growth in normal children. J Neurosci 24:8223–8231. [DOI] [PMC free article] [PubMed] [Google Scholar]
- Thompson PM, Cannon TD, Narr KL, van Erp T, Poutanen V‐P, Huttunen M, Lönnqvist J, Standertskjöld‐Nordenstam C‐G, Kaprio J, Khaledy M, Dail R, Zoumalan CI, Toga AW (2001): Genetic influences on brain structure. Nat Neurosci 4:1253–1258. [DOI] [PubMed] [Google Scholar]
- Tournier J‐D, Yeh C‐H, Calamante F, Cho K‐H, Connelly A, Lin C‐P (2008): Resolving crossing fibres using constrained spherical deconvolution: Validation using diffusion‐weighted imaging phantom data. NeuroImage 42:617–625. [DOI] [PubMed] [Google Scholar]
- Tournier J‐D, Calamante F, Connelly A (2012): MRtrix: Diffusion tractography in crossing fiber regions. Int J Imaging Syst Technol 22:53–66. [Google Scholar]
- Tuch DS, Reese TG, Wiegell MR Van J, Wedeen (2003): Diffusion MRI of complex neural architecture. Neuron 40:885–895. [DOI] [PubMed] [Google Scholar]
- Tustison NJ, Avants BB, Cook PA, Zheng Y, Egan A, Yushkevich PA, Gee JC (2010): N4ITK: Improved N3 bias correction. IEEE Trans Med Imag 29:1310–1320. [DOI] [PMC free article] [PubMed] [Google Scholar]
- Tzourio‐Mazoyer N, Landeau B, Papathanassiou D, Crivello F, Etard O, Delcroix N, Mazoyer B, Joliot M (2002): Automated anatomical labeling of activations in SPM using a macroscopic anatomical parcellation of the MNI MRI single‐subject brain. NeuroImage 15:273–289. [DOI] [PubMed] [Google Scholar]
- Vandekar SN, Shinohara RT, Raznahan A, Roalf DR, Ross M, DeLeo N, Ruparel K, Verma R, Wolf DH, Gur RC, Gur RE, Satterthwaite TD (2015): Topologically dissociable patterns of development of the human cerebral cortex. J Neurosci 35:599–609. [DOI] [PMC free article] [PubMed] [Google Scholar]
- Visscher PM (2004): Power of the classical twin design revisited. Twin Res 7:505–512. [DOI] [PubMed] [Google Scholar]
- Visscher PM, Gordon S, Neale MC (2008): Power of the classical twin design revisited. II Detection of common environmental variance. Twin Res Hum Genet 11:48–54. [DOI] [PMC free article] [PubMed] [Google Scholar]
- Vos SB, Jones DK, Viergever MA, Leemans A (2011): Partial volume effect as a hidden covariate in DTI analyses. NeuroImage 55:1566–1576. [DOI] [PubMed] [Google Scholar]
- Wakana S, Caprihan A, Panzenboeck MM, Fallon JH, Perry M, Gollub RL, Hua K, Zhang J, Jiang H, Dubey P, Blitz A, van Zijl P, Mori S (2007): Reproducibility of quantitative tractography methods applied to cerebral white matter. NeuroImage 36:630–644. [DOI] [PMC free article] [PubMed] [Google Scholar]
- Wierenga LM, Langen M, Oranje B, Durston S (2014): Unique developmental trajectories of cortical thickness and surface area. NeuroImage 87:120–126. [DOI] [PubMed] [Google Scholar]
- Winkler AM, Kochunov P, Blangero J, Almasy L, Zilles K, Fox PT, Duggirala R, Glahn DC (2010): Cortical thickness or grey matter volume? The importance of selecting the phenotype for imaging genetics studies. NeuroImage 53:1135–1146. [DOI] [PMC free article] [PubMed] [Google Scholar]
- Wright MJ, Martin NG (2004): Brisbane adolescent twin study: Outline of study methods and research projects. Aus J Psychol 56:65–78. [Google Scholar]
- Wu M, Lu LH, Lowes A, Yang S, Passarotti AM, Zhou XJ, Pavuluri MN (2014): Development of superficial white matter and its structural interplay with cortical gray matter in children and adolescents. Hum Brain Mapp 35:2806–2816. [DOI] [PMC free article] [PubMed] [Google Scholar]
- Zaitsev M, Hennig J, Speck O (2004): Point spread function mapping with parallel imaging techniques and high acceleration factors: Fast, robust, and flexible method for echo‐planar imaging distortion correction. Magn Reson Med 52:1156–1166. [DOI] [PubMed] [Google Scholar]
- Zhou D, Lebel C, Treit S, Evans A, Beaulieu C (2015): Accelerated longitudinal cortical thinning in adolescence. NeuroImage 104:138–145. [DOI] [PubMed] [Google Scholar]