Abstract
Background:
Libidibia ferrea (Mart. ex Tul.) L.P. Queiroz (Fabaceae) is a tree which is native to Brazil, widely known as “Jucá,” where its herbal derivatives are used in folk medicine with several therapeutic properties. The constituents, which have already been described in the fruit, are mainly hydrolysable tannins (gallic acid [GA] and ellagic acid [EA]).
Objective:
The aim of this study was to investigate the phenolic variability in the fruit of L. ferrea by ultraviolet/visible (UV/VIS) and chromatographic methods (high-performance liquid chromatography [HPLC]/high-performance thin layer chromatography [HPTLC]).
Materials and Methods:
Several samples were collected from different regions of Brazil and the qualitative (fingerprints by HPTLC and HPLC) and quantitative analysis (UV/VIS and HPLC) of polyphenols were performed.
Results:
The HPTLC and HPLC profiles allowed separation and identification of both major analytical markers: EA and GA. The chemical profiles were similar in a number of spots or peaks for the samples, but some differences could be observed in the intensity or area of the analytical markers for HPTLC or HPLC, respectively. Regarding the quantitative analysis, the polyphenolic content by UV/VIS ranged from 13.99 to 37.86 g% expressed as GA or from 10.75 to 29.09 g% expressed as EA. The contents of EA and GA by liquid chromatography-reversed phase (LC-RP) method ranged from 0.57 to 2.68 g% and from 0.54 to 3.23 g%, respectively.
Conclusion:
The chemical profiles obtained by HPTLC or HPLC, as well as the quantitative analysis by spectrophotometry or LC-RP method, were suitable for discrimination of each herbal sample and can be used as tools for the comparative analysis of the fruits from L. ferrea.
SUMMARY
The polyphenols of fruits of Libidibia ferrea can be quantified by UV/VIS and HPLC
The HPLC method was able to detect the gallic and ellagic acids in several samples of fruits of Libidibia ferrea
The phenolic profiles of fruits from Libidibia ferrea by HPTLC and HPLC were reproductible.
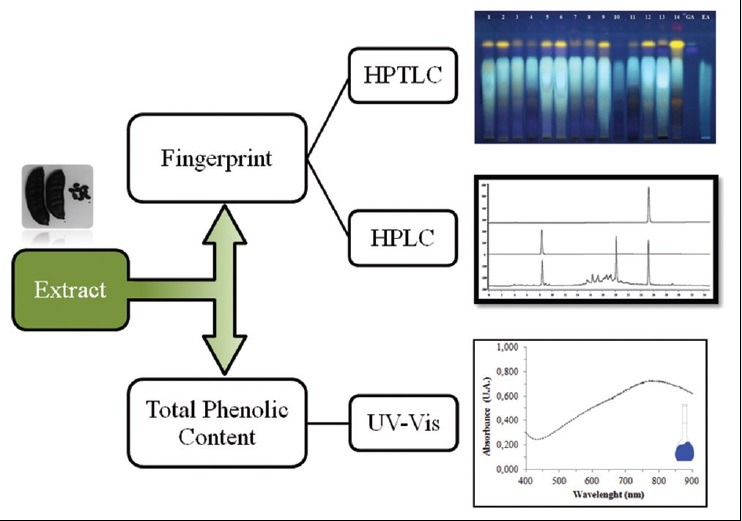
Abbreviations used: HPTLC: high performance thin layer chromatography, HPLC: high performance liquid chromatography, UV-Vis: spectrophotometry
Keywords: Libidibia ferrea, high-performance liquid chromatography, high-performance thin layer chromatography, phenolics compounds, spectrophotometry
INTRODUCTION
Libidibia ferrea (Mart. ex Tul.) L.P. Queiroz is a tree native to Brazil, which belongs to the family Fabaceae,[1] it is widely distributed in the Northern and Northeastern regions,[2] where it is popularly known as “Pau ferro” or “Jucá.”[3,4]
It has been reported that various parts of this species (bark, fruits, leaves, and seeds) are used in Brazilian folk medicine with several pharmacological properties. In this sense, several biological properties are reported for the fruits of L. ferrea [Figure 1]. The methanolic extract showed antifungal and antibacterial activities against oral pathogens;[5] and the aqueous crude extract showed related antiulcer, anti-inflammatory, and analgesic effects.[3,6] In addition, the aqueous infusion has been used by the population in the prevention of cancer.[7] Moreover, the aqueous extract of the fruit presented antiviral properties of sulfated polysaccharide for herpes simplex virus type-1 and poliovirus type-1,[8] and extracts and polysaccharide fractions of pods demonstrated anti-inflammatory activity.[9] Several authors attribute the activities to the polyphenols and polysaccharides, which are the main constituents of the aqueous extracts.[9,10,11]
Figure 1.
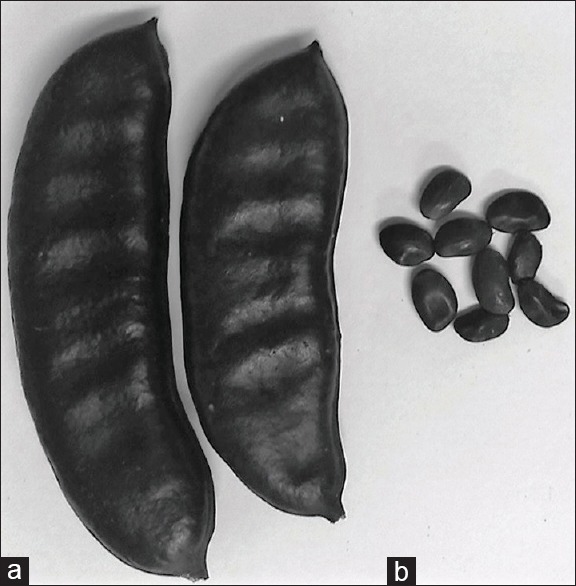
(a) Fruit and (b) seeds from Libidibia ferrea (Mart. ex Tul.) L.P. Queiroz
Phytochemical investigation revealed the presence of flavonoids, saponins, tannins, and other phenolic compounds in the hydroalcoholic extracts of stem bark, bark, and leaves.[12,13,14] Gallic acid (GA), methyl gallate, and ellagic acid (EA) were isolated from the fruit.[7,10] Polysaccharides were reported many times in the seed of L. ferrea.[8,9,11,15,16]
Based on this information, the hydrolysable tannins (gallotannins and ellagitannins) have the potential to be considered the main component of the fruit of this species, either by their concentration in the drug material or by their pharmacological properties attributed to this species.
The total phenolic content is usually measured using the Folin-Ciocalteu spectrophotometric method, which is also adopted by the Brazilian Pharmacopoeia[17] and the European Pharmacopoeia.[18] However, possible interference has been described. To increase the specificity and eliminate interferences, several methods using high-performance liquid chromatography (HPLC) have been described for the determination of GA and[19,20,21] EA,[22,23,24] both in herbal drugs and biological matrices.[25] Once, GA and EA are determined in fruit and to prove the suitability of the method developed, it is necessary to perform validation of the methodology to establish acceptable parameters as well as to determine the total amount of the main compounds that are appropriate for the quality control.[26,27]
Furthermore, chromatographic techniques can be used to document the phytochemical fingerprints of chemical markers to identify variations in the herbal material. The analyses by thin-layer chromatography (TLC) play an important role as analytical tools for several codices such as the Chinese[28] and European[18] Pharmacopoeias. Recently, the use of high-performance TLC (HPTLC) improved the TLC technique due to its superior resolution and reproducibility.[29,30]
In this context, the present study was performed to develop and establish useful and simple procedures by HPTLC, HPLC, and sprectrophometry, which are able to detect, identify, and/or quantify the hydrolysable tannins and its variability in the drug material from the fruits of L. ferrea.
MATERIALS AND METHODS
Chemicals, reagents, and materials
Reference substances: GA (96% purity) and EA (from tree bark, 95% purity) were purchased from Sigma-Aldrich® (USA). Methanol was HPLC grade (J.T. Baker®, USA) and purified water was used (PURELAB® Classic UV, ELGA LabWater, USA). Other chemicals and solvents were of analytical grade.
Plant material
The fruits of L. ferrea were collected in Limoeiro (Pernambuco, Brazil). The plant material was identified, a voucher specimen (herbarium specimen number 88145) was deposited at the Pernambuco Agronomic Institute (Instituto Agronômico de Pernambuco - IPA), and this sample was used as a reference material. Another 13 samples were collected from different locations to verify the ability of the analytical procedures to evaluate the inter-sample variability.
High-performance thin layer chromatography analysis
Each of the 14 samples was prepared by extracting 1 g of powdered material with 25 mL of methanol for 1 min in a water bath at 85°C. After that, the extracts were filtrated in cotton and 25 μL of each of the samples and standards were applied at 7 mm band width, in tracks 1-16 in the following sequence on plate: Herbal samples (1–14), GA (15), and EA (16).
The HPTLC system (Camag®, Switzerland) consisted of a Linomat V sample applicator using 100 µL syringe (Hamilton®, Schweiz) connected to compressed air and winCATS® software (CAMAG®, Switzerland). Solvents for extraction and HPTLC grade solvents were purchased from J.T. Baker® (USA). Pre-coated TLC silica gel 60 F254 aluminum plates (20 cm × 10 cm; 250 µm thickness; Merck®, Germany) were used.
The plate was developed in a twin trough vertical glass chamber (20 cm × 10 cm; Camag®, Switzerland) using ethyl acetate:formic acid:water (90:5:5, v/v/v) as the mobile phase. The optimized chamber saturation time for the mobile phase was 30 min at room temperature (25 ± 2°C). After development, the plate was dried and the components were visualized by ultraviolet (UV) irradiation at 254 nm. Then, the plate was derivatized by spraying the NEU + PEG reagent and visualized under 365 nm. Each analysis was carried out in duplicate. The UV observations and image acquirements were performed using MultiDoc-It Imaging System® (Model 125, USA) with UVP® software and a Canon® camera (Rebel T3, EOS 1100 D).
Preparation of the extracts
Stock solution
The herbal drug extract was prepared using 1.0 g in a 250 mL round-bottomed flask with 150 mL of purified water and using the following procedure: Heat in a water-bath (LUCA-150/24/D; Lucadema®) for 30 min; cool under water and transfer quantitatively to a 250 mL volumetric flask; rinse the round-bottomed flask and collect the washings in the volumetric flask, and then diluted to 250 mL with purified water. After the suspended solids settle down, the solution was filtered through a filter paper and the first 50 mL of the filtrate was discarded.
Determination of total phenolic content
An aliquot of 5 mL from stock solution was then transferred to a 25 mL volumetric flask and the volume was completed with purified water (S1). Subsequently, an aliquot of 2 mL from S1 was transferred to a 25 mL volumetric flask, 2 mL of Folin-Ciocalteu and 10 mL of water were added, and the volume was filled with a solution of anhydrous sodium carbonate (Na2 CO3) 29%.[17,18] The samples were measured at 760 nm in an UV/visible (UV/Vis) spectrophotometer (Micronal®) at 30 min after the addition of the last reagent. Water was used as the blank. EA and GA were used as standards and results were expressed as equivalent per gram of dry weight of sample. Tests were carried out in triplicate.
High-performance liquid chromatography analysis
Standard solution
Standard solution of EA was prepared by accurately Weighing 5.0 mg in a volumetric flask of 10 mL. Then, it was dissolved in dimethyl sulfoxide (Vetec®) and placed in the ultrasonic bath for 30 min for the complete dissolution. From this solution, aliquots were transferred to a 10 mL volumetric flask and diluted with methanol:water (3:2, v/v). The standard solution of GA was prepared by accurately Weighing 25.0 mg in a volumetric flask of 25 mL, dissolving in purified water, and placing in the ultrasonic bath for 30 min for the complete dissolution. From this solution, aliquots were transferred to 10 mL volumetric flasks and diluted with purified water.
Sample preparation
An aliquot of 3.75 mL from stock solution was then transferred to a 10 mL volumetric flask and the volume was completed with purified water. Then, this solution was filtered through a 0.45 µm polyvinylidene difluoride membrane (15 mm, Macherey-Nagel®) and stored in vials.
Chromatographic conditions
Quantification of EA and GA was conducted on a HPLC (Ultimate 3000, Thermo Fisher Scientific®), coupled to a diode array detector (DAD; Thermo Fisher Scientific®) and equipped with a binary pump (HPG-3x00RS, Thermo Fisher Scientific®), a degasser, and an autosampler equipped with a loop of 20 µL (ACC-3000, Thermo Fisher Scientific®). For data analysis and processing, the software Chromeleon 6.8 (Dionex, Thermo Fisher Scientific®, USA) was used. The wavelength was set at 254 nm for detection of the EA and 270 nm for GA, in accordance with the maximum absorption measured by DAD. The chromatographic separations were achieved with a C18 column (250 mm × 4.6 mm i.d., particle size 5 µm) from Dionex® equipped with a guard column (C18, 4 mm × 3.9 µm, Phenomenex®). Separations were carried out at a column oven temperature of 24°C. The mobile phase consisted of purified water (A) and methanol (B), both acidified with 0.05% trifluoracetic acid (TFA), at a flow rate adjusted to 0.8 mL/min. A gradient program was applied as follows: 0–10 min, 12.5–25% B; 10–15 min, 25–40% B; 15–25 min, 40–75% B; 25–30 min, 75–75% B; 30–33 min, 75–12.5% B.
Wavelength selection, specificity, and identification of the peaks
The wavelength for the determination of peaks was performed by scanning the standards, EA, and GA, in the range from 190 nm to 400 nm. The analysis of the spectrum was used to confirm the identity of each compound of interest. In addition, scans from 190 nm to 400 nm were performed for the extract solution from the herbal material and for the spiked extractive solution with the standards (EA and GA) to verify the occurrence of deviation from the maximum wavelength. Therefore, the peaks in the samples were identified by comparing their retention time and area with the standards.
Validation procedure for quantitative analysis
The liquid chromatography (LC)-DAD procedure was validated in accordance with the guidelines from ICH (International Conference on the Harmonization of Technical Requirements for the Registration of Pharmaceuticals for Human Use – Q2/2005) and Brazilian Regulatory Agency – ANVISA (RE 899/2003).[26,27]
Quantification of ellagic acid and gallic acid
The concentrations of EA and GA were obtained using the corresponding calibration curves.
RESULTS AND DISCUSSION
High-performance thin layer chromatography analysis
The chromatographic analyses suggest that the phenolics are probably the main compounds in the fruits of L. ferrea. Bands (spots) were characterized in this study under UV at 254 nm before spraying and under 365 nm after spraying with NEU + PEG reagent. Thus, the Rfs values were calculated and compared with standards.
On the HPTLC plates, EA and GA were detectable as dark band under 365 nm before spraying with NEU + PEG reagent solution. After spraying with NEU + PEG reagent solution, the plates were analyzed and the EA showed a band with green color and the GA was blue. Derivatization with NEU followed PEG and visualization under 365 nm was best suited for band detection.
The chromatography profiles for the polyphenolic compound of all samples are shown in Figure 2. The samples showed bands corresponding to both the standards (EA and GA), confirmed by the color and Rf (Rf EA 0.60 and Rf GA 0.68). The samples coded as 1, 5, 6, 12, and 13 showed higher intensity for the EA and GA spots. Furthermore, an additional yellow band at Rf 0.73 was also detected in all samples. In addition, oranges bands typical for flavonoids at Rf 0.31 and Rf 0.10 could be observed in some samples. The first orange spot was observed in samples 8, 11, and 14; the second orange spot was detected only in the sample from “Brasília.”
Figure 2.
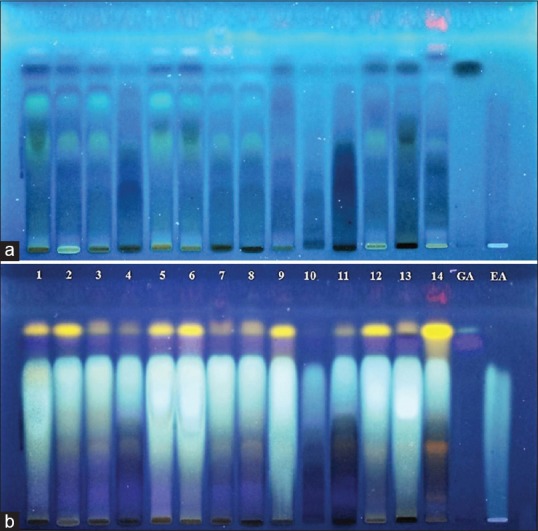
High-performance thin layer chromatography fingerprint of 14 samples of fruit from Libidibia ferrea. (a) Plate before de-rivatization. (b) Plate after derivatization with NEU + PEG reagent; 1–14: Samples; GA: Gallic acid; EA: Ellagic acid
Hence, the HPTLC analysis with semi-automatic applicator was able to separate and identify the compounds of interest. All samples showed positive results for both substances: EA and GA, confirming the relevance of such phenolic compounds for the drug material. Concerning the variability observed among the samples, it was expected and attributed to different conditions of plant development such as geographic origin (collection), climate, and soil conditions.[31,32] Thus, the procedure's ability to detect the differences was achieved and proved be able to support the establishment of standard fingerprint to assure the chemical and biological properties of such raw material and their extractives.
Phenolics content
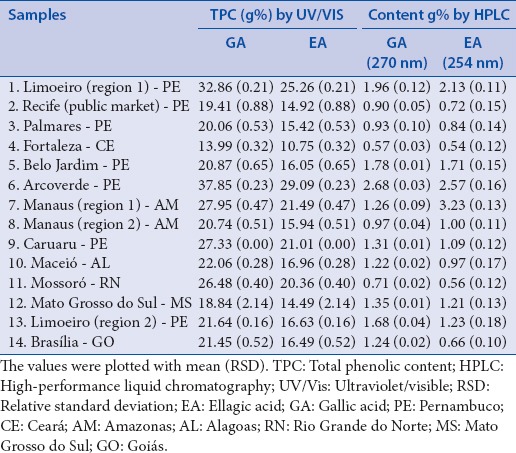
Regarding the relevance of phenolics compound on the biological properties of herbal materials, several studies have been conducted to determine the content of polyphenols either in plant material or crude extracts.[14,21,33,34,35] This class of compounds is present in the fruits of L. ferrea and it is related to several activities of this species.[9,11] The total phenolic content (TPC) of several samples from the fruits of L. ferrea were analyzed by UV/Vis and expressed by EA and GA [Table 1]. Higher values of TPC were observed for samples 1, 6, and 9, ranging from 24.96–37.85 g% to 18.02–27.33 g%, expressed as EA and GA, respectively. The samples 2, 5, 8, 10, 12, 13, and 14 showed intermediary values of TPC (about 20 g% of GA or 15 g% of EA) whereas the sample 4 showed the lower content of TPC (about 14 g% of GA or 11 g% of EA). The results of TPC showed similar behavior observed for the HPTLC analysis, where the intensity of the reveled bands was higher for the samples with higher TPC.
Table 1.
Fourteen samples collected from different regions in Brazil, total phenolic content by ultraviolet/visible and content of tannin by high-performance liquid chromatography
High-performance liquid chromatography analysis
For the optimization of the chromatographic condition, preliminary analyses were carried out to find a good separation of the EA and GA compounds in a short possible total run time. Thus, several mobile phases and gradient elution programs were evaluated. The chromatographic separation was performed with an elution gradient system using water/methanol due to the wide polarity of the compounds. Several mobile phases were evaluated using different concentrations of water/methanol, with a flow rate of 0.8 mL/min and the gradient elution conditions selected using 12.5–25% of methanol, which is the separation of GA. However, in these conditions, EA did not elute, so this compound could only be eluted with a high concentration of methanol (75%).[25]
Both mobile phases were acidified with TFA to adjust the pH and prevent the ionization of the hydroxyl groups, and the separation was much more efficient after acidification. In this study, three different acids were tested: TFA, acetic acid, and phosphoric acid, and TFA at 0.05% proved to be the most effective to obtain relatively better resolution and separation. Hence, in this analysis, the presence of EA and GA standards were detected in large quantities, based on chromatographic profile, both were chosen as a markers for the fruit of L. ferrea [Figure 3].
Figure 3.
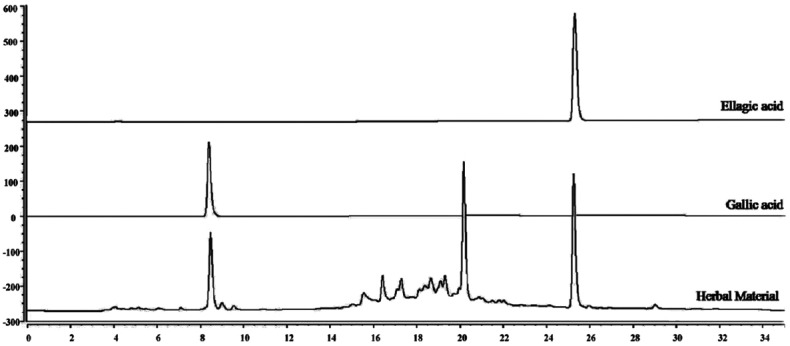
Chromatogram obtained for herbal material and standards (ellagic acid and gallic acid)
Wavelength selection, specificity, and identification of the peaks
The chromatograms were monitored at 254 nm for EA and 270 nm for GA, the maximum absorptions observed for both standards in the UV spectrum. In these conditions, EA and GA were identified as the major compounds in the fruit from L. ferrea. EA and GA were well separated within 30 min and the retention times were 8.5 and 25.0 for GA and EA, respectively.
Calibration curves, limit of detection, and limit of quantification
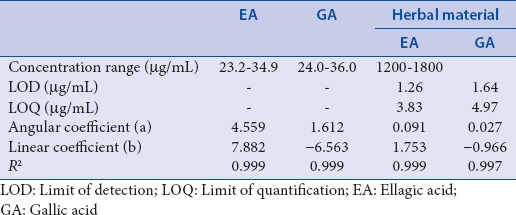
The calibration curves for EA and GA, using five concentration levels, were linear in the range from 23.2 to 34.9 µg/mL and from 24.0 to 36.0 µg/mL, respectively. For the herbal material, the linear range is from 1200 to 1800 µg/mL. The R2 values were above 0.99 in all cases. Using the analyses of variance, the F-test for lack of fit was carried out for each calibration. As the F-statistics estimated by the ratio (lack of fit mean squares)/(pure error mean squares) were smaller than the F-distribution value with 4 and 10 degrees of freedom (α =0.05), there was no evidence of lack of fit.[36] The results, summarized in Table 2, show that the method is sensitive enough to detect and quantify the EA and GA in the fruits of L. ferrea.
Table 2.
Calibration data for the standards ellagic acid, gallic acid, and herbal material from Libidibia ferrea
Repeatability and intermediate precision
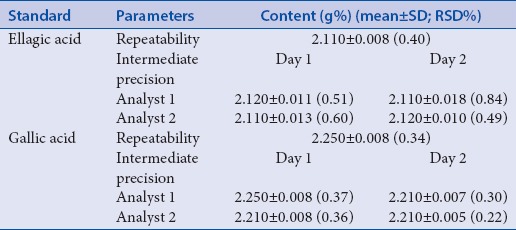
The reproducibility of procedure can be affected by many factors such as glassware, pipettes, and/or analysts.[38] In this context, the amounts of EA and GA were determined using fresh standard solutions and extractive solution on each day. For evaluation of the repeatability of the method, six independent samples (at 100% of the test concentration) were analyzed by HPLC. The content of EA and GA were 2.11 g% and 2.25 g%, with relative standard deviation (RSD) of 0.40% and 0.34%, respectively [Table 3]. The experiments for intermediate precision evaluation were carried out on two different days and the analyses were conducted by two different analysts, thus expressing the inter-laboratory variations. The results for quantification of EA showed RSD values of between 0.50% and 0.63%, and for quantification of GA between 0.27% and 1.05%, which are in accordance with RE 899/2003.[26]
Table 3.
Repeatability and Intermediate precision tests: amounts of EA (g%) and GA (g%) for the herbal material from Libidibia ferrea
Accuracy
In the investigation of accuracy, known amounts of EA and GA, at different concentration levels (80, 100, and 120%), were added to the aqueous extract and the samples were then analyzed using the previously described method. Recoveries between 99.1% and 105.2% (RSD = 4.0%) were obtained for the EA and between 100.6% and 106.5% (RSD = 3.9%) for the GA. The results show that the developed method is satisfactorily accurate. According to the observed recovery rates, the method by LC-reversed phase-DAD applied to the fruit of L. ferrea presents a performance within the limits recommended by the Brazilian guide and related in literature, indicating that the analytical answers are mainly due to the analyte.[26,27]
Robustness
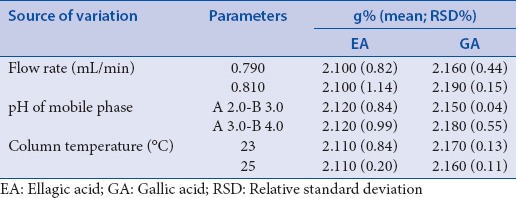
The robustness should be evaluated during the development of the HPLC method by performing small changes in the original method, such as the pH of the mobile phase, flow rate, and column temperature.[37] Based on this, changes have been made in parameters critical to the process. The parameters that have been modified and the results are shown in Table 4. There were no significant differences in the area, retention time, and amounts of EA and GA, with RSD <5%. Thus, the methods for both EA and GA were considered robust under the conditions evaluated.
Table 4.
Robustness test: Amounts of ellagic acid (g%) and gallic acid (g%) for the herbal drug from Libidibia ferrea
After the development and validation of HPLC method, the samples collected from the different regions were also submitted to the HPLC analyses, to verify the viability of methodology and similarities or differences with the authentic sample. The chromatographic profiles (fingerprint) are observed in Figure 4.
Figure 4.
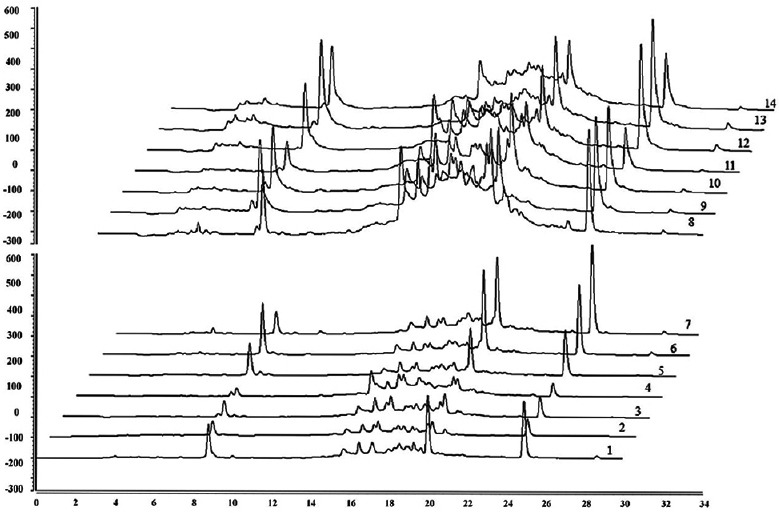
High-performance liquid chromatography fingerprint of 14 samples of fruit from Libidibia ferrea
In general, few markers or pharmacologically active components are used to assess the quality and authenticity of a species that are exhibiting therapeutic potential. However, the quantification of one or some compounds is not representative enough to evaluate of the typical synergic effects and/or the inherent variability of biological matrices such as herbal drugs. In this context, the use of chemical “fingerprints” plays an important role on standardization of herbal drugs and herbal drug derivatives.[38,39,40] The multiple data analysis combine several qualitative and quantitative parameters such as number of peaks, peak areas, and/or relationship between peak performance; which improve the chemical reproducibility of the products ensuring the maintenance of safety and efficacy. Although the TLC/HPTLC provides important and visible information on the analysis of herbal materials, the use of HPLC to creating herbal fingerprints is the most popular one due to its higher precision and resolution. In addition, the LC procedures are accurate for qualitative and quantitative analysis, improving the quality evaluation of herbal drugs by the multi-component quantification.[37,41,42,43]
CONCLUSION
Reproductive phenolic profiles of fruits from L. ferrea by HPTLC and HPLC were reported for the first time. The analytical procedures were also able to detect the variability in the profiles of several samples of the drug material. In addition, the quantitative analysis of phenolic compounds were performed by UV/VIS or HPLC and allowed to quantify the phenolic compounds (total phenol content, GA, and EA). Therefore, the results of this study shows that the qualitative (HPTLC and HPLC) and quantitative (UV/VIS and HPLC) procedures can be used to construct references fingerprints to standardized extractives from the fruits of L. ferrea based on their biological properties.
Financial support and sponsorship
This work was supported by the CNPq (480128/2012-0, 302113/2012-6; 406231/2013-3), FACEPE (IBPG-0423-4.03/11, IBPG-0864-4.04/13; APQ-1296-4.03-12; APQ-0493-4.03/14), and ANVISA/MS (TC03/2010).
Conflicts of interest
There are no conflicts of interest.
ABOUT AUTHOR

Luiz A. L. Soares
Luiz A. L. Soares, PhD, is an associate professor of Department of Pharmaceutical Science at Federal University of Pernambuco. His research focuses in Phytopharmaceutical Technology and Quality Control of Herbal Medicines.
Acknowledgments
The authors thank the CNPq, FACEPE, ANVISA/MS and UFPE for their financial support. The authors are also grateful to Andrew Alastair Cumming for editing this paper.
REFERENCES
- 1.Matos AC, Ataíde GM, Borges EE. Physiological, physical, and morpho-anatomical changes in Libidibia ferrea ((Mart.ex Tul) L Physiological, physical, and morpho-anatomical changes in Libidibia ferrea ((Mart ex Tul) L.P. Queiroz) seeds after overcoming dormancy. J Seed Sci. 2015;37:26–32. [Google Scholar]
- 2.Wyrepkowski CC, Costa DL, Sinhorin AP, Vilegas W, De Grandis RA, Resende FA, et al. Characterization and quantification of the compounds of the ethanolic extract from Caesalpinia ferrea stem bark and evaluation of their mutagenic activity. Molecules. 2014;19:16039–57. doi: 10.3390/molecules191016039. [DOI] [PMC free article] [PubMed] [Google Scholar]
- 3.Carvalho JC, Teixeira JR, Souza PJ, Bastos JK, dos Santos Filho D, Sarti SJ. Preliminary studies of analgesic and anti-inflammatory properties of Caesalpinia ferrea crude extract. J Ethnopharmacol. 1996;53:175–8. doi: 10.1016/0378-8741(96)01441-9. [DOI] [PubMed] [Google Scholar]
- 4.Cavalheiro MG, Farias DF, Fernandes GS, Nunes EP, Cavalcanti FS, Vasconcelos IM, et al. Biological and enzymatic activities of aqueous extract of seeds from Caesalpinia ferrea Mart., Leguminosae. Rev Bras Farmacognosia. 2009;19:586–91. [Google Scholar]
- 5.Sampaio FC, Pereira Mdo S, Dias CS, Costa VC, Conde NC, Buzalaf MA. In vitro antimicrobial activity of Caesalpinia ferrea Martius fruits against oral pathogens. J Ethnopharmacol. 2009;124:289–94. doi: 10.1016/j.jep.2009.04.034. [DOI] [PubMed] [Google Scholar]
- 6.Bacchi EM, Sertié JA, Villa N, Katz H. Antiulcer action and toxicity of Styrax camporum and Caesalpinia ferrea. Planta Med. 1995;61:204–7. doi: 10.1055/s-2006-958056. [DOI] [PubMed] [Google Scholar]
- 7.Nakamura ES, Kurosaki F, Arisawa M, Mukainaka T, Okuda M, Tokuda H, et al. Cancer chemopreventive effects of constituents of Caesalpinia ferrea and related compounds. Cancer Lett. 2002;177:119–24. doi: 10.1016/s0304-3835(01)00708-x. [DOI] [PubMed] [Google Scholar]
- 8.Lopes N, Faccin-Galhardi LC, Espada SF, Pacheco AC, Ricardo NM, Linhares RE, et al. Sulfated polysaccharide of Caesalpinia ferrea inhibits herpes simplex virus and poliovirus. Int J Biol Macromol. 2013;60:93–9. doi: 10.1016/j.ijbiomac.2013.05.015. [DOI] [PubMed] [Google Scholar]
- 9.Pereira Lde P, da Silva RO, Bringel PH, da Silva KE, Assreuy AM, Pereira MG. Polysaccharide fractions of Caesalpinia ferrea pods: Potential anti-inflammatory usage. J Ethnopharmacol. 2012;139:642–8. doi: 10.1016/j.jep.2011.12.012. [DOI] [PubMed] [Google Scholar]
- 10.Ueda H, Tachibana Y, Moriyasu M, Kawanishi K, Alves SM. Aldose reductase inhibitors from the fruits of Caesalpinia ferrea Mart. Phytomedicine. 2001;8:377–81. doi: 10.1078/0944-7113-00043. [DOI] [PubMed] [Google Scholar]
- 11.Dias AM, Rey-Rico A, Oliveira RA, Marceneiro S, Alvarez-Lorenzo C, Concheiro A, et al. Wound dressings loaded with an anti-inflammatory jucá (Libidibia ferrea) extract using supercritical carbon dioxide technology. J Supercrit Fluids. 2013;74:34–45. [Google Scholar]
- 12.Zanin JL, de Carvalho BA, Martineli PS, dos Santos MH, Lago JH, Sartorelli P, et al. The genus Caesalpinia L.(Caesalpiniaceae): Phytochemical and pharmacological characteristics. Molecules. 2012;17:7887–902. doi: 10.3390/molecules17077887. [DOI] [PMC free article] [PubMed] [Google Scholar]
- 13.Vasconcelos CF, Maranhão HM, Batista TM, Carneiro EM, Ferreira F, Costa J, et al. Hypoglycaemic activity and molecular mechanisms of Caesalpinia ferrea Martius bark extract on streptozotocin-induced diabetes in Wistar rats. J Ethnopharmacol. 2011;137:1533–41. doi: 10.1016/j.jep.2011.08.059. [DOI] [PubMed] [Google Scholar]
- 14.de Araújo AA, Soares LA, Assunção Ferreira MR, de Souza Neto MA, da Silva GR, de Araújo RF, Jr, et al. Quantification of polyphenols and evaluation of antimicrobial, analgesic and anti-inflammatory activities of aqueous and acetone-water extracts of Libidibia ferrea, Parapiptadenia rigida and Psidium guajava. J Ethnopharmacol. 2014;156:88–96. doi: 10.1016/j.jep.2014.07.031. [DOI] [PubMed] [Google Scholar]
- 15.Souza CF, Lucyszyn N, Ferraz FA, Sierakowski MR. Caesalpinia ferrea var. ferrea seeds as a new source of partially substituted galactomannan. Carbohydr Polym. 2010;82:641–7. [Google Scholar]
- 16.Gallão MM, Normando LO, Vieira IG, Mendes FN, Ricardo NM, Brito ES. Morphological, chemical and rheological properties of the main seed polysaccharide from Caesalpinia ferrea. Ind Crops Prod. 2013;47:58–62. [Google Scholar]
- 17.Brazilian Pharmacopoeia. 5th ed. Brasí: Anvisa; 2010. [Google Scholar]
- 18.European Pharmacopoeia. Determination of Tannins in Herbal Drugs. 8th ed. Strassbourg: Council of Europe; 2014. [Google Scholar]
- 19.Carvalho MG, Freire FD, Raffin FN, Aragão CF, Moura TF. LC determination of gallic acid in preparations derived from Schinus terebinthifolius Raddi. Chromatogr Suppl. 2009;69:S249–53. [Google Scholar]
- 20.Sharma D, Singla YP. Analysis of gallic acid and 4-hydroxy benzoic acid in Prosopsis cineraria leaf extract using high performance liquid chromatography. J Sci Innov Res. 2013;2:790–4. [Google Scholar]
- 21.Fernandes FH, Batista RS, Medeiros FD, Santos FS, Medeiros AC. Development of a rapid and simple HPLC-UV method for determination of gallic acid in Schinopsis brasiliensis. Rev Bras Farmacognosia. 2015;25:208–11. [Google Scholar]
- 22.Aguilera-Carbo AF, Augur C, Prado-Barragan LA, Aguilar CN, Favela-Torres E. Extraction and analysis of ellagic acid from novel complex sources. Chem Pap. 2008;62:440–4. [Google Scholar]
- 23.Møller C, Hansen SH, Cornett C. Characterization of tannin-containing herbal drugs by HPLC. Phytochem Anal. 2009;20:231–9. doi: 10.1002/pca.1119. [DOI] [PubMed] [Google Scholar]
- 24.Dhooghe L, Meert H, Cimanga RK, Vlietinck AJ, Pieters L, Apers S. The quantification of ellagic acid in the crude extract of Phyllanthus amarus Schum.& Thonn (Euphorbiaceae) Phytochem Anal. 2011;22:361–6. doi: 10.1002/pca.1288. [DOI] [PubMed] [Google Scholar]
- 25.Díez MT, García del Moral P, Resines JA, Arín MJ. Determination of phenolic compounds derived from hydrolysable tannins in biological matrices by RP-HPLC. J Sep Sci. 2008;31:2797–803. doi: 10.1002/jssc.200800143. [DOI] [PubMed] [Google Scholar]
- 26.ICH Validation of Analytical Procedures: Text and Methodology Q2 (R1).International Conference on Harmonisation of Technical Requirements for Registration of Pharmaceuticals for Human Use. Geneva: 2005. [Google Scholar]
- 27.ANVISA. Resolution - RE n. 899: Guide for Validation of Analytical and Bioanalytical Methods. BrasÍlia, Brazil: DOU; 2003. [Last acessed on 2015 Oct 20]. Available from: http://www.anvisa.gov.br/hotsite/genericos/legis/resolucoes/2003/899_03re_e.pdf . [Google Scholar]
- 28.Chinese Pharmacopoeia. English Edition. 9th Edition. China: Chinese Pharmacopoeia Commission; 2010. [Google Scholar]
- 29.Marston A. Thin-layer chromatography with biological detection in phytochemistry. J Chromatogr A. 2011;1218:2676–83. doi: 10.1016/j.chroma.2010.12.068. [DOI] [PubMed] [Google Scholar]
- 30.Spangenberg B, Poole C, Weins C. Quantitative Thin-layer Chromatography: A Practical Survey. Dordrecht: Springer; 2011. [Google Scholar]
- 31.Hosu A, Danciu V, Cimpoiu C. Validated HPTLC fingerprinting and antioxidant activity evaluation of twenty-seven Romanian red wines. J Food Compost Anal. 2015;41:174–80. [Google Scholar]
- 32.Agatonovic-Kustrin S, Hettiarachchi CG, Morton DW, Razic S. Analysis of phenolics in wine by high performance thin-layer chromatography with gradient elution and high resolution plate imaging. J Pharm Biomed Anal. 2015;102:93–9. doi: 10.1016/j.jpba.2014.08.031. [DOI] [PubMed] [Google Scholar]
- 33.Bueno FG, Machareth MA, Panizzon GP, Lopes GC, Mello JC, Leite-Mello EVS, et al. Development of a UV/Vis spectrophotometric method for analysis of total polyphenols from Caesalpinia peltophoroides Benth. Quíica Nova. 2012;35:822–6. [Google Scholar]
- 34.Diciaula MC, Lopes GC, Scarminio IS, De Mello JC. Optimization of solvent mixtures for extraction from bark of Schinus terebinthifolius by a statistical mixture-design technique and development of a UV-Vis spectrophotometric method for analysis of total polyphenols in the extract. Quí Nova. 2014;37:158–63. [Google Scholar]
- 35.Alves IA, Miranda HM, Barbosa AP, Randau KP, Soares LA. Development and validation of analytical methodology by spectrophotometry in the visible for quantification of total tannins in the stem bark of Simarouba amara Aubl. Rev Á vore. 2015;39:37–47. [Google Scholar]
- 36.Pimentel MF, Neto BB. Calibration: A review for analytical chemists. Quim Nova. 1996;19:268–77. [Google Scholar]
- 37.Betz JM, Brown PN, Roman MC. Accuracy, precision, and reliability of chemical measurements in natural products research. Fitoterapia. 2011;82:44–52. doi: 10.1016/j.fitote.2010.09.011. [DOI] [PMC free article] [PubMed] [Google Scholar]
- 38.FDA. Working groups in the Medical Policy, Pharmacology and Toxicology, Complex Drug Substances Coordinating Committees. Guidance for Industry Botanical Drug Products. In: Center for Drug Evaluation and Research (CDER) editor. U.S. Department of Health and Human Services, Food and Drug Administration. Rockville: US Food and Drug Administration (FDA); 2004. [Google Scholar]
- 39.EMA. European Medicines Agency. Guideline on Quality of Herbal Medicinal Products/Traditional Herbal Medicinal Products. 2011. [Last acessed on 2015 Oct 20]. Available from: http://wwwemaeuropaeu/docs/en_GB/document_library/Scientific_guideline/2011/09/WC500113209pdf .
- 40.Giri L, Andola CH, Purohit VK, Rawat MS, Rawal SR, Bahtt ID. Chromatographic and spectral fingerprinting standardization of traditional medicines: An overview as modern tools. Res J Phytochem. 2010;4:234–41. [Google Scholar]
- 41.Liu Y, Sun X, Di D, Quan J, Zhang J, Yang X. A metabolic profiling analysis of symptomatic gout in human serum and urine using high performance liquid chromatography-diode array detector technique. Clin Chim Acta. 2011;412:2132–40. doi: 10.1016/j.cca.2011.07.031. [DOI] [PubMed] [Google Scholar]
- 42.Khoddami A, Wilkes MA, Roberts TH. Techniques for analysis of plant phenolic compounds. Molecules. 2013;18:2328–75. doi: 10.3390/molecules18022328. [DOI] [PMC free article] [PubMed] [Google Scholar]
- 43.Jiang Y, David B, Tu P, Barbin Y. Recent analytical approaches in quality control of traditional Chinese medicines – A review. Anal Chim Acta. 2010;657:9–18. doi: 10.1016/j.aca.2009.10.024. [DOI] [PubMed] [Google Scholar]


