Summary
Educational attainment (EA) is strongly influenced by social and other environmental factors, but genetic factors are also estimated to account for at least 20% of the variation across individuals1. We report the results of a genome-wide association study (GWAS) for EA that extends our earlier discovery sample1,2 of 101,069 individuals to 293,723 individuals, and a replication in an independent sample of 111,349 individuals from the UK Biobank. We now identify 74 genome-wide significant loci associated with number of years of schooling completed. Single-nucleotide polymorphisms (SNPs) associated with educational attainment are disproportionately found in genomic regions regulating gene expression in the fetal brain. Candidate genes are preferentially expressed in neural tissue, especially during the prenatal period, and enriched for biological pathways involved in neural development. Our findings demonstrate that, even for a behavioral phenotype that is mostly environmentally determined, a well-powered GWAS identifies replicable associated genetic variants that suggest biologically relevant pathways. Because EA is measured in large numbers of individuals, it will continue to be useful as a proxy phenotype in efforts to characterize the genetic influences of related phenotypes, including cognition and neuropsychiatric disease.
We study educational attainment (EA), which is measured in all main analyses as the number of years of schooling completed (EduYears, N = 293,723, mean = 14.33, SD = 3.61; Supplementary Information sections 1.1-1.2). All genome-wide association studies (GWAS) were performed at the cohort level in samples restricted to individuals of European descent whose EA was assessed at or above age 30. A uniform set of quality-control (QC) procedures was applied to the cohort-level summary statistics. In our GWAS meta-analysis of ∼9.3M SNPs from the 1000 Genomes Project, we used sample-size weighting and applied a single round of genomic control at the cohort level.
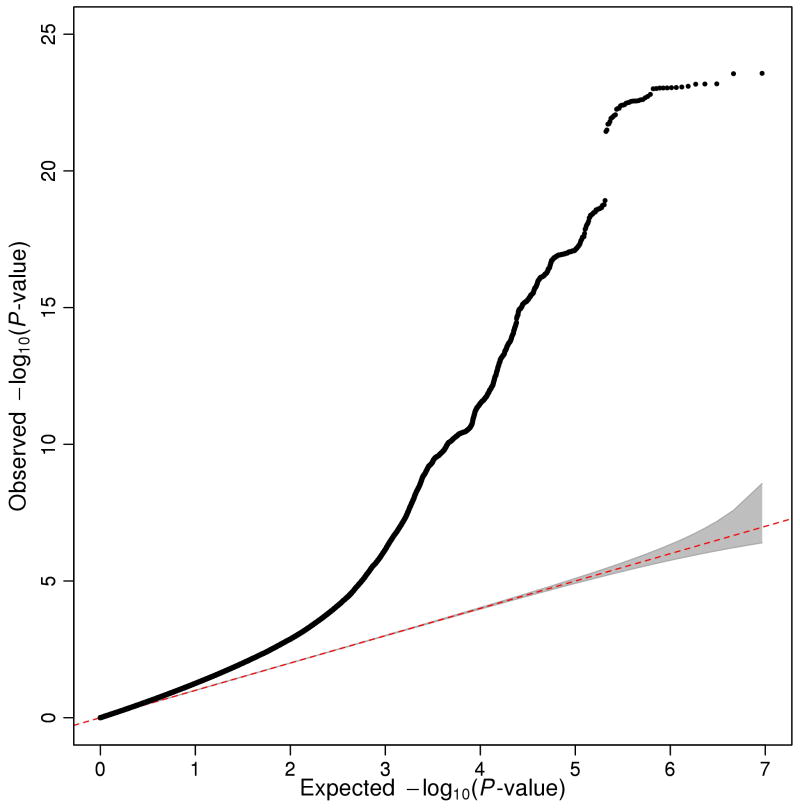
Our meta-analysis identified 74 approximately independent genome-wide significant loci. For each locus, we define the “lead SNP” as the SNP in the genomic region that has the smallest P-value (Supplementary Information section 1.6.1). Fig. 1 shows a Manhattan plot with the lead SNPs highlighted. This includes the three SNPs that reached genome-wide significance in the discovery stage of our previous GWAS meta-analysis of EA1. The quantile-quantile (Q-Q) plot of the meta-analysis (Extended Data Fig. 1) exhibits inflation (λGC = 1.28), as expected under polygenicity3.
Figure 1. Manhattan plot for EduYears associations (N = 293,723).
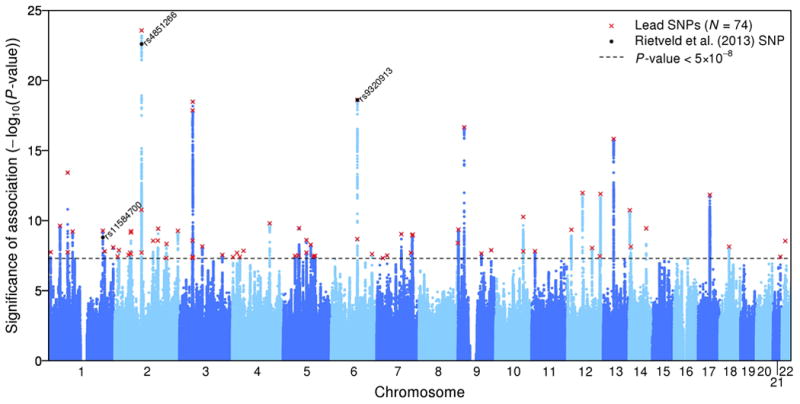
The x-axis is chromosomal position, and the y-axis is the significance on a –log10 scale. The black line shows the genome-wide significance level (5×10⁻⁸). The red x's are the 74 approximately independent genome-wide significant associations (“lead SNPs”). The black dots labeled with rs numbers are the 3 Rietveld et al.1 SNPs.
Extended Data Fig. 2 shows the estimated effect sizes of the lead SNPs. The estimates range from 0.014 to 0.048 standard deviations per allele (2.7 to 9.0 weeks of schooling), with incremental R2 in the range 0.01% to 0.035%.
To quantify the amount of population stratification in the GWAS estimates that remains even after the stringent controls used by the cohorts (Supplementary Information section 1.4), we used LD Score regression4. The regression results indicate that ∼8% of the observed inflation in the mean χ2 is due to bias rather than polygenic signal (Extended Data Fig. 3a), suggesting that stratification effects are small in magnitude. We also found evidence for polygenic association signal in several within-family analyses, although these are not powered for individual SNP association testing (Supplementary Information section 2 and Extended Data Fig. 3b).
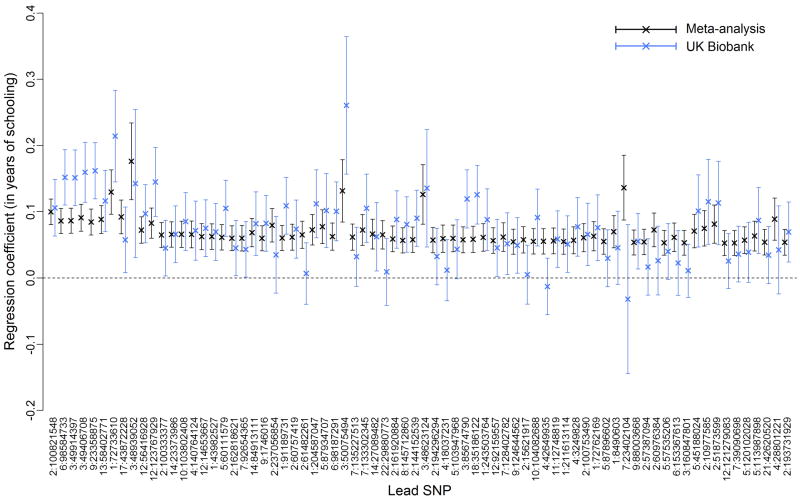
To further test the robustness of our findings, we examined the within-sample and out-of-sample replicability of SNPs reaching genome-wide significance (Supplementary Information sections 1.7-1.8). We found that SNPs identified in the previous EA meta-analysis replicated in the new cohorts included here, and conversely, that SNPs reaching genome-wide significance in the new cohorts replicated in the old cohorts. For the out-of-sample replication analyses of our 74 lead SNPs, we used the interim release of the U.K. Biobank 5 (UKB) (N = 111,349). As shown in Extended Data Fig. 4, 72 out of the 74 lead SNPs have a consistent sign (P = 1.47×10⁻¹⁹), 52 are significant at the 5% level (P = 2.68×10−50), and 7 reach genome-wide significance in the U.K. Biobank dataset (P = 1.41×10−42). For comparison, the corresponding expected numbers, assuming each SNP's true effect size is its estimated effect adjusted for the winner's curse, are 71.4, 40.3, and 0.6. (Supplementary Information section 1.8.2). We also find out-of-sample replicability of our overall GWAS results: the genetic correlation between EduYears in our meta-analysis sample and in the UKB data is 0.95 (s.e. = 0.021; Supplementary Table 1.14).
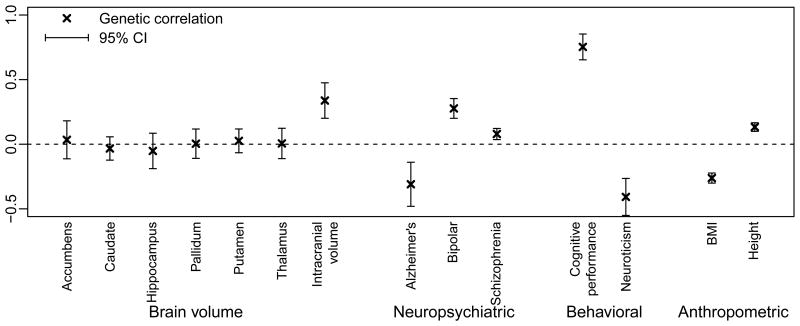
It is known that EA, cognitive performance, and many neuropsychiatric phenotypes are phenotypically correlated, and several studies of twins find that the phenotypic correlations partly reflect genetic overlap6–8 (Supplementary Information section 3.3.4). Here, we investigate genetic correlation using our GWAS results for EduYears and published GWAS results for 14 other phenotypes, using bivariate Linkage-Disequilibrium (LD) Score regression9 (Supplementary Information section 3). First, we estimated genetic correlations with EduYears. As shown in Fig. 2, based on overall summary statistics for associated variants, we find genetic covariance between increased EA and increased cognitive performance (P = 9.9×10-50), increased intracranial volume (P = 1.2×10⁻⁶), increased risk of bipolar disorder (P = 7×10-13), decreased risk of Alzheimer's (P = 4×10⁻⁴), and lower neuroticism (P = 2.8×10⁻⁸). We also found positive, statistically significant, but very small, genetic correlations with height (P = 5.2×10⁻¹⁵) and risk of schizophrenia (P = 3.2×10⁻⁴).
Figure 2. Genetic correlations between EduYears and other traits.
Results from bivariate Linkage-Disequilibrium (LD) Score regressions9: estimates of genetic correlation with brain volume, neuropsychiatric, behavioral, and anthropometric phenotypes using published GWAS summary statistics. The error bars show the 95% confidence intervals.
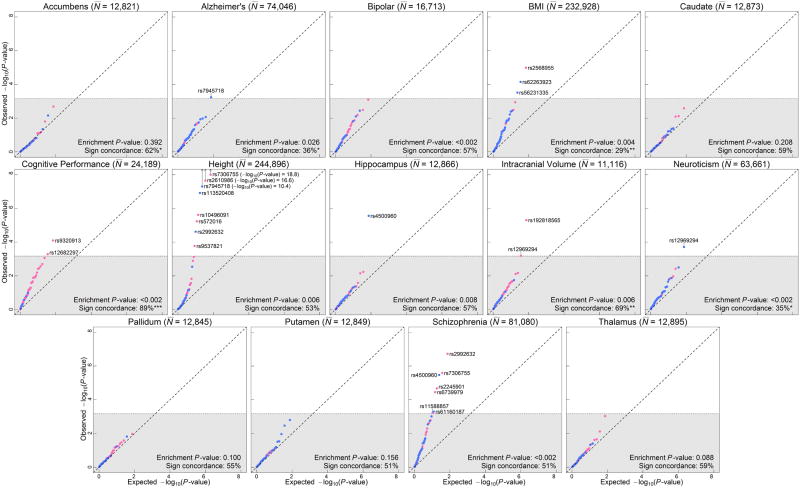
Second, we examined whether our 74 lead SNPs are jointly associated with each phenotype (Extended Data Fig. 5 and Supplementary Information section 3.3.1). We reject the null hypothesis of no enrichment at P < 0.05 for 10 of the 14 phenotypes (all the exceptions are subcortical brain structures).
Third, for each phenotype, we tested (in the published GWAS results) each of our 74 lead SNPs or proxy for association at a significance threshold of 0.05/74. We found a total of 25 SNPs meeting this threshold for any of these phenotypes, but only one reaching genome-wide significance. While these results provide suggestive evidence that some of these SNPs may be associated with other phenotypes, further testing of these associations in independent cohorts is required (Supplementary Tables 3.2-3.4, Extended Data Fig. 6).
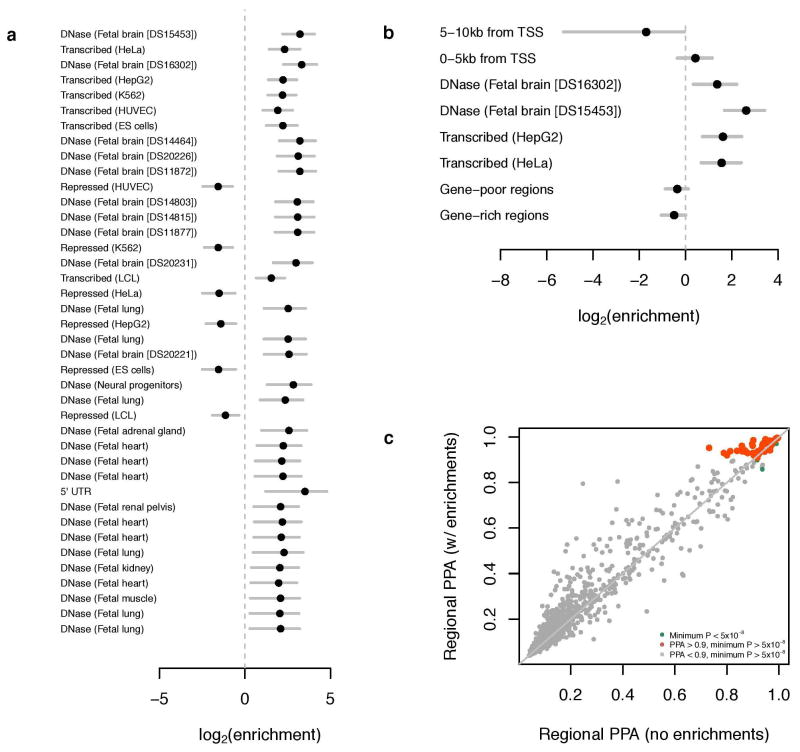
To consider potential biological pathways, we first tested whether SNPs in particular regions of the genome are implicated by our GWAS results. Unlike what has been found for other phenotypes, SNPs in regions that are DNase I hypersensitive in the fetal brain are more likely to be associated with EduYears by a factor of ∼5 (95% confidence interval 2.89–7.07; Extended Data Fig. 7). Moreover, the 15% of SNPs residing in regions associated with histones marked in the central nervous system (CNS) explain 44% of the heritable variation (Extended Data Fig. 8a and Supplementary Table 4.4.2). This enrichment factor of ∼3 for CNS (P = 2.48×10⁻¹⁶) is greater than that of any of the other nine tissue categories in this analysis.
Given that our findings disproportionately implicate SNPs in regions regulating brain-specific gene expression, we examined whether genes located near EduYears-associated SNPs show elevated expression in neural tissue. We tested this hypothesis using data on mRNA transcript levels in the 37 adult tissues assayed by the Genotype-Tissue Expression Project (GTEx)10. Remarkably, the 13 GTEx tissues that are components of the CNS—and only those 13 tissues—show significantly elevated expression levels of genes near EduYears-associated SNPs (FDR < 0.05; Extended Data Fig. 8b and Supplementary Table 4.5.2).
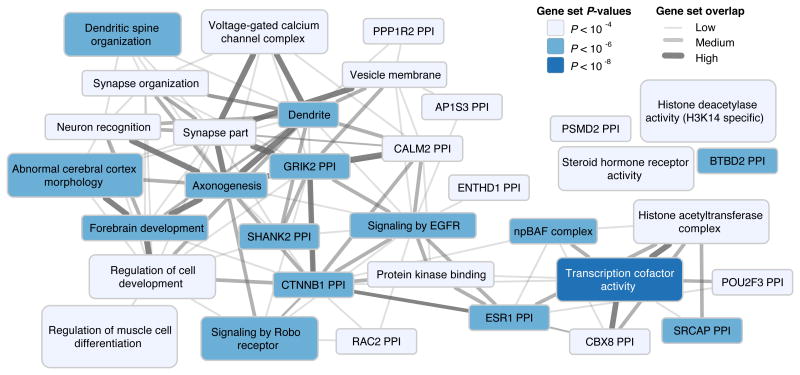
To investigate possible functions of the candidate genes from the GWAS associated loci, we examined the extent of their overlap with groups of genes (“gene sets”) whose products are known or predicted to participate in a common biological process11. We found 283 gene sets significantly enriched by the candidate genes identified in our GWAS (FDR < 0.05; Supplementary Table 4.5.1). To facilitate interpretation, we used a standard procedure11 to group the 283 gene sets into “clusters” defined by degree of gene overlap. The resulting 34 clusters, shown in Fig. 3, paint a coherent picture, with many clusters corresponding to stages of neural development: the proliferation of neural progenitor cells and their specialization (the cluster npBAF complex), the migration of new neurons to the different layers of the cortex (forebrain development, abnormal cerebral cortex morphology), the projection of axons from neurons to their signaling targets (axonogenesis, signaling by Robo receptor), the sprouting of dendrites and their spines (dendrite, dendritic spine organization), and neuronal signaling and synaptic plasticity throughout the lifespan (voltage-gated calcium channel complex, synapse part, synapse organization).
Figure 3. Overview of biological annotation.
34 clusters of significantly enriched gene sets. Each cluster is named after one of its member gene sets. The color represents the P-value of the member set exhibiting the most statistically significant enrichment. Overlap between pairs of clusters is represented by an edge. Edge width represents the Pearson correlation ρ between the two vectors of gene membership scores (ρ < 0.3, no edge; 0.3 ≤ ρ < 0.5, thin edge; 0.5 ≤ ρ < 0.7, intermediate edge; ρ ≥ 0.7, thick edge), where each cluster's vector is the vector for the gene set after which the cluster is named.
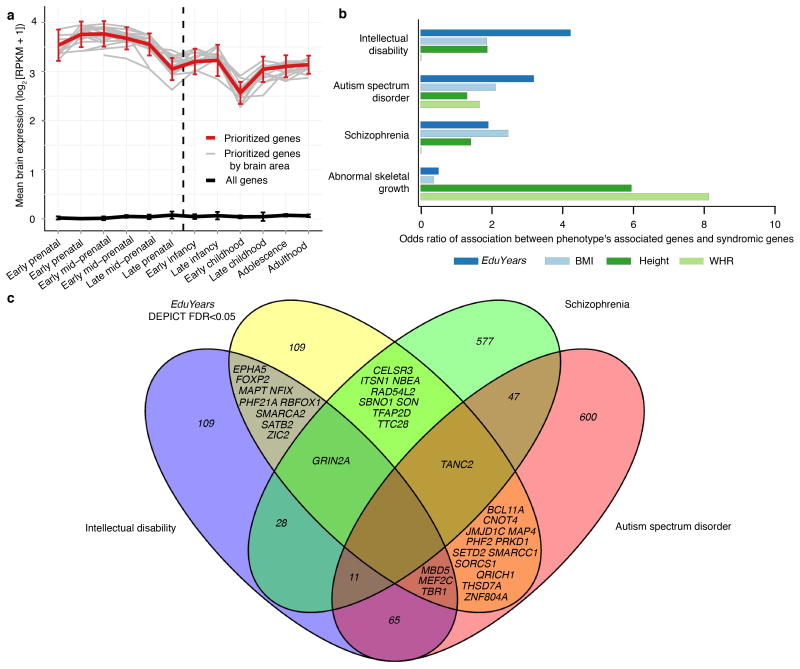
Many of our results implicate candidate genes and biological pathways that are active during distinct stages of prenatal brain development. To directly examine how the expression levels of candidate genes identified in our GWAS vary over the course of development, we used gene expression data from the BrainSpan Developmental Transcriptome12. As shown in Extended Data Fig. 9, these candidate genes exhibit above-baseline expression in the brain throughout life but especially higher expression levels in the brain during prenatal development (1.36 times higher prenatally than postnatally, P = 6.02×10⁻⁸).
A summary overview of some promising candidate genes for follow-up work is provided in Table 1.
Table 1. Selected candidate genes implicated by bioinformatics analyses.
Fifteen candidate genes implicated most consistently across various analyses. To assemble this list, each gene in a DEPICT-defined locus (Supplementary Information section 4.5) was assigned a score equal to the number of criteria it satisfies out of ten (see Supplementary Table 4.1 for details). The DEPICT prioritization P-value was used as the tiebreaker. “SNP”: the SNP in the gene's locus with the lowest P-value in the EduYears meta-analysis. “Syndromic”: which, if any, of three neuropsychiatric disorders have been linked to de novo mutations in the gene (Supplementary Information section 4.6). “Top-ranking gene sets”: DEPICT reconstituted gene sets of which the gene is a top-20 member (Supplementary Table 4.5.1). The three most significant gene sets are shown if more than three are available. ID, intellectual disability; ASD, autism spectrum disorder; SCZ, schizophrenia.
| Gene | SNP | Syndromic | Score | Top-ranking gene sets |
|---|---|---|---|---|
| TBR1 | rs4500960 | ID, ASD | 6 | Developmental biology, decreased brain size, abnormal cerebral cortex morphology |
| MEF2C | rs7277187 | ID, ASD | 5 | ErbB signaling pathway, abnormal sternum ossification, regulation of muscle cell differentiation |
| ZSWIM6 | rs61160187 | – | 5 | Transcription factor binding, negative regulation of signal transduction, PI3K events in ErbB4 signaling |
| BCL11A | rs2457660 | ASD | 5 | Dendritic spine organization, abnormal hippocampal mossy fiber morphology, SWI/SNF-type complex |
| CELSR3 | rs11712056 | SCZ | 5 | Dendrite morphogenesis, dendrite development, abnormal hippocampal mossy fiber morphology |
| MAPT | rs192818565 | ID | 5 | Dendrite morphogenesis, abnormal hippocampal mossy fiber morphology, abnormal axon guidance |
| SBNO1 | rs7306755 | SCZ | 5 | Protein serine/threonine phosphatase complex |
| NBAS | rs12987662 | – | 5 | – |
| NBEA | rs9544418 | SCZ | 4 | Developmental biology, signaling by Robo receptor, dendritic shaft |
| SMARCA2 | rs1871109 | ID | 4 | – |
| MAP4 | rs11712056 | ASD | 4 | Developmental biology, signaling by Robo receptor, SWI-SNF-type complex |
| LINC00461 | rs10061788 | – | 4 | Decreased brain size, abnormal cerebral cortex morphology, abnormal hippocampal mossy fiber morphology |
| POU3F2 | rs9320913 | – | 4 | Dendrite morphogenesis, developmental biology, decreased brain size |
| RAD54L2 | rs11712056 | SCZ | 4 | Decreased brain size, SWI/SNF-type complex, nBAF complex |
| PLK2 | rs2964197 | – | 4 | Negative regulation of signal transduction, PI3K events in ErbB4 signaling |
We constructed polygenic scores13 to assess the joint predictive power afforded by the GWAS results (Supplementary Information section 5.2). Across our two holdout samples, the mean predictive power of a polygenic score constructed from all measured SNPs is 3.2% (P = 1.18×10−39; Supplementary Table 5.2 and Supplementary Information section 5).
Studies of genetic analyses of behavioral phenotypes have been prone to misinterpretation, such as characterizing identified associated variants as “genes for education.” Such characterization is not correct for many reasons: EA is primarily determined by environmental factors, the explanatory power of the individual SNPs is small, the candidate genes may not be causal, and the genetic associations with EA are mediated by multiple intermediate phenotypes14. To illustrate this last point, we studied mediation of the association between the all-SNPs polygenic score and EduYears in two of our cohorts. We found that cognitive performance can statistically account for 23-42% of the association (P < 0.001) and the personality trait “openness to experience” for approximately 7% (P < 0.001; Supplementary Information section 6).
It would also be a mistake to infer from our findings that the genetic effects operate independently of environmental factors. Indeed, a recent meta-analysis of twin studies found that genetic influences on EA are heterogeneous across countries and birth cohorts15. We conducted exploratory analyses in the Swedish Twin Registry to illustrate how environmental factors may amplify or dampen the impact of genetic influences (Supplementary Information section 7). We found that the predictive power of the all-SNPs polygenic score is heterogeneous by birth cohort, with smaller explanatory power in younger cohorts (Extended Data Fig. 10; see also Supplementary Information section 7.4 for discussion of the contrast between these results and findings from a seminal twin study that estimated EA heritability by birth cohort16).
Methods
All methods are described in the Supplementary Information.
Extended Data
Extended Data Figure 1. Quantile-quantile plot of the genome-wide association meta-analysis of 64 EduYears results files.
Observed and expected P-values are on a –log10 scale. The grey region depicts the 95% confidence interval under the null hypothesis of a uniform P-value distribution. The observed λGC is 1.28. (As reported in Supplementary Information section 1.5.4, the unweighted mean λGC is 1.02, the unweighted median is 1.01, and the range across cohorts is 0.95–1.15.)
Extended Data Figure 2. The distribution of effect sizes of the 74 lead SNPs.
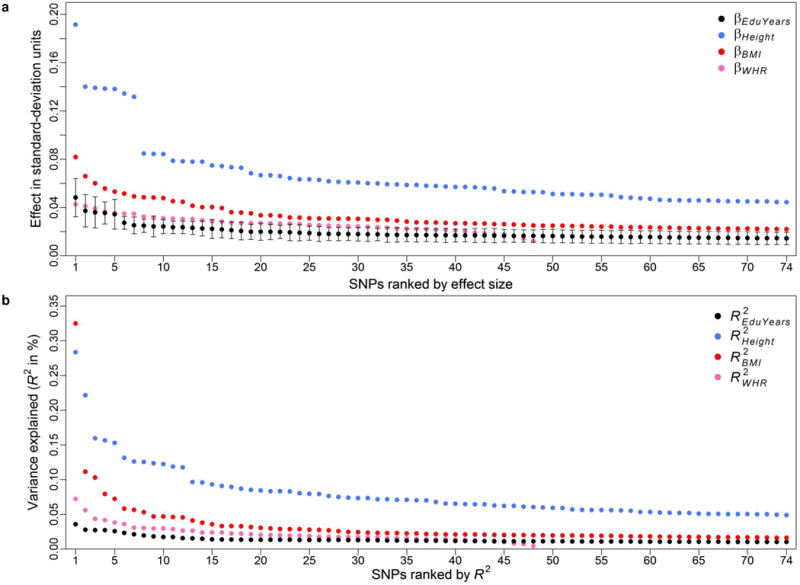
a, SNPs ordered by absolute value of the standardized effect of one more copy of the education-increasing allele, with 95% confidence intervals. b, SNPs ordered by R2. Effects on EduYears are benchmarked against the top 74 genome-wide significant hits identified in the largest GWAS conducted to date of height and body mass index (BMI), and the 48 associations reported for waist-to-hip ratio adjusted for BMI (WHR). These results are based on the GIANT consortium's publicly available results for pooled analyses restricted to European-ancestry individuals: https://www.broadinstitute.org/collaboration/giant/index.php/GIANT_consortium.
Extended Data Figure 3. Assessing the extent to which population stratification affects the estimates from the GWAS.
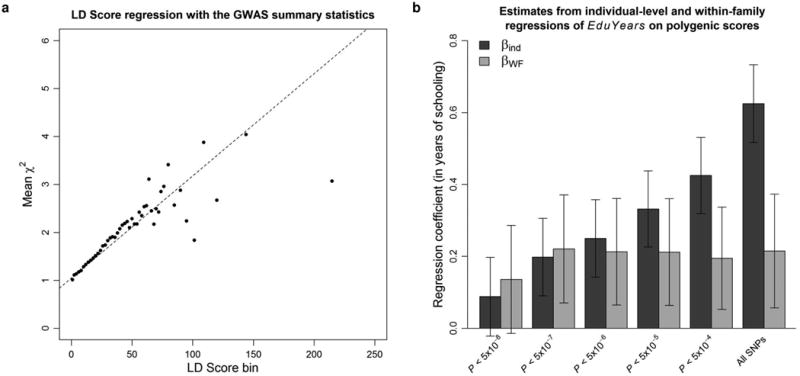
a, LD Score regression plot with the summary statistics from the GWAS. Each point represents an LD Score quantile for a chromosome (the x and y coordinates of the point are the mean LD Score and the mean χ2 statistic of variants in that quantile). The facts that the intercept is close to one and that the χ2 statistics increase linearly with the LD Scores suggest that the bulk of the inflation in the χ2 statistics is due to true polygenic signal and not to population stratification. b, Estimates and 95% confidence intervals from individual-level and WF regressions of EduYears on polygenic scores, for scores constructed with sets of SNPs meeting different P-value thresholds. In addition to the analyses shown here, we conduct a sign concordance test, and we decompose the variance of the polygenic score. Overall, these analyses suggest that population stratification is unlikely to be a major concern for our 74 lead SNPs. See Supplementary Information section 3 for additional details.
Extended Data Figure 4. Replication of 74 lead SNPs in the UK Biobank data.
Estimated effect sizes (in years of schooling) and 95% confidence intervals of the 74 lead SNPs in the meta-analysis sample (N = 293,723) and the UK Biobank replication sample (N = 111,349). The reference allele is the allele associated with higher values of EduYears in the meta-analysis sample. SNPs are in descending order of R2 in the meta-analysis sample. Of the 74 lead SNPs, 72 have the anticipated sign in the replication sample, 52 replicate at the 0.05 significance level, and 7 replicate at the 5×10⁻⁸ significance level.
Extended Data Figure 5. Q-Q plots for the 74 lead EduYears SNPs (or LD proxies) in published GWAS of other phenotypes.
SNPs with concordant effects on both phenotypes are pink, and SNPs with discordant effects are blue. SNPs outside the gray area pass Bonferroni-corrected significance thresholds that correct for the total number of SNPs we tested (P < 0.05/74 = 6.8×10⁻⁴) and are labeled with their rs numbers. Observed and expected P-values are on a –log10 scale. For the sign concordance test: * P < 0.05, ** P < 0.01, and *** P < 0.001.
Extended Data Figure 6. Regional association plots for four of the ten prioritized SNPs for MHBA phenotypes identified using EduYears as a proxy phenotype.
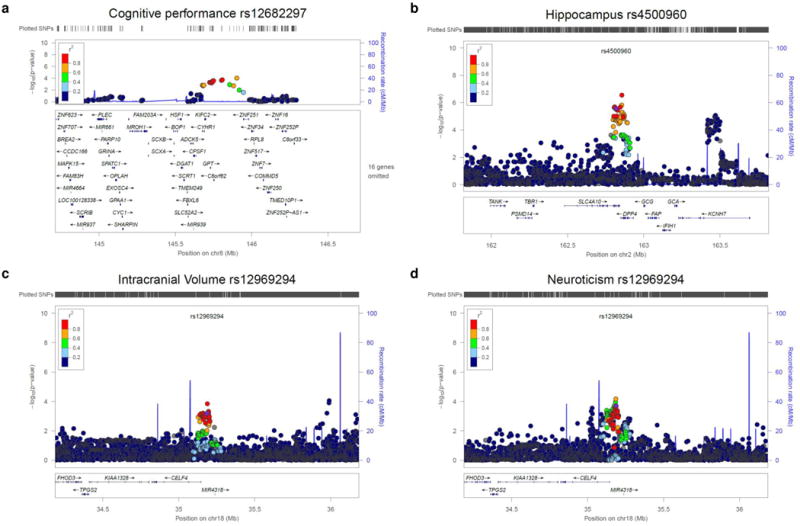
a, cognitive performance; b, hippocampus; c, intracranial volume; d, neuroticism. The four were selected because very few genome-wide significant SNPs have been previously reported for these traits. Data sources and methods are described in Supplementary Information section 3. The R2 values are from the hg19 / 1000 Genomes Nov 2014 EUR references samples. The figures were created with LocusZoom (http://csg.sph.umich.edu/locuszoom/). Mb, megabases.
Extended Data Figure 7. Application of fgwas to EduYears. See Supplementary Information section 4.2 for further details.
a, The results of single-annotation models. “Enrichment” refers to the factor by which the prior odds of association at an LD-defined region must be multiplied if the region bears the given annotation; this factor is estimated using an empirical Bayes method applied to all SNPs in the GWAS meta-analysis regardless of statistical significance. Annotations were derived from ENCODE and a number of other data sources. Plotted are the base-2 logarithms of the enrichments and their 95% confidence intervals. Multiple instances of the same annotation correspond to independent replicates of the same experiment. b, The results of combining multiple annotations and applying model selection and cross-validation. Although the maximum-likelihood estimates are plotted, model selection was performed with penalized likelihood. c, Reweighting of GWAS loci. Each point represents an LD-defined region of the genome, and shown are the regional posterior probabilities of association (PPAs). The x-axis give the PPA calculated from the GWAS summary statistics alone, whereas the y-axis gives the PPA upon reweighting on the basis of the annotations in b. The orange points represent genomic regions where the PPA is equivalent to the standard GWAS significance threshold only upon reweighting.
Extended Data Figure 8. Tissue-level biological annotation.
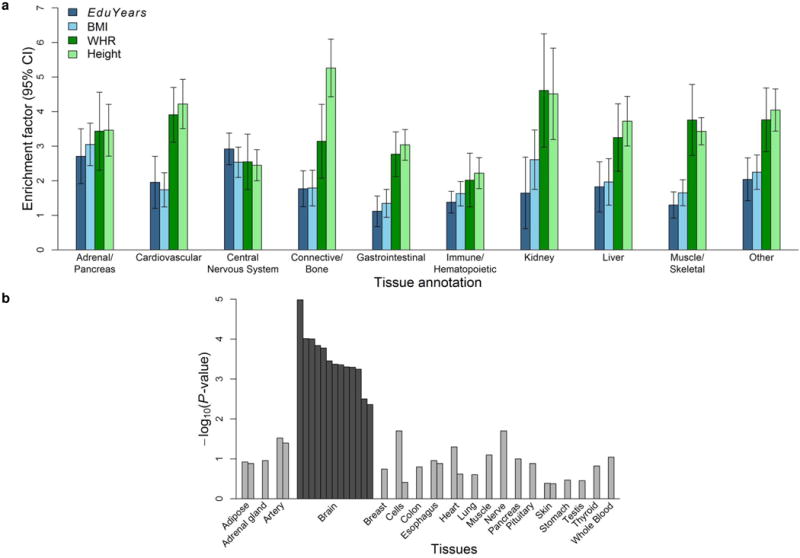
a, The enrichment factor for a given tissue type is the ratio of variance explained by SNPs in that group to the overall fraction of SNPs in that group. To benchmark the estimates for EduYears, we compare the enrichment factors to those obtained when we use the largest GWAS conducted to date on body mass index, height, and waist-to-hip ratio adjusted for BMI. The estimates were produced with the LDSC python software, using the LD Scores and functional annotations introduced in Finucane et al. (2015) and the HapMap3 SNPs with MAF > 0.05. Each of the 10 enrichment calculations for a particular cell type is performed independently, while each controlling for the 52 functional annotation categories in the full baseline model. The error bars show the 95% confidence intervals. b, We took measurements of gene expression by the Genotype-Tissue Expression (GTEx) Consortium and determined whether the genes overlapping EduYears-associated loci are significantly overexpressed (relative to genes in random sets of loci matched by gene density) in each of 37 tissue types. These types are grouped in the panel by organ. The colored bars corresponding to tissues where there is significant overexpression. The y-axis is the significance on a –log10 scale.
Extended Data Figure 9. Gene-level biological annotation.
a, The DEPICT-prioritized genes for EduYears measured in the BrainSpan Developmental Transcriptome data (red curve) are more strongly expressed in the brain prenatally rather than postnatally. The DEPICT-prioritized genes exhibit similar gene-expression levels across different brain regions (gray lines). Analyses were based on log2-transformed RNA-Seq data. Error bars represent 95% confidence intervals. b, For each phenotype and disorder, we calculated the overlap between the phenotype's DEPICT-prioritized genes and genes believed to harbor de novo mutations causing the disorder. The bars correspond to odds ratios. EduYears, years of education; BMI, body mass index; WHR, waist-to-hip ratio adjusted for BMI. c, DEPICT-prioritized genes in EduYears-associated loci exhibit substantial overlap with genes previously reported to harbor sites where mutations increase risk of intellectual disability and autism spectrum disorder (Supplementary Table 4.6.1).
Extended Figure 10. The predictive power of a polygenic score (PGS) varies in Sweden by birth cohort.
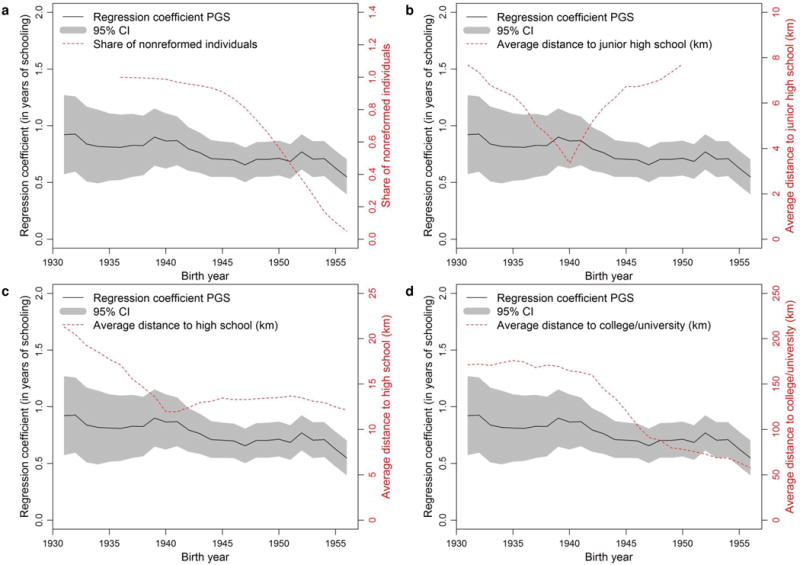
Five-year rolling regressions of years of education on the PGS (left axis in all four panels), share of individuals not affected by the comprehensive school reform (a, right axis), and average distance to nearest junior high school (b, right axis), nearest high school (c, right axis) and nearest college/university (d, right axis). The shaded area displays the 95% confidence intervals for the PGS effect.
Supplementary Material
Acknowledgments
This research was carried out under the auspices of the Social Science Genetic Association Consortium (SSGAC). The SSGAC seeks to facilitate studies that investigate the influence of genes on human behavior, well-being, and social-scientific outcomes using large genome-wide association study meta-analyses. The SSGAC also provides opportunities for replication and promotes the collection of accurately measured, harmonized phenotypes across cohorts. The SSGAC operates as a working group within the CHARGE consortium. This research has also been conducted using the UK Biobank Resource. This study was supported by funding from the Ragnar Söderberg Foundation (E9/11), the Swedish Research Council (421-2013-1061), The Jan Wallander and Tom Hedelius Foundation, an ERC Consolidator Grant (647648 EdGe), the Pershing Square Fund of the Foundations of Human Behavior, and the NIA/NIH through grants P01-AG005842, P01-AG005842-20S2, P30-AG012810, and T32-AG000186-23 to NBER, and R01-AG042568 to USC. We thank Samantha Cunningham, Nishanth Galla and Justin Rashtian for research assistance. A full list of acknowledgments is provided in the supplementary materials.
Footnotes
Supplementary Information is linked to the online version of the paper at www.nature.com/nature.
Author contributions Study Design and Management: D.J.B., D.C., T.E., M.J., P.D.K. and P.M.V. Quality Control and Meta Analysis: A.O., G.B.C., T.E, M.A.F., C.A.R. and T.H.P. Stratification: P.T., J.P.B., C.A.R. and J.Y. Genetic Overlap: J.P.B, M.A.F., P.T. Biological Annotation: J.J.L, T.E., J.H.B., J.K.B., J.P.B., L.F., V.E., L.F., G.A.M, M.A.F., S.F.W.M., G.A.M., T.H.P., J.K.P., P.Timshel, R.A.P., R.d.V. and H.J.W. Prediction and Mediation: J.P.B., M.A.F. and J.Y. G×E: D.Conley, S.F.L., K.O.L., S.O. and K.T. Replication in UKB: M.A.F. and C.A.R. SSGAC Advisory Board: D.Conley, T.E., A.H., R.F.K., D.I.L., S.E.M., M.N.M., G.D.S. and P.M.V. All authors contributed to and critically reviewed the manuscript. Authors not listed above contributed to the recruitment, genotyping, or data processing for the contributing components of the meta-analysis. For a full list of author contributions, see Supplementary Information section 8.
Author Information Results can be downloaded from the SSGAC website (http://ssgac.org/Data.php). Data for our analyses come from many studies and organizations, some of which are subject to a MTA, and are listed in the Supplementary Information. Reprints and permissions information is available at www.nature.com/reprints. The authors declare no competing financial interests. Correspondence and requests for materials should be addressed to D.J.B. (daniel.benjamin@gmail.com), D.C. (dac12@nyu.edu), P.D.K. (p.d.koellinger@vu.nl), or P.M.V. (peter.visscher@uq.edu.au).
References
- 1.Rietveld CA, et al. GWAS of 126,559 individuals identifies genetic variants associated with educational attainment. Science. 2013;340:1467–1471. doi: 10.1126/science.1235488. [DOI] [PMC free article] [PubMed] [Google Scholar]
- 2.Rietveld CA, et al. Replicability and robustness of GWAS for behavioral traits. Psychol Sci. 2014;25:1975–1986. doi: 10.1177/0956797614545132. [DOI] [PMC free article] [PubMed] [Google Scholar]
- 3.Yang J, et al. Genomic inflation factors under polygenic inheritance. Eur J Hum Genet. 2011;19:807–812. doi: 10.1038/ejhg.2011.39. [DOI] [PMC free article] [PubMed] [Google Scholar]
- 4.Bulik-Sullivan BK, et al. LD Score regression distinguishes confounding from polygenicity in genome-wide association studies. Nat Genet. 2015;47:291–295. doi: 10.1038/ng.3211. [DOI] [PMC free article] [PubMed] [Google Scholar]
- 5.Sudlow C, et al. UK Biobank: An open access resource for identifying the causes of a wide range of complex diseases of middle and old age. PLoS Med. 2015;12:e1001779. doi: 10.1371/journal.pmed.1001779. [DOI] [PMC free article] [PubMed] [Google Scholar]
- 6.Fowler T, Zammit S, Owen MJ, Rasmussen F. A population-based study of shared genetic variation between premorbid IQ and psychosis among male twin pairs and sibling pairs from Sweden. Arch Gen Psychiatry. 2012;69:460–466. doi: 10.1001/archgenpsychiatry.2011.1370. [DOI] [PubMed] [Google Scholar]
- 7.Tambs K, Sundet JM, Magnus P, Berg K. Genetic and environmental contributions to the covariance between occupational status, educational attainment, and IQ: a study of twins. Behav Genet. 1989;19:209–222. doi: 10.1007/BF01065905. [DOI] [PubMed] [Google Scholar]
- 8.Thompson LA, Detterman DK, Plomin R. Associations between cognitive abilities and scholastic achievement: Genetic overlap but environmental differences. Psychol Sci. 1991;2:158–165. [Google Scholar]
- 9.Bulik-Sullivan B, et al. An atlas of genetic correlations across human diseases and traits. Nat Genet. 2015;47:1236–1241. doi: 10.1038/ng.3406. [DOI] [PMC free article] [PubMed] [Google Scholar]
- 10.Ardlie KG, et al. The Genotype-Tissue Expression (GTEx) pilot analysis: Multitissue gene regulation in humans. Science. 2015;348:648–660. doi: 10.1126/science.1262110. [DOI] [PMC free article] [PubMed] [Google Scholar]
- 11.Pers TH, et al. Biological interpretation of genome-wide association studies using predicted gene functions. Nat Commun. 2015;6:5890. doi: 10.1038/ncomms6890. [DOI] [PMC free article] [PubMed] [Google Scholar]
- 12.Allen Institute for Brain Science. BrainSpan atlas of the developing human brain. 2015 < http://www.brainspan.org/>.
- 13.Purcell SM, et al. Common polygenic variation contributes to risk of schizophrenia and bipolar disorder. Nature. 2009;460:748–752. doi: 10.1038/nature08185. [DOI] [PMC free article] [PubMed] [Google Scholar]
- 14.Krapohl E, et al. The high heritability of educational achievement reflects many genetically influenced traits, not just intelligence. Proc Natl Acad Sci USA. 2014;111:15273–15278. doi: 10.1073/pnas.1408777111. [DOI] [PMC free article] [PubMed] [Google Scholar]
- 15.Branigan AR, McCallum KJ, Freese J. Variation in the heritability of educational attainment: An international meta-analysis. Northwest Univ Inst Policy Res Work Pap. 2013;92:109–140. [Google Scholar]
- 16.Heath AC, et al. Education policy and the heritability of educational attainment. Nature. 1985;314:734–736. doi: 10.1038/314734a0. [DOI] [PubMed] [Google Scholar]
Associated Data
This section collects any data citations, data availability statements, or supplementary materials included in this article.


