Abstract
We describe chemical approaches for integrated metabolic and proteomic assays from single cells. Quantitative assays for intracellular metabolites, including glucose uptake and 3 other species, are designed as surface-competitive binding assays with fluorescence readouts. This enables integration into a micro-array format with functional protein immunoassays, all of which are incorporated into the microchambers of a single-cell barcode chip (SCBC). Using the SCBC, we interrogate the response of human-derived glioblastoma cancer cells to EGFR inhibition. We report, for the first time, on both the intercellular metabolic heterogeneity as well as the baseline and drug-induced changes in the metabolite-phosphoprotein correlation network.
Graphical Abstract
The emergence of powerful single-cell genomic, transcriptomic, and proteomic tools over the past decade has yielded exciting approaches towards resolving the heterogeneity of complex biological systems.1–3 To date, most single cell tools have focused on transcriptome or proteome analysis, or on the sequencing of specific sets of genes. Quantitative single cell metabolic assays have proven more challenging, although there mass spectrometric methods are promising.4–6 No reports on the integration of metabolite assays with other classes of biomolecules from the same single cells have emerged. The challenge is that different classes of biomolecules require unique assay formats that are typically not compatible. However, such integration might deliver unique information that is not readily available from traditional assays. For the case of metabolites and functional proteins, such measurements could directly resolve connections between two important classes of oncology biomarkers: the elements of the protein signaling networks that are implicated in tumor maintenance and growth, and the small molecule metabolites that provide energy sources for cell growth, or participate in metabolic signal transduction. We report on chemical methods that permit microchip-based quantitative, multiplex assays of metabolites and proteins from statistical numbers of single cells.
Quantitative measurements (generating copy numbers per cell) of intracellular proteins can be accomplished using calibrated, sandwich-type immunofluorescence assays. Such assays require a surface-bound capture antibody and a fluorophore-labeled detection antibody, and yield an optical readout that correlates with protein copy number. These assays can be miniaturized and multiplexed through spatial addressing using the single cell barcode chip (SCBC) format. Metabolites are small molecules, and so cannot be similarly detected by antibody pairs. We report on three types of spatially-addressable competition assays designed to measure the absolute or relative levels of 4 small molecule metabolites, in a manner that allows those assays to be integrated into SCBC (or other) proteomic assays.
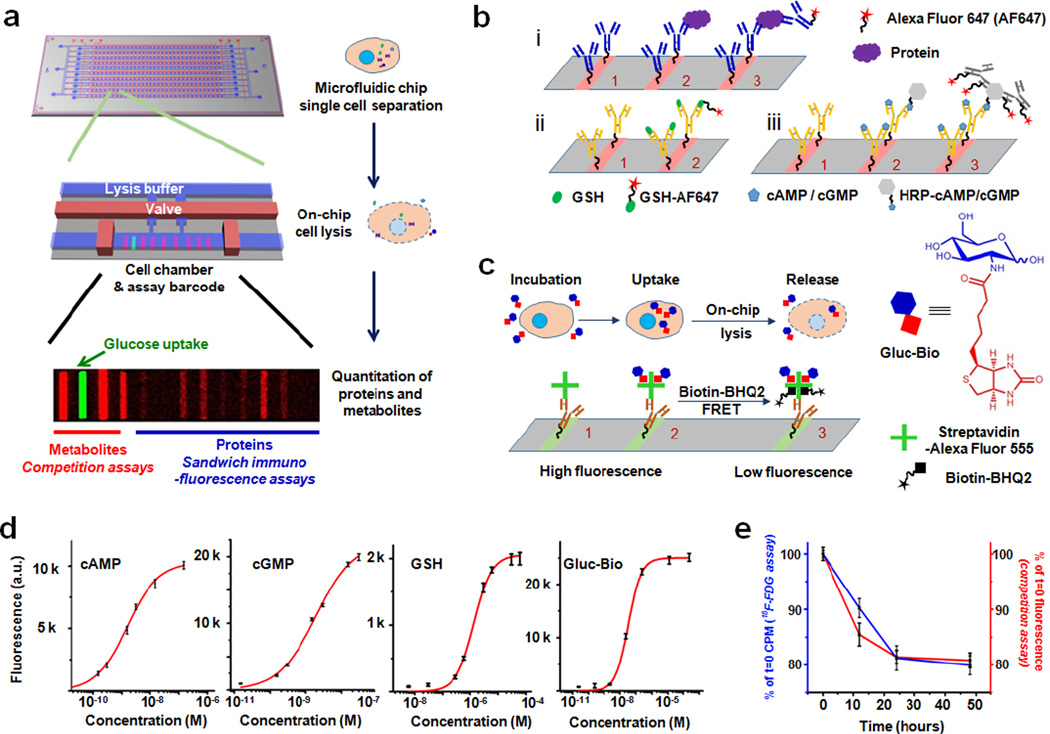
The SCBC platform, the metabolite competition assays, and calibration and validation data are provided in Figure 1. The SCBC (Fig 1a) consists of 310 1.5 nanoliter microchambers into which cells are loaded, and each of which contains a full barcode array. Each microchamber has a companion lysis buffer reservoir separated by a programmable valve (Supporting Figure S1).7,8 For protein assays, specific stripes in the barcode represent a spatial address upon which a sandwich immunofluorescence assay for a specific protein is executed. Each barcode stripe is initially patterned with a unique ssDNA oligomer, and the barcode is converted into an antibody array using the DNA-encoded antibody library (DEAL) approach (Supporting Fig S2).9 Unlike antibody staining assays, such assays can be calibrated in absolute terms, and each individual assay can be analyzed for cross-reactivity against all other assays. The demonstrated measurement error for the protein assays is <10%, as shown in our previous reports.3,8 For the metabolites, the basic challenge is to design assays that are also localized to a particular barcode stripe, yield a fluorescent output, and may be automatically executed using steps that are compatible with the protein assays. The competitive binding assays we implemented (Figure 1b, c) borrow concepts from certain commercial kits used for measuring metabolites from bulk cell culture.
Figure 1.
Principle and validation of the SCBC platform. (a) Illustration of the SCBC layout and the individual miniaturized cell chambers, and a typical fluorescence image of one set of barcode. (b) Scheme of the immunofluorescence assay for i) Proteins, ii) GSH and iii) cAMP or cGMP. For proteins, antibodies were immobilized on the barcode through DEAL method (step 1), then proteins from the cell lysate were captured by the antibody (step 2), Alexa Fluor 647(AF647)-labeled detection antibodies were used to generate fluorescence readout (step 3). Similarly, metabolite-specific antibodies were immobilized (step 1), then labeled metabolites compete with those native ones from the lysed cell for the antibody binding site (step 2). For cAMP and cGMP, AF647-labeled anti-HRP antibodies were used for detection. Because several antibodies can bind to the same HRP molecule and each antibody is equipped with multiple fluorophores, the signal is further amplified (step 3). (c) Scheme of the Gluc-Bio probe detection. AF555-labeled streptavidin was immobilized on the barcode (step 1), then Gluc-Bio molecules from the lysed cell occupy the biotin-binding sites of the streptavidin (step 2). The unoccupied sites were filled by Biotin-BHQ2 molecules (step 3). Because the BHQ2 can quench the fluorescence of the AF555-labeled streptavidin through FRET process, the residual fluorescence positively correspond to the amount of Gluc-Bio molecules from the cell. (d) Calibration curves for various metabolites measured overlaid with Hill function fitting. (e) The results from the parallel measurements of 18F-FDG and Gluc-Bio uptake assay. The similar results from the two assays demonstrate the validity of Gluc-Bio as a glucose uptake probe.
For proof of principle, we chose two second messengers that are closely related to metabolic activities and intracellular signaling: cyclic adenosine monophosphate (c-AMP) and cyclic guanosine monophosphate (c-GMP). We also demonstrate the detection of glutathione (GSH), which is an important molecule for assessing cellular redox stress. For these metabolites, commercial capture antibodies exist, and those can be integrated into specific stripes of the barcode array using DNA-encoded antibody libraries (DEAL). The GSH assay (Fig 1b, ii) was designed around an anticipated intracellular concentration of GSH in the millimolar range (thus not requiring amplification), while assays for the lower-abundance c-GMP and c-AMP (Fig 1b, iii) were designed with signal amplification in mind. We prepared a variant of GSH labeled with a single Alexa Fluor 647 (AF647) dye at a specific site to avoid interference with antibody capture (Supporting Figure S3) Similarly, c-GMP and c-AMP were labeled with horse radish peroxidase at non-competitive sites. A known amount of these three labeled molecules is mixed with the lysis buffer. Upon cell lysis, these reagents compete with the target analytes released from the cell for the antibody binding sites. The fluorescence intensities recorded from the respective barcode addresses for these analytes inversely correlate with the intracellular concentrations of the target analytes. Fig 1d shows the standard calibration curves of the metabolites, in which the coefficient of variation (CV) across the entire detection range is less than 10%. The dynamic ranges of the assays can be tuned by varying the concentrations of the labeled competitors. This offers flexibility for adapting this detection scheme to different biospecimens of interest.
For measuring the level of glucose uptake, we developed a glucose-biotin conjugate (Gluc-Bio) as a glucose analog (Fig 1c, Supporting Fig S4). Similar to the clinically adapted glucose analog 18F-fluorodeoxyglucose (18F-FDG), Gluc-Bio molecules were actively taken up by cells as evidenced by showing that the uptake of Gluc-Bio could be inhibited by increasing the extracellular glucose concentration and also by decreasing the temperature (Supporting Fig S5). We additionally showed, using enzyme kinetics studies, that Gluc-Bio serves as a substrate for hexokinase (HK) (Supporting Fig S6) (similar to glucose and 18F-FDG). This allows the Gluc-Bio molecules to accumulate inside the cell in a similar fashion to 18F-FDG, and ensures the validity of using Gluc-Bio as a probe for glucose influx. To quantify the amount of Gluc-Bio cellular uptake, a Förster resonance energy transfer (FRET)-based competitive binding assay was employed (Fig 1c). Cells are first incubated in the medium containing Gluc-Bio and then washed to remove Gluc-Bio from the supernatant. Following cell lysis, the intracellular Gluc-Bio is released and binds to Alexa Fluor 555-labeled (AF555) streptavidin. Subsequently, the unoccupied binding sites on the streptavidin are filled using a Biotin-BHQ2 conjugate (Supporting Fig S7), which quenches the fluorescence of AF555 through an FRET process. Thus, the fluorescence intensity readout positively correlates to the amount of Gluc-Bio uptaken and released from the cell. Fig 1 d shows the standard curve of the Gluc-Bio (with <10% CV). The dynamic range of this assay can be tuned via varying the streptavidin concentration.
To further verify the validity of this Gluc-Bio assay, we performed side-by-side comparison with the gold standard 18F-FDG radioassay, analyzing bulk numbers of cells from a patient-derived glioblastoma (GBM) neurosphere tumor model (GBM39) for these measurements. GBM39 expresses the epidermal growth factor receptor (EGFR) variant(v)III oncogene, which renders signaling through the EGFR pathway constitutively activated and sensitizes it to EGFR inhibitors, such as erlotinib.10 EGFR inhibition reduces the consumption of glucose in tumor cells. In Fig 1e we plot the kinetic changes of glucose uptake in GBM39 cells in response of erlotinib inhibition, for both the Gluc-Bio competition assay and the 18F-FDG radioassay. The agreement between the assays supports the use of the Gluc-Bio assay for measuring glucose uptake. In related measurements, Gluc-Bio uptake correlated nicely the cellular abundance of the hexokinase 2 (HK2) enzyme, further confirming that Gluc-Bio is a substrate for hexokinases (Supporting Fig S8). Similar validations were performed on the other metabolites against commercial kits (Supporting Fig S9). Note that while the GSH, cAMP, and cGMP assays can yield absolute quantitation (i.e. copy numbers per cell), the Gluc-Bio assay, like 18F-FDG, only yields relative quantitation of glucose influx.
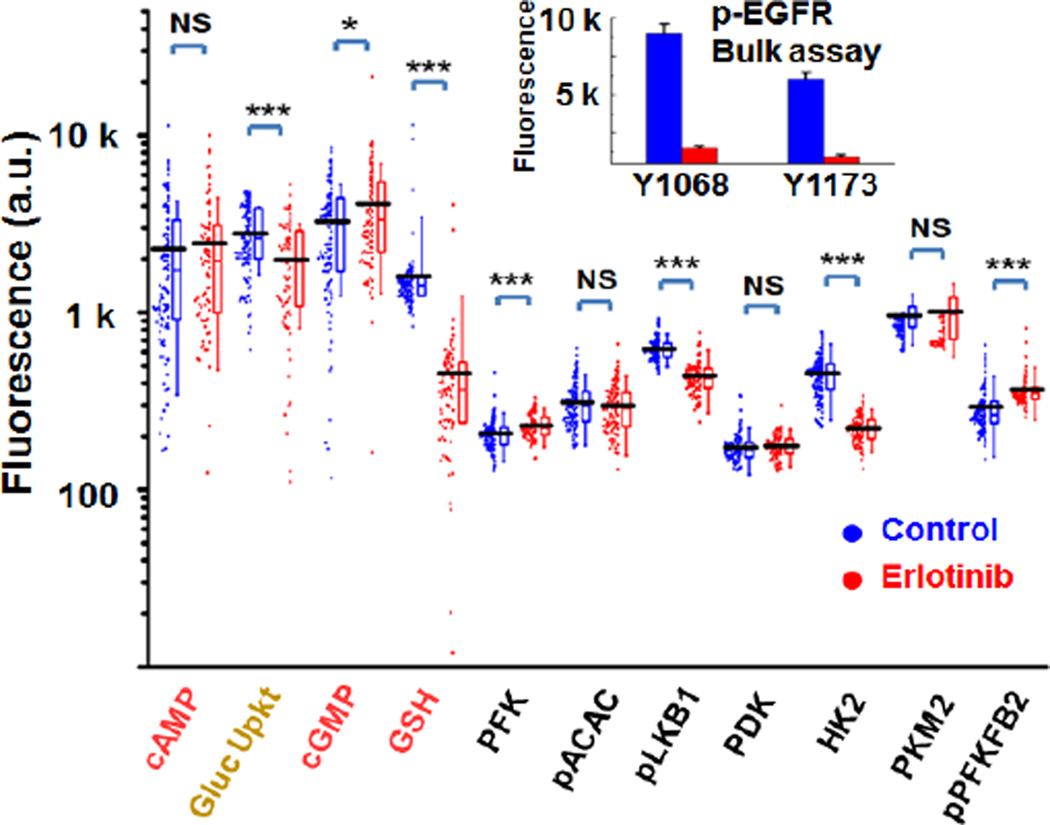
To demonstrate an SCBC that simultaneously quantitates metabolites and functional proteins, we interrogated single cells separated from the GBM39 neurosphere tumor model before and following 24 hours of erlotinib treatment. The assayed panel included the 4 metabolites and 7 metabolism-related proteins and phosphoproteins (Figure 2). A typical SCBC single-chip dataset generates ~100 single cell assays and ~100 0-cell (empty chamber) assays. The 0-cell assays provide an assessment of background signal levels and 2-cell assays provide signal validation (Supporting Fig S10). Two SCBC chips were used for each condition to improve statistics. Fig 2 shows one-dimensional scatter plots of the single cell data for each analyte and each condition investigated. Average values for each plot are indicated by the black horizontal lines. The single cell data are consistent with the immunofluorescence bulk assays on bulk GBM39 neurosphere tumor models, confirming that erlotinib significantly inhibits EGFR phosphorylation (Figure 2 insert), suppresses glucose uptake and hexokinase activities (Supporting Fig S8).
Figure 2.
The SCBC data from control (blue) and erlotinib-treated (red) GBM39 neurospheres. Insert: phospho-EGFR bulk assay shows the drug inhibition on multiple phosphorylation sites.
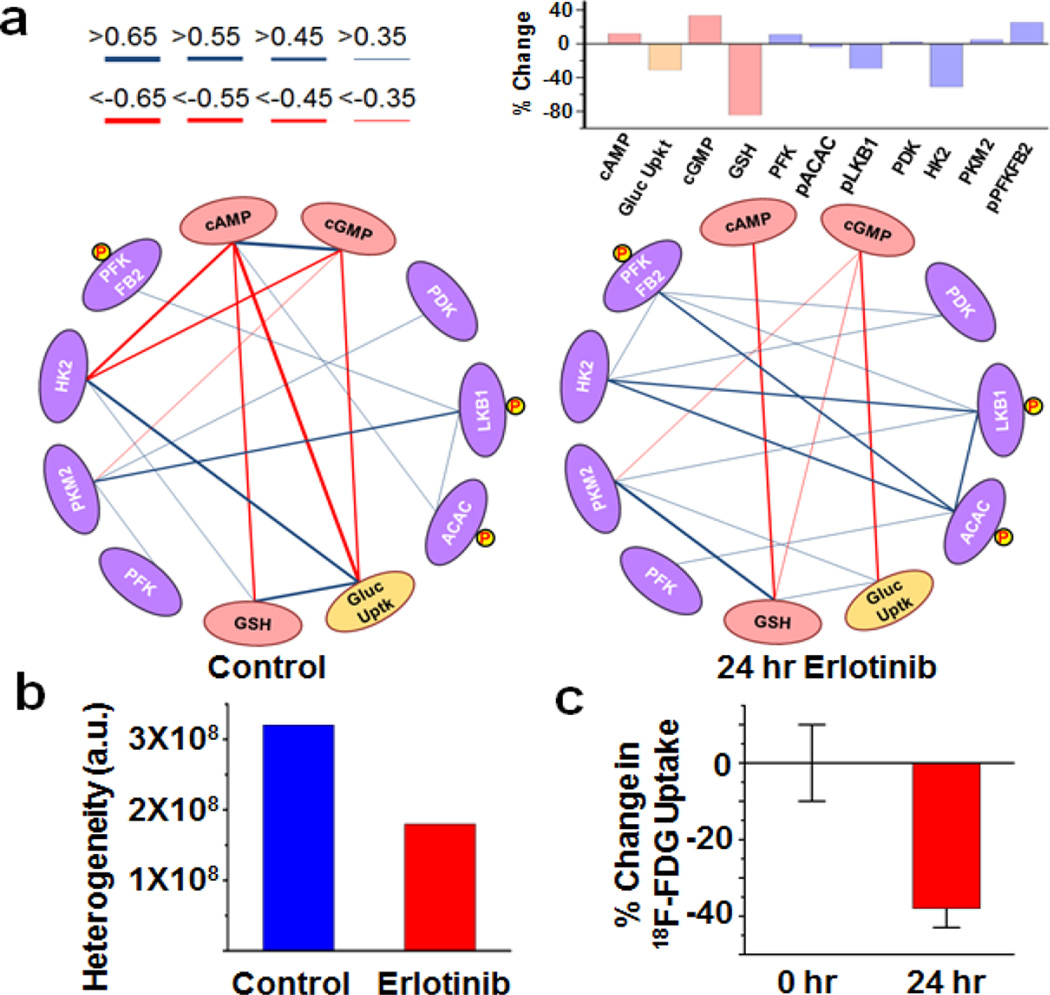
The SCBC datasets provide 3 independent sets of observables: the average analyte levels (Fig 2), the variances in distributions of those levels (Fig 2), and the correlations (or anti-correlations) between any two analytes (Fig 3a). For example, an average analyte level may be comparable before and after the drug perturbation in GBM39, while the statistical distributions could be altered (e.g. PKM2). Similarly, the levels of 2 uncorrelated proteins may be repressed by a drug, but the correlations between those proteins can increase (e.g. p-ACAC and HK2). Collectively, these three observables can be associated with the heterogeneity of cellular responses.11 For example, the identification of metabolic outliers or distinct metabolic phenotypes might provide clues for identifying cell populations with differential responses to drugging.12 In the untreated sample, we identified strong correlations between cAMP and cGMP,13 between glucose uptake and HK2,14 and between glucose uptake and GSH.15 Additionally, the disappearance of positive correlations between PDK and PKM2 in the treated sample implies a reduction of glycolysis, presumably due to the down regulation of p-Akt under erlotinib treatment.18. These observations are consistent with the cited literature, and so provide a validation of the platform.
Figure 3.
(a) Correlation networks generated from the SCBC dataset and the percent abundance changes of each analytes after the 24 hr erlotinib treatment. The cAMP, cGMP and GSH values correspond to the absolute copy number changes based on the calibration curves. The data on the glucose uptake was shown as the changes of Gluc-Bio uptake amounts. The protein data were based on the changes of fluorescence intensity. (b) The heterogeneity indices of the datasets. (c) in vivo 18F-FDG uptake assay from the tumor sites of GBM39-baring mice treated with erlotinib.
Anti-correlations are more difficult to identify using bulk assays, but are clearly resolved between the second messengers cAMP, cGMP and both glucose uptake and HK2. In fact, an unsupervised clustering analysis of the entire SCBC data set for the untreated GBM39 resolves that two metabolic phenotypes dominate the measured cellular heterogeneity (Fig 3b): 80% of the cells exhibit high glucose uptake and low cAMP and cGMP, while 20% of the cells exhibit high cAMP and cGMP, but low glucose uptake (Supporting Fig S11a). Following 24h erlotinib treatment, the levels of glucose uptake and GSH, as well as the activities of HK2 were sharply reduced (Fig 3a).16,17, but the same two metabolic phenotypes, corresponding to the same fractions of the total population, are still resolved (Supporting Fig S11b). This opens up biological questions that will be pursued elsewhere, but also points to the value of such integrated proteomic/metabolite single cell assays for uncovering new biology.
We sought a final verification of the gluc-bio assay by comparing the measured erlotinib-induced changes in glucose uptake that were seen in the in vitro GBM39 neurosphere tumor model with in vivo 18F-FDG PET imaging of a GBM39 flank xenograft mouse model (Fig 3c, Supporting Fig S12). After 24 hrs erlotinib treatment, both assays reflected a reduction in glucose uptake. Thus, while the in vitro gluc-bio assay cannot be directly translated into an in vivo imaging assay, it appears to faithfully reproduce the 18F-FDG PET molecular imaging radioassay for in vivo glucose uptake within a closely related tumor model.
The chemical methods reported here provide an integrated approach towards quantitatively co-analyzing two important classes of biomarkers: proteins (including phosphoproteins), and metabolites from statistical numbers of single cells. The levels of those biomarkers, the metabolic heterogeneity, as well as the correlative interactions between metabolites and signaling proteins can be readily resolved with high accuracy, yielding rich information in cellular metabolic signal regulations and their response to drug perturbations. Although only 4 metabolites and 7 proteins were included in the demonstrations, the numbers of both classes of analytes can be significantly increased through minor variations of the SCBC platform used here.
Supplementary Material
Acknowledgments
This work was supported by the National Cancer Institute grant 5U54 CA151819 (JRH PI), the Ben and Catherine Ivy Foundation, the Jean Perkins Foundation, and the Phelps Family Foundation. We acknowledge Professor Michael Phelps for helpful discussions regarding glucose assays.
Footnotes
ASSOCIATED CONTENT
Supporting Information
Synthetic schemes, experimental details and statistical methods. This material is available free of charge via the Internet at http://pubs.acs.org.
The authors declare no competing financial interests.
REFERENCES
- 1.Shapiro E, Biezuner T, Linnarsson S. Nature Rev. Genet. 2013;14:618–630. doi: 10.1038/nrg3542. [DOI] [PubMed] [Google Scholar]
- 2.Tang F, Lao K, Surani MA. Nature Methods. 2011;8:S6–S11. doi: 10.1038/nmeth.1557. [DOI] [PMC free article] [PubMed] [Google Scholar]
- 3.Yu J, Zhou J, Sutherland A, Wei W, Shin YS, Xue M, Heath JR. Annu. Rev. Anal. Chem. 2014:275–295. doi: 10.1146/annurev-anchem-071213-020323. [DOI] [PubMed] [Google Scholar]
- 4.Zenobi R. Science. 2013;342:1243259. doi: 10.1126/science.1243259. [DOI] [PubMed] [Google Scholar]
- 5.Ibáñez AJ, Fagerer SR, Schmidt AM, Urban PL, Jefimovs K, Geiger P, Dechant R, Heinemann M, Zenobi R. Proc. Natl. Acad. Sci. U.S.A. 2013;110:8790–8794. doi: 10.1073/pnas.1209302110. [DOI] [PMC free article] [PubMed] [Google Scholar]
- 6.Rubakhin SS, Romanova EV, Nemes P, Sweedler JV. Nature Methods. 2011;8:S20–S29. doi: 10.1038/nmeth.1549. [DOI] [PMC free article] [PubMed] [Google Scholar]
- 7.Quake SR, Scherer A. Science. 2000;290:1536–1540. doi: 10.1126/science.290.5496.1536. [DOI] [PubMed] [Google Scholar]
- 8.Shi Q, Qin L, Wei W, Geng F, Fan R, Shin YS, Guo D, Hood L, Mischel PS, Heath JR. Proc. Natl. Acad. Sci. U.S.A. 2012;109:419–424. doi: 10.1073/pnas.1110865109. [DOI] [PMC free article] [PubMed] [Google Scholar]
- 9.Bailey RC, Kwong GA, Radu CG, Witte ON, Heath JR. J. Am. Chem. Soc. 2007;129:1959–1967. doi: 10.1021/ja065930i. [DOI] [PMC free article] [PubMed] [Google Scholar]
- 10.Nathanson DA, Gini B, Mottahedeh J, Visnyei K, Koga T, Gomez G, Eskin A, Hwang K, Wang J, Masui K, Paucar A, Yang H, Ohashi M, Zhu S, Wykosky J, Reed R, Nelson SF, Cloughesy TF, James CD, Rao PN, Kornblum HI, Heath JR, Cavenee WK, Furnari FB, Mischel PS. Science. 2014;343:72–76. doi: 10.1126/science.1241328. [DOI] [PMC free article] [PubMed] [Google Scholar]
- 11.Wei W, Shi Q, Remacle F, Qin L, Shackelford DB, Shin YS, Mischel PS, Levine RD, Heath JR. Proc. Natl. Acad. Sci. U.S.A. 2013;110:1352–1360. doi: 10.1073/pnas.1303060110. [DOI] [PMC free article] [PubMed] [Google Scholar]
- 12.DeBerardinis RJ, Thompson CB. Cell. 2012;148:1132–1144. doi: 10.1016/j.cell.2012.02.032. [DOI] [PMC free article] [PubMed] [Google Scholar]
- 13.Matsuzawa H, Nirenberg M. Proc. Natl. Acad. Sci. U.S.A. 1975;72:3472–3476. doi: 10.1073/pnas.72.9.3472. [DOI] [PMC free article] [PubMed] [Google Scholar]
- 14.Wolf A, Agnihotri S, Micallef J, Mukherjee J, Sabha N, Cairns R, Hawkins C, Cuha A. J. Exp. Med. 2011;208:313–326. doi: 10.1084/jem.20101470. [DOI] [PMC free article] [PubMed] [Google Scholar]
- 15.Tanaka Y, Tran POT, Harmon J, Robertson RP. Proc. Natl. Acad. Sci. U.S.A. 2002;99:12363–12368. doi: 10.1073/pnas.192445199. [DOI] [PMC free article] [PubMed] [Google Scholar]
- 16.Orcutt KP, Parsons AD, Sibenaller ZA, Scarbrough PM, Zhu Y, Sobhakumari A, Wilke WW, Kalen AL, Goswami P, Miller FJ, Jr, Spitz DR, Simons AL. Cancer Res. 2011;71:3932–3940. doi: 10.1158/0008-5472.CAN-10-3425. [DOI] [PMC free article] [PubMed] [Google Scholar]
- 17.Riley JK, Carayannopoulos MO, Wyman AH, Chi M, Moley KH. J. Bio. Chem. 2006;281:6010–6019. doi: 10.1074/jbc.M506982200. [DOI] [PubMed] [Google Scholar]
- 18.Miyamoto S, Murphy AN, Brown JH. Cell Death Differ. 2008;15:521–529. doi: 10.1038/sj.cdd.4402285. [DOI] [PubMed] [Google Scholar]
Associated Data
This section collects any data citations, data availability statements, or supplementary materials included in this article.


