Abstract
Purpose
To introduce a method of designing two-dimensional frequency-modulated pulses that produce phase coherence in a spatiotemporal manner. Uniquely, this class of pulses provides the ability to compensate for field inhomogeneity using a spatiotemporally-dependent trajectory of maximum coherence in a single-shot.
Theory and Methods
A pulse design method based on a k-space description is developed. Bloch simulations and phantom experiments are used to demonstrate sequential spatiotemporal phase coherence and compensation for B1+ and B0 inhomogeneity.
Results
In the presence of modulated gradients, the two-dimensional frequency-modulated pulses were shown to excite a cylinder in a selective manner. With a surface coil transmitter, compensation of the effect of B1+ inhomogeneity was experimentally verified, in agreement with simulation results. In addition, simulations were used to demonstrate partial compensation for B0 inhomogeneity.
Conclusion
Two-dimensional frequency-modulated pulses are a new class of pulses that generate phase coherence sequentially along a spatial trajectory determined by gradient- and frequency-modulated functions. By exploiting their spatiotemporal nature, two-dimensional frequency-modulated pulses can compensate for spatial variation of the radiofrequency field in a single-shot excitation. Preliminary results shown suggest extensions might also be used to compensate for static field inhomogeneity.
Keywords: MRI methodologies, frequency-modulated pulse, spatiotemporal encoding, inhomogeneity compensation
INTRODUCTION
By evenly distributing radiofrequency (RF) power in time, frequency-modulated (FM) pulses can provide certain advantages in MRI, such as high tolerance to B1 inhomogeneity, sharp slice profiles, and broadband excitation with low peak RF power[1] [2]. When an FM pulse is used to excite (or invert) spins in a slice, the isochromats experience unique excitation (or inversion) times and the phase of the resultant transverse magnetization varies non-linearly in the direction of the gradient. With chirp and hyperbolic secant (HS1) pulses, a spatially-quadratic phase is produced, and inverting the gradient polarity after applying these FM pulses causes the magnetization to rephase at different times[3][4].
In recent years, the ability to sequentially excite the different isochromats with one-dimensional (1D) FM pulses has been exploited to encode spatial information along one or two dimensions of an image. Pipe introduced quadratic encoding, which stems from the sequential chirp excitation previously mentioned, to encode along the slice-selection direction[3]. Shrot et al showed how frequency encoding in conventional two-dimensional (2D) MRI can be replaced with the spatiotemporal encoding provided by a chirp pulse[5]. Chamberlain et al substituted phase encoding with spatiotemporal encoding to create a series of echoes with constant echo time to avoid blurring caused by relaxation[6].
Recently, 2D FM pulses have gained attention due to their ability to temporally encode in two dimensions. Through simulations, Dumez et al demonstrated RF pulses that sequentially “sculpt” along 2D raster and spiral spatial trajectories[7]. Snyder et al introduced the concept of MRI by steering localized resonance through an object using 2D FM pulses to spatiotemporally encode along single-turn spiral trajectories[8]. By using a B1+ profile map and adjusting the pulse pattern in a temporal manner based on the resonance trajectory, the feasibility of B1 inhomogeneity compensation was shown through simulations. MR imaging with tolerance to inhomogeneous fields is a unique attribute of multidimensional FM pulses.
Here we present a new class of 2D FM pulses that produces maximum phase coherence in a spatiotemporal manner along a spiral trajectory in space. By rewinding the gradients after applying the pulse, this phase coherence trajectory can be reversed. In this manner the spatiotemporal dependence for image acquisition is preserved. Furthermore, these 2D FM pulses offer a means to compensate for inhomogeneity within the selectively excited volume. This extends the work of Snyder et al by replacing the need for multiple spiral trajectories to completely cover the object with a single shot. Based on a k-space description we provide the theoretical basis for designing such pulses, and describe how coherence can be steered along a trajectory in a sequential manner. Bloch simulations and experimental images of phantoms and human brain are used for validation.
THEORY
Spatiotemporal Coherence Pulse Design
In the presence of a constant gradient, a 1D FM pulse, such as a chirp and hyperbolic secant (HS1) pulse[9], rotates isochromats having resonant frequencies within the excitation bandwidth onto the transverse plane in a sequential manner. Accordingly, the transverse magnetization Mxy(r⃗) is encoded with a spatially-varying quadratic phase (in addition to a linear phase) in the direction of the gradient, r⃗[3] [4]. From a k-space analysis, while traversing a uniformly sampled k-space in one dimension, the chirp and HS1 pulse distributes a quadratic phase equivalent to the pulse phase, in addition to modulating the k amplitude through the B1, amplitude. Thus, the phase distribution in physical space and k-space are both quadratic. This can be extended to a higher order dimension by exploiting symmetry and carefully allocating phase while sampling k-space in such a way that it replicates the k-space of the 1D FM pulses along the symmetric direction.
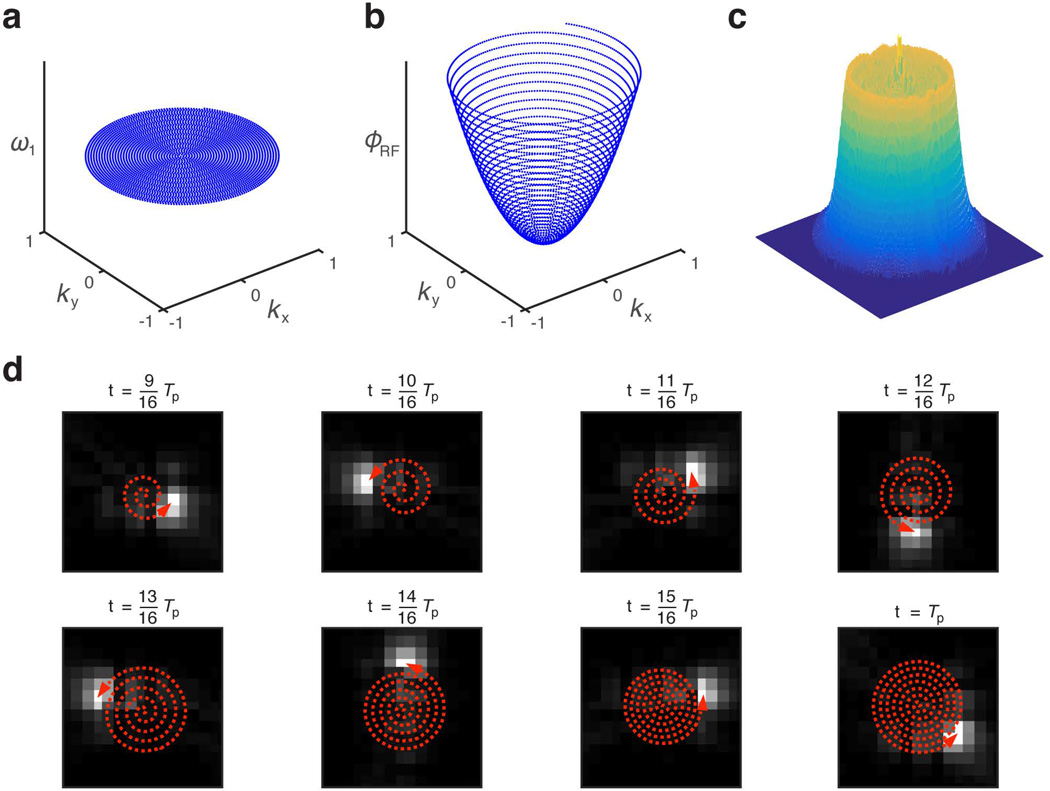
The phase of a chirp pulse is proportional to τ2, where τ(= t/Tp) is normalized time with respect to the pulse length Tp. In the case of a constant gradient of magnitude G applied in concert with the pulse to achieve slice selection, the RF phase ends up being proportional to k2(τ) since the 1D k-space of the pulse is directly proportional to k(τ) = γGTpτ. This can be expanded to two dimensions by sampling a spiral k-trajectory of constant gradient magnitude in two dimensions. By taking advantage of the trajectory’s radial symmetry, one can allocate phase that is proportional to the square of the radial magnitude of k, thereby making it equivalent to the 1D chirp when projecting along the radial direction. Figure 1 depicts the radially sampled k-space amplitude and phase of a 2D chirp pulse that selectively excites a cylindrical volume. With a constant RF amplitude with respect to time, the resulting FM function of a parabolic phase profile in 2D k-space and the gradient function G⃗s(t) in polar coordinates are
| [1] |
| [2] |
| [3] |
| [4] |
where ωc is the carrier frequency, A is the maximum amplitude of the time-dependent offset frequency, k⃗s(t) and θ(t) are the radial and angular functions respectively for sampling spiral k-space radially outwards, γ is the gyromagnetic ratio, G is gradient amplitude, and N is number of cycles traversed along the spiral. Because the allocated phase is radially symmetric in k-space, the 2D chirp pulse produces local phase coherence along an outward spiraling trajectory in a manner that is analogous to the 1D chirp pulse in which excitation sequentially occurs along the quadratic phase. Alternatively, by replacing τ with 1 − τ, spiral k-space is sampled in a radially inward order and inward spiraling of local phase coherence is produced by the pulse. The reason why local phase coherence (as opposed to localized excitation) happens in a spatiotemporal manner is explained further below. However, an intuitive understanding into why the sequential excitation model does not apply can be obtained by considering the rotating slice illustration used previously[8]. Specifically, when the slice undergoes multiple 2π rotations on a spiral trajectory, the magnetization at a given location experiences the on- or near-resonance condition multiple times during the pulse. Hence, instead of tipping magnetization in a sequential manner along the trajectory, the magnetization is affected by the pulse multiple times, and the number of times is dictated by the number of turns on the spiral.
Figure 1.
A k-space representation of the two-dimensional chirp pulse is shown in terms of its (a) RF amplitude (ω1) and (b) phase (ϕRF) functions. (c) This mesh plot of the resulting excitation profile produced by the 2D chirp pulse shows selective disc excitation in 2D space (equivalent to cylindrical excitation in 3D space). (d) Snapshots in time during the second half of 2D chirp pulse allow visualization of the spatiotemporal phase coherence as it moves along the outward spiraling trajectory.
To give better insight as to how phase coherence is steered through physical space, k-space analysis is utilized. By assuming a low tip angle excitation which decouples the transverse magnetization from the longitudinal magnetization[10], Mxy(r⃗) in the rotating frame for a pulse with amplitude-modulated function ω1(t) and FM function ωRF(t) can be written as[11]
| [5] |
| [6] |
where Mo is the initial longitudinal magnetization, , and r̂ = r⃗/|r⃗| is a unit vector. A detailed derivation of the equations above has been provided previously[11].
During the pulse, isochromats are continuously being excited, de-phased, and re-phased due to the gradient and frequency being continuously modulated. Magnetization refocuses at a given location r⃗ when the position-dependent k-space equals 0 (k⃗r(t) = 0), analogous to echoes forming when k = 0 in Fourier imaging. Mathematically, localization of coherence at time 0 ≤ t ≤ Tp occurs at the spatial location where the condition
| [7] |
is satisfied. When this condition is met, the position-dependent k-space given by equation [6] becomes zero, the nullification of the phase term in equation [5] follows, and localized maximum phase coherence occurs at this position. It is important to note that this approach of attaining spatiotemporal coherence is different from previous implementations. Specifically, instead of using equation [7] in real-space to ensure the excitation trajectory covers the whole object of interest, the distribution of phase or frequency modulation in k-space is used to design the pulse. Only after completing this step is the coherence trajectory extracted using equation [7]. For the 2D chirp pulse, this procedure yields an RF pulse consisting of a constant frequency with the actual frequency sweep being achieved through frequency-modulated cosinusoidal gradients. From equations [1], [4], and [7], the maximum coherence trajectory is given by
| [8] |
To shift the selected excitation region by r⃗o, a constant offset is applied to the sampled k-space trajectory. By using the relationship given in equation [7], one can extract the offset needed to produce a shift of r⃗o. For the 2D chirp pulse, the relationship between offset and shift r⃗o is given by
| [9] |
A 2D Hyperbolic Secant Spatiotemporal Pulse
Due to the non-ideal ripple excitation profile produced by the 2D chirp pulse, a 2D version of the original HS1 pulse[9] was also developed for the purpose of achieving a flatter excitation profile. As shown in Figure 2, for the same k-trajectory, the amplitude was modulated proportional to sech(β|κ⃗s(t)|) and the phase was allocated proportional to ln(cosh(β|κ⃗s(t)|)),
| [10] |
| (11) |
where β is the truncation factor, κ⃗s(t) = k⃗s(t)/max(|k⃗s(t)|) is k⃗s normalized to 1, is the maximum RF amplitude, and B is a scaling factor of the time-dependent offset frequency.
Figure 2.
A k-space representation of the two-dimensional hyperbolic secant (HS1) pulse is shown in terms of its (a) RF amplitude (ω1) and (b) phase (ϕRF) functions. (c) This mesh plot of the resulting excitation profile produced by the 2D FM HS1 shows no ripples, unlike those of the 2D chirp pulse.
B1 Compensation
As stated above, one of the most promising aspects of multidimensional FM excitation is the ability to compensate for field inhomogeneity. By distributing phase in 2D k-space, and thus keeping coherence spatially confined, the flip angle variation that normally results from B1, inhomogeneity can be avoided. Specifically, by linking a spatial B1+ map, B1+ (r⃗), with the maximum coherence trajectory, r⃗o(t), one can compensate for B1+ inhomogeneity by modifying the amplitude function of the pulse according to
| (12) |
The reasoning behind this approach assumes that maximum RF energy is deposited along the trajectory of maximum coherence during the pulse. Therefore, if at this location, the B1+ produced by the coil is less/more than expected, one can modify the pulse amplitude function by scaling the RF voltage at that time point based on the measured B1+ map. By another interpretation, the k-space amplitude profile of the 2D FM pulse is deformed by a spatial variation of B1, and a rescaling of the B1 amplitude is thus needed to retrieve the desired flat excitation profile. This assumption has been validated through simulations and experiments.
Imaging Sequences
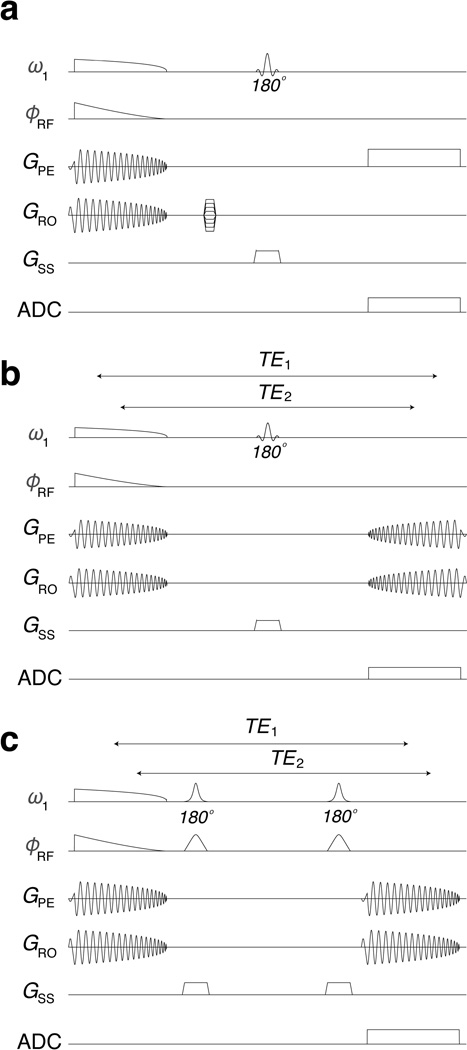
2D FM pulses described herein excite a cylindrical volume because they are sampled on a spiral k-space trajectory. As with 1D FM pulses, the quadratic phase of the excited Mxy does not result in signal loss in conventional Fourier imaging, provided the spatial scale of each pixel is small compared to the spatial scale of the phase variation[4]. Thus, a conventional 2D spin-echo sequence, which included standard frequency- and phase-encoding gradients and slice-selective π-pulse(s) for refocusing, was used to acquire axial images of the cylinder excited by the 2D FM pulses. In addition, an implementation of the spin-echo sequence with spiral readout was used for single-shot imaging. The latter takes advantage of the fact that after spiral-in excitation, whereby k-space is centered, sampling while rewinding the gradients defines a k-space trajectory spiraling outward. At the same time, phase coherence is rewound on the trajectory that is opposite the one traversed during excitation. As in the 1D case, a quadratic phase profile is created along the trajectory of maximum coherence. When an odd number of π-pulse(s) are employed for refocusing, time reversed readout gradients are required and the isochromats experience different echo times (TE); i.e., isochromats excited first refocus last and isochromats excited last refocus first. When using an even number of π-pulses, time reversal of the readout gradient is no longer required and all isochromats experience the same TE, i.e. isochromats excited first refocus first and isochromats excited last refocus last. These sequences are shown in Figure 3.
Figure 3.
Pulse sequences used to evaluate the performance of 2D FM pulses. (a) Conventional single-slice spin-echo sequence with slice selection along the longitudinal axis of the cylindrical volume excited by the 2D pulses. (b) A version of this sequence with spiral readout. Isochromats that experience phase coherence first during excitation will “re-cohere” last during readout. (c) With a double spin-echo version of the sequence, a constant echo time between excitation and readout phase coherences is possible.
METHODS
Simulations
MATLAB (MathWorks, Inc., Natick, Massachusetts, USA) and a Bloch simulator programmed in C language were used to test and validate the spatiotemporal excitation principles introduced above. 2D simulations were carried out to evaluate the resulting pulse excitation profiles assuming a spatially homogenous spin distribution. To demonstrate the occurrence of sequential, localized coherence during excitation, voxel averaging of the individual transverse magnetization components Mx and My were done independently using 10×10 isochromats per voxel. Images were constructed from a 41×41 voxel averaged matrix. Potential relaxation effects were not considered in the simulations.
For B1 compensation, a B1+ field map was generated for a 14.4 cm diameter loop coil using the Biot-Savart equation and imposed on simulations. The pulse amplitude modulation function, B1(t), was rescaled based on the B1+ inhomogeneity along the trajectory of coherence. B1 compensation was demonstrated on a uniform circular phantom.
A preliminary attempt to compensate for spatial B0-variation was also conducted. B0 compensation can be realized by modifying the RF pulse phase. In the case of a spatially varying static field, the carrier frequency in equations [6] and [7] becomes spatially dependent. This consequential position-dependent phase can be compensated through the RF phase if the position dependent static field profile is known. For demonstration, an attempt to compensate a saddle-shaped static field (i.e., B0 proportional to x2-y2) was made by subtracting a phase proportional to from the parent pulse phase, which is proportional to . The resulting excitation profile was then compared with the non-compensated profile.
Experiments
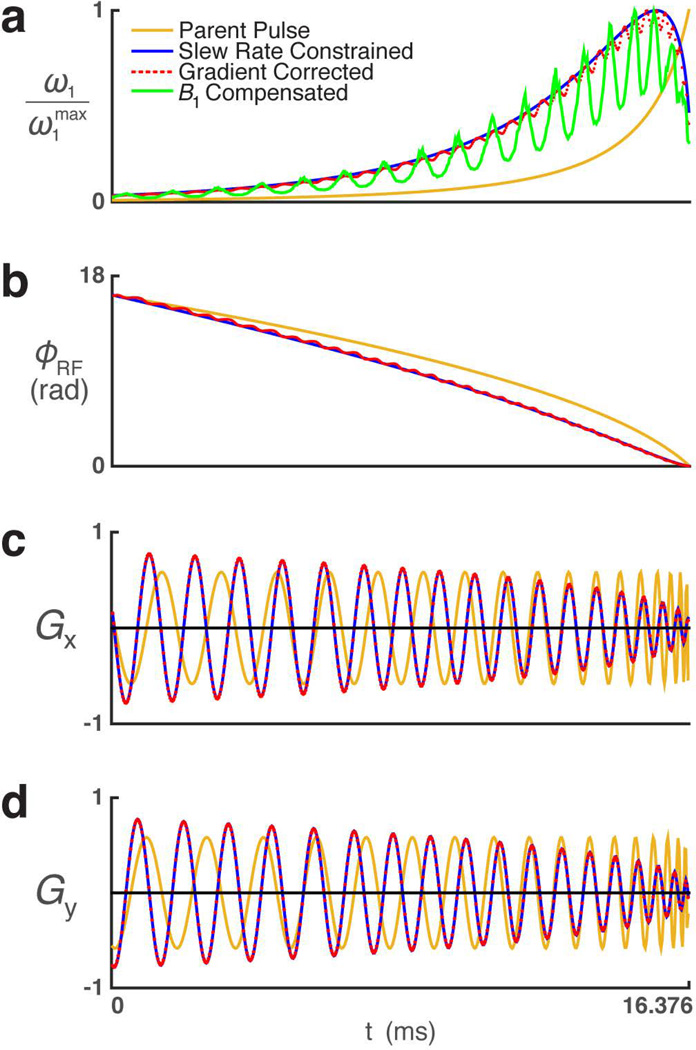
Experimental verification was performed on a Varian Direct Drive™ console (Agilent Technologies, Santa Clara, CA) interfaced to a 90 cm 4T magnet (Oxford Magnet Technology, Oxfordshire, UK) with a clinical gradient system (model SC72, Siemens, Erlangen, Germany). The 2D spatiotemporal excitation pulses were tested and optimized on a cylindrical phantom consisting of distilled water doped with 1.5% agar and 0.1 mM Gd (T1 ~ 1 s and T2 ~ 160 ms). A spiral k-space trajectory was resampled to accommodate gradient slew-rate constraints while maintaining the equivalent k-profile, as shown in Figure 4. Specifically, the k-space was sampled at different points along the identical spiral trajectory to meet slew rate constraints, resulting in modified gradient tables well within the slew-rate limit. The phase of the RF pulse was modified based on this newly sampled spiral k-space trajectory, while the RF amplitude weighting was density corrected accordingly. In consideration of the known sensitivity of spiral trajectories to gradient performance, the gradients in each direction were measured[12] and calibrated assuming no cross correlation. The RF pulse was further modified based on these measurements to ensure high fidelity. Demonstrations of selective excitation and chemical-shift effects were performed using two different sequences: 1) 2D excitation followed by phase- and frequency-encoded multi-shot spin-echo imaging (Fig. 3a), and 2) 2D excitation followed by spin-echo imaging using spiral-readout single-shot imaging (Fig. 3b). A 16-element transverse electromagnetic (TEM) head coil[13] was used for these experiments.
Figure 4.
Plots showing the modulation functions of the 2D HS1 pulse. (a) RF amplitude, (b) RF phase, (c) x-axis gradients, and (d) y-axis gradients for uniformly sampled (beige), slew-rate adjusted (blue), gradient measured (red dot), and B1 compensated (green) versions of the pulse.
To demonstrate B1-compensation, a double-loop quadrature surface coil (loop diameters = 8 cm) was employed. The B1+ map was obtained using the actual flip-angle sequence[14], whereas the B1− map was obtained using a double spin-echo sequence, in which an adiabatic half passage (AHP) pulse was used for excitation followed by two adiabatic full passage (AFP) pulses for slice-selective refocusing and quadratic phase compensation. Sufficient transmit power was delivered to both pulses to ensure operation in the adiabatic regime. This ensured that all isochromats went through equal rotation, thus resulting in an image reflecting only the B1− profile. B1+ compensated and non-compensated images were obtained with the double spin-echo sequence using AFP pulses for slice-selective refocusing and same peak B1 power. The use of two AFP pulses in the adiabatic regime ensured uniform inversion in the presence of surface coil B1+ inhomogeneity and compensated the subsequently induced quadratic phase along the slice direction. The images were then normalized with respect to the B1− map to remove the receive sensitivity, resulting in images reflecting only transmit B1+ spatial variation.
Further experiments were carried out to examine how the excitation profile changes in the presence of a highly inhomogeneous B0. To produce an inhomogeneous field, the x2–y2 shim current was driven to its limit. Images were then acquired using the multi-shot spin-echo sequence (Fig. 3a). To minimize spatial shift caused by inhomogeneous B0 during frequency encoding, the bandwidth of the readout was maximized, which resulted in a maximum voxel shift of only one-half of one voxel. These results were then compared to the profile of an amplitude-modulated 2D jinc pulse[15], which is a pulse weighted by a jinc function in 2D k-space, thus producing a cylindrical excitation profile similar to the 2D FM pulses. The number of spiral turns and excitation width was designed to be identical to the 2D FM pulses. B0 maps were acquired using two gradient echo images of different echo times, TE1 and TE2 (TE1 < TE2), and dividing their phase difference map by TE2 − TE1.
RESULTS
Simulations
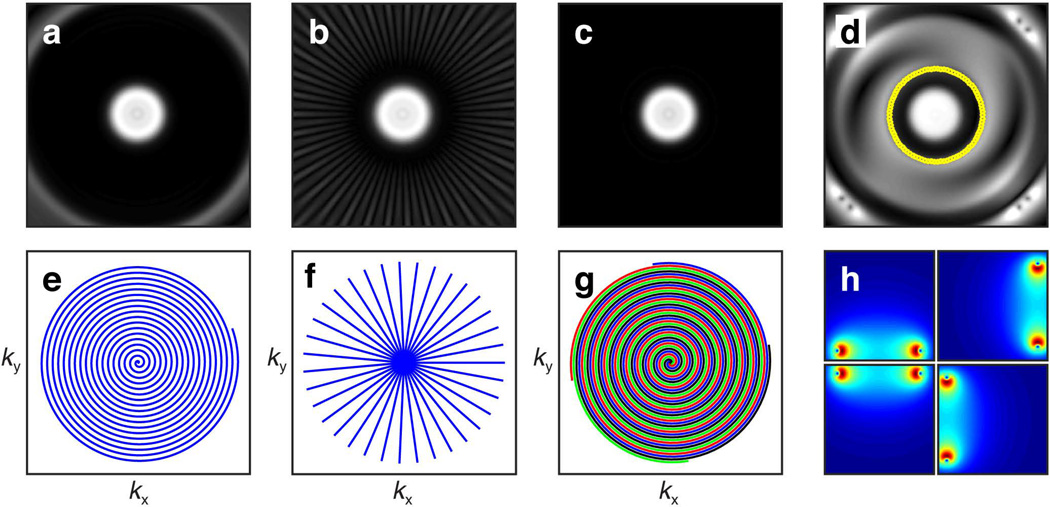
Results from Bloch simulations of a 2D chirp pulse at different time points during the second half of the pulse are shown in Figure 1d. As depicted by the bright spots, the coherence is steered along a spiral trajectory. The mesh plots in Figures 1c and 2c depict the simulated excitation profiles of the 2D chirp and 2D HS1 pulses, respectively.
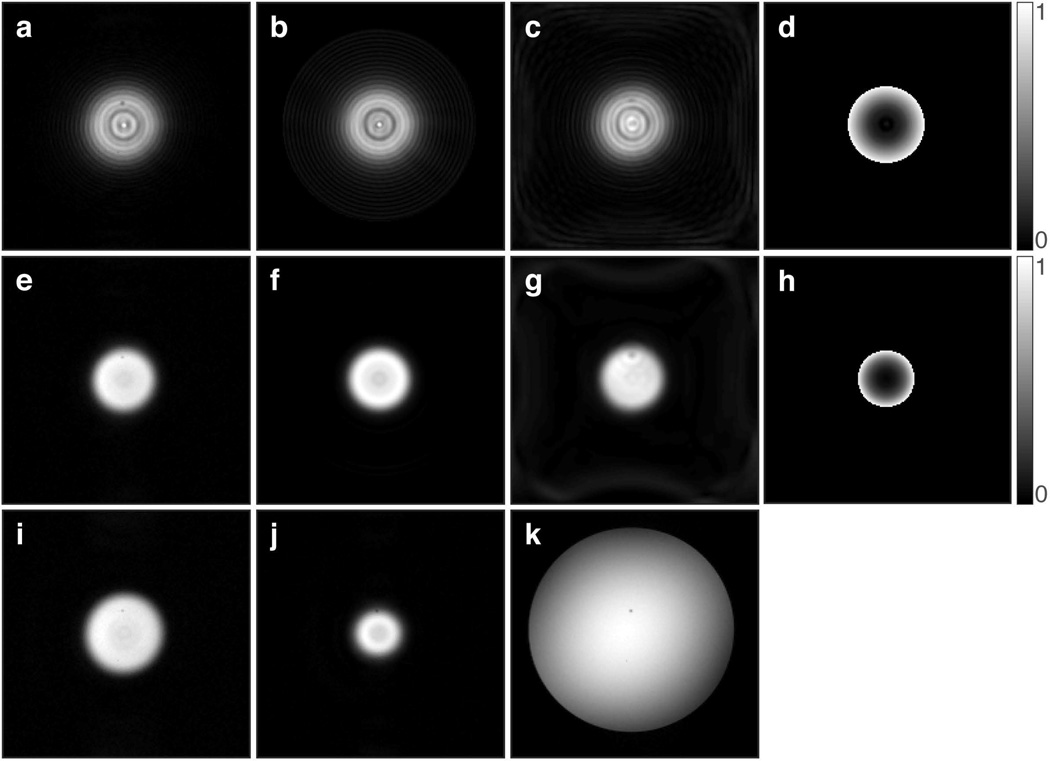
The uniformity of the flip angle produced by the 2D chirp and 2D HS1 pulses can be best visualized in the images of Figure 5. The radially-varying flip angle seen in the simulated excitation profile of the 2D chirp pulse (Fig. 5b) is a known undesirable characteristic of chirp pulses, while the profile of the simulated 2D HS1 pulse (Fig. 5f) exhibits a flatter flip angle profile, similar in shape to that produced by an equivalent 1D HS1 pulse.
Figure 5.
Images showing the features of (a–d) 2D chirp and (e–j) 2D HS1 pulses, when used to excite a cylindrical volume in a phantom (k). In all cases, the image slice orientation is perpendicular to the cylinder axis. (a,e) Images acquired with the multi-shot spin-echo sequence. (b,f) Bloch simulated excitation profiles. (c,g) Images acquired with the single-shot spin-echo sequence using spiral readout. (d,h) Bloch simulated normalized phase images. (i) Multi-shot spin-echo image acquired in the presence of a +50 Hz frequency offset, which increases the excitation radius. (j) Multi-shot spin-echo image acquired in the presence of a +50 Hz frequency offset, but using a 2D HS1 pulse with inverted ϕRF(t), which decreases the excitation radius. (k) Gradient echo axial image of the phantom (1.5% agar and 0.1 mM Gd). Images obtained from both simulation and experiment used a FOV of 192×192 mm and matrix size 192×192. TR of 200 ms and TE of 50 ms were used in all acquisitions.
Because the frequencies of both pulse and gradient functions are modulated, the bandwidth of the 2D spiral trajectory pulse cannot simply be defined in the traditional sense of the total frequency swept by the RF pulse. Instead, for a pulse of a specific spiral trajectory, pulse width, and gradient amplitude, one can use the chemical shift displacement Δx = Δω/BW · thk, where Δx is the spatial displacement of excitation thickness thk resulting from a pulse of bandwidth BW for a chemical shift Δω, to deduce the bandwidth. In the 1D case, the bandwidth of a pulse would be equivalent to the chemical shift that results in a spatial displacement equal to the excitation thickness. For the 2D FM case, because excitation width increases/decreases with chemical shift, we can define the bandwidth as the offset that doubles the excitation width. For the pulse used in the simulations and experiments (with Tp = 16.384 ms, 18-turn spiral trajectory, and 0.787 G/cm gradient amplitude), the bandwidth using this approach was 200 Hz, resulting in a time-bandwidth product of 3.2768. The relative specific absorption rate (SAR) of the 2D HS1 for a 10° flip angle produced with the TEM coil, calculated as the time integral of , was 2.978 W/kg, which is substantially greater than that required by a hard pulse (0.1746 W/kg) of equal bandwidth and flip angle. The peak value of γB1/2π was 30 Hz for the 2D HS1 and 6.3 Hz for the 4.4 ms hard pulse. The peak B1, for the 2D HS1 pulse was determined through Bloch simulations and was confirmed to be linear for flip angles up to 20°.
The point spread function (PSF) of the 2D FM pulses is a jinc function (polar coordinate analog of the sinc function) due to the finite spiral excitation k-trajectory being a product of an infinite spiral k-trajectory with a cylindrical window k-space filter, which is the Fourier transform of a jinc. Along the radial direction, the resolution is dictated by kmax of excitation k-space. In other words, the resolution is inversely proportional to the radial width of the cylindrical k-space filter. For the case of the 2D HS1 pulse that was used in simulations and experiments, the sequence shown in Fig. 3b was simulated for a single point isochromat to estimate the spatial resolution (defined as full width half max (FWHM) of the PSF) and to obtain confirmation of a jinc-shaped PSF. These simulations showed the PSF is spatially invariant and its width scales linearly with kmax. For example, for 1 cm resolution, kmax = 0.7168 cycles/cm, and for 0.5 cm resolution, kmax = 1.4336 cycles/cm. Although the resolution can be improved by increasing kmax, which consequently increases the pulse bandwidth, this comes at the cost of a higher slew rate and gradient amplitude.
Multi-dimensional pulses can be applied in segments, although this requires multiple scans (shots) to completely cover excitation k-space. In addition, these pulses can be implemented with multiple coils using parallel RF transmission (pTx)[16] [17] [18]. Figure 6 shows simulations of such implementations of 2D FM pulses. When adequate sampling and radially symmetric quadratic phase conditions are met, multi-shot radial (Fig. 6f) and interleaved spiral (Fig. 6g) trajectories have the advantage of allowing the pulse length to be shortened and thus can reduce effects during excitation at the cost of requiring increased number of shots to complete. Parallel excitation is another method to shorten the pulse length and has the advantage of requiring only a single shot to complete (Figs. 6d and 6h).
Figure 6.
Excitation profile of the 2D HS1 resulting from (a) spiral sampling, (b) multiscan radial sampling, and (c) interleaved spiral sampling demonstrates the ability to use multi-shot/interleaved excitation sampling schemes to reduce pulse width. In comparison to (e) single-shot spiral sampling of pulse width 16.384 ms, (f) multiscan radial sampling decreased the pulse width to 1.024 ms at the expense of requiring 35 excitations, while (g) interleaved spiral sampling decreased the pulse width to 4.096 ms at the expense of requiring 4 excitations. (d) Multicoil parallel excitation profile of the 2D HS1 pulse using ROI specification[18] (indicated by yellow circle). (h) Four coil elements placed along the sides of a square were used to accelerate excitation. Parallel transmission has the advantage of accomplishing single shot excitation with a reduced pulse width (4.096 ms) by taking advantage of the individual coil B1+ profiles.
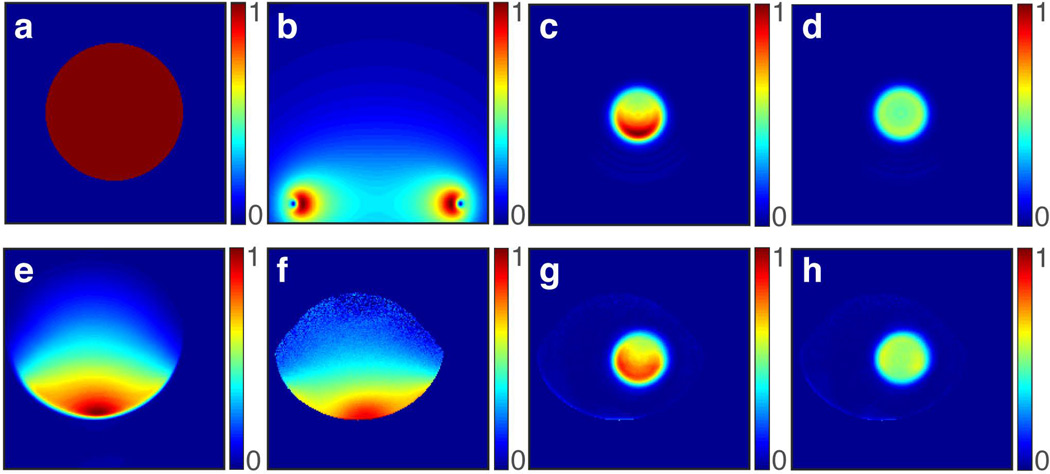
Bloch simulations were also performed to test the ability to compensate for B1, inhomogeneity (Figs. 7a–d). The transmit B1+ profile of a 14.4 cm diameter single loop coil, as calculated from the Biot-Savart equation, is shown in Figure 7b. The simulation result with the loop coil B1+ profile imposed, but not compensated (Fig. 7c), shows a non-uniform excitation profile, with a greater excitation near the coil due to the larger B1+ in that region. After applying compensation (Fig. 7d), using the same peak power, a significant improvement in uniformity is achieved. The excitation profile, which varied ~50% from top to bottom in the non-compensated case, is decreased to within ~6% with compensation. The lower flip angle resulting from compensation is due to the average B1 being lower as compared to the non-compensated case (Fig. 4a). The flip angle can be increased by increasing the peak B1 amplitude.
Figure 7.
Demonstrations of B1 compensation using 2D HS1 pulse. (a) Circular object with uniform spin density used in simulations. (b) Transmit B1 profile (B1+) of a 14.4 cm diameter loop coil calculated from the Biot-Savart equation. (c) Bloch simulation excitation profile in the presence of this non-uniform B1+ profile with no compensation shows greater excitation towards the coil where B1+ is greater. (d) Excitation profile with B1+ compensation shows highly uniform excitation. Measured (e) B1− and (f) B1+ of the surface coil used in experiments. The ability to compensate for B1+ inhomogeneity can be seen by comparing (g) non-compensated and (h) compensated images. In both simulation and experiment, the lower flip angle resulting from compensation is due to the lower average B1+ compared to the non-compensated case (Fig 4a).
Further simulations were performed to investigate the effects of B0 inhomogeneity having spatial distribution proportional to x2–y2 (Fig. 8d). Distortions to the excited disc are seen with the 2D HS1 pulse without (Fig. 8a) and with (Fig. 8b) B0 compensation. The disc is highly distorted in the non-compensated case, whereas some improvement in the excitation profile is observed when using the B0-compensated pulse. Although the compensated pulse does not produce a perfect disc (Fig. 8c), the modest improvement shown supports the hypothesis that spatiotemporal phase coherence can be exploited for such purposes.
Figure 8.
Simulations of the excitation profile produced by 2D HS1 pulse when B0 is proportional to x2−y2. (a) With the parent pulse, the excitation profile is no longer disc shaped due to B0 inhomogeneity. (b) The excitation profile of the redesigned pulse more closely resembles the desired profile shown in (c). (d) The B0 distribution (proportional to x2−y2) used in the simulations.
Experiments
Images of the cylindrical water phantom are shown in Figure 5. Experimental confirmation of selective excitation of a disc can be seen by comparing the gradient-echo image (Fig. 5k) with spin-echo images excited by a 2D chirp (Fig. 5a) or 2D HS1 (Fig. 5e) pulse. These images are in good agreement with the simulation results (Figs. 5b and 5f). Good agreement between simulations and experiments are also evident in images acquired with the single-shot spiral readout following 2D chirp (Fig. 5c) or 2D HS1 (Fig. 5g) excitation. To reconstruct images from these data, the acquired k-space image data were density compensated and gridded using a Kaiser-Bessel gridding kernel[19], followed by 2D FFT. As shown in Figure 5i, a constant frequency offset of +50 Hz increases the excitation radius, in accordance with equation [7], because the carrier frequency ωc is changed. For this same offset, when the RF frequency is swept in the opposite direction (equivalent to making A and B in equations [1] and [11] respectively, opposite in sign), a decrease in excitation radius is observed (Fig. 5j).
Results of experiments using the 2D HS1 pulse to compensate for B1 inhomogeneity are presented in Figures 7e–h. As stated above, all images in this figure have been normalized with respect to the receive B1− profile to allow depiction of intensity distortions solely due to B1+ inhomogeneity. Figures 7e and 7f, which are the measured B1− and B1+ maps respectively, show the inhomogeneous transmit and receive profiles of the surface coil used for the experiment. The image obtained with no compensation (Fig. 7g) shows ~50% variation across the excitation region, with a tendency to excite most signal toward the coil, as expected from the B1+ profile and simulation results. A comparison of this image with the compensated image (Fig. 7h) reveals a significant improvement, whereby variation across the excitation region has been reduced to within ~12%. The compensated 2D HS1 pulse pattern based on this B1+ profile is shown in Figure 4a. As mentioned above, the lower flip angle of the compensated profile is due to using the same peak B1 for both compensated and non-compensated case.
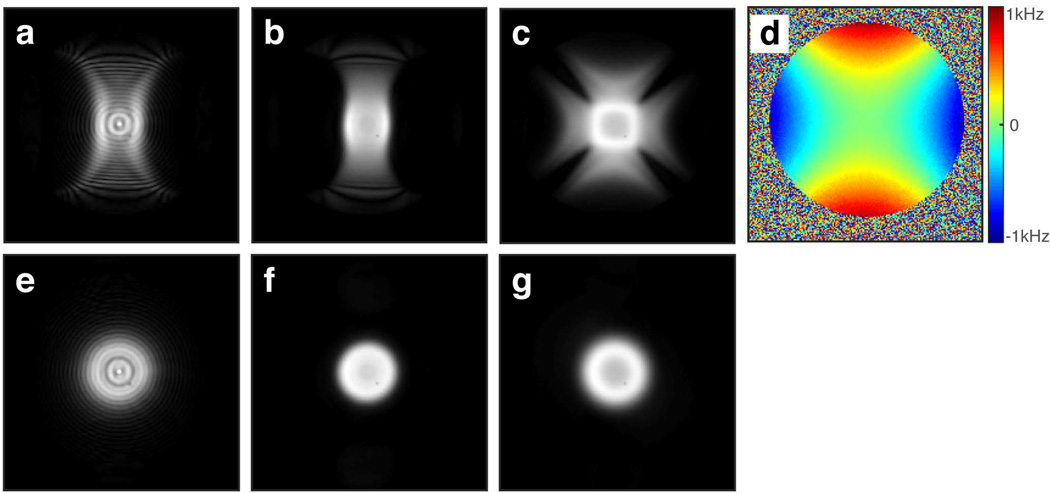
Figure 9 depicts the excitation profiles of the 2D chirp, 2D HS1, and 2D jinc pulses in the presence of large B0 inhomogeneity created by maximizing the current in the x2−y2 shim coil. As compared to the ideal profiles of the 2D chirp and 2D HS1 pulses shown in Figures 9e and 9f respectively, the excitation widths of the 2D chirp (Fig. 9a) and HS1 (Fig. 9b) pulses increased/decreased in regions where the field increased/decreased, in agreement with the expected changes in excitation radius when a frequency offset is applied (e.g., as shown in Figs. 5i and 5j). The 2D jinc profile somewhat resembled the B0 profile but did not increase nor decrease in width in a consistent manner as the frequency offset varied.
Figure 9.
Spin-echo images showing the effect of B0 inhomogeneity induced by a maximized x2−y2 shim. The volume was excited with (a) 2D chirp pulse, (b) 2D HS1 pulse, and (c) a Gaussian truncated 2D jinc pulse of 18 spiral turns and 13.14 ms duration. (d) B0 map obtained using the double gradient echo method. Desired ideal excitation profiles of the (e) 2D chirp pulse, (f) 2D HS1 pulse, and (g) 2D jinc pulse are shown for reference.
Finally, the 2D FM pulses were used to image human brain of healthy volunteers under a protocol approved by our institution’s IRB. A comparison of the standard spin-echo image (Fig. 10a) with the spin-echo image using a 2D HS1 excitation and fat suppression (Fig. 10b) shows the selected disc centered over the ventricles. The linear projections taken along the vertical (red) and horizontal (green) axes show no excitation beyond the radius of excitation. With no fat suppression applied (Fid. 10c), additional outer rings appear, which are seen as spikes on the line plots. The latter is a consequence of fat signals having a different excitation radius due to chemical shift, as was demonstrated in the phantom images. The unwanted fat signal was easily eliminated using a fat suppression technique[20] (Fig. 10b).
Figure 10.
Human brain imaging with the 2D HS1 pulse. (a) Reference spin-echo image (FOV 256×256 mm, matrix size 256×256, TE = 21 ms, TR = 455.024 ms). (b) Spin-echo image using the 2D HS1 pulse for excitation. All acquisition parameters were fixed, except the 2D HS1 pulse was preceded by a fat-saturation module and TR = 475.66 ms. (c) Imaging with the 2D HS1 pulse without fat saturation produces lipid signals at the periphery. These lipid signals arise from scalp and marrow because the fat disc is wider than the water disc, due to chemical shift.
DISCUSSION AND CONCLUSION
For certain applications, spatiotemporal techniques can offer unique advantages over conventional frequency- and phase-encoding techniques in MRI. In this work, a method of designing 2D pulses using a spatially-dependent frequency sweep was introduced. In contrast to previous spatiotemporal methods in which the spatiotemporal nature of the excitation process is exploited for encoding spatial information, these new 2D FM pulses yield spatiotemporal phase coherence.
The ability to selectively ‘carve out’ a target region was shown through both simulations and experiments. Furthermore, the ability to compensate for transmit B1+ inhomogeneity was experimentally demonstrated using a surface coil by exploiting the spatiotemporal feature of the phase coherence induced by the pulse. Namely, B1+ inhomogeneity compensation is achieved by scaling the transmitter voltage of the pulse pattern based on the relative B1+ along the phase coherence trajectory.
As is well known when dealing with spiral trajectories, it is important to operate well within the slew-rate limits of the gradient system when designing the pulse. To accommodate this, the initial uniformly sampled spiral was resampled to meet gradient slew-rate constraints, and then the pulse pattern was modified accordingly (Fig. 4). Measurement and correction of the gradient nonlinearities and timing errors represent important steps in ensuring high fidelity. Failure to do this causes inaccurate sampling of the spiral k-trajectory, resulting in a skewed elliptical excitation and inaccurate B1 compensation.
Doubling the bandwidth while keeping the time-bandwidth product constant causes a doubling of the SAR of both the 2D HS1 (5.957 W/kg) and the hard pulse (0.3492 W/kg), as expected from theory. However, if the bandwidth is doubled by doubling the time-bandwidth product to achieve the same flip angle, the SAR of the 2D FM pulse increases 4-fold (11.913 W/kg). The latter is due to the excitation area, which is proportional to the square of the radius, increasing 4-fold as well. Therefore, 4 times more power for equal power distribution or twice the peak B1 amplitude is required.
As was shown, a frequency offset (e.g., caused by chemical-shift) leads to an increase or decrease of the excitation radius depending on the polarity of the offset and frequency sweep direction (Figs. 5i and 5j). As predicted based on equation [6], a positive (or negative) frequency offset causes a linear phase accumulation and results in added (or subtracted) parabolic phase since this linear phase is distributed along a spiral k-trajectory. Depending on the sign of the frequency offset, this additional phase either increases or decreases the steepness of the paraboloid, which is identical to increasing or decreasing A and B of equations [1] and [11]. This is a unique property and can be advantageous in situations such as forgoing the need to implement a fat suppression module to eliminate circumscribing fat signals around the brain.
Experiments were carried out to investigate how the excitation profile changes in the presence of a highly inhomogeneous B0 field induced by the x2−y2 shim and how it compares to that produced by an amplitude-modulated 2D jinc pulse using the same number of spiral turns. Driving the x2−y2 shim to its limit caused a ±1000 Hz variation in the B0 field at 4T. With this B0 variation, the excitation width of the 2D chirp and HS1 pulses increased proportionately in areas where the field increased (and vice versa), resulting in an excitation profile somewhat resembling the B0 distribution in space. Although the 2D jinc pulse showed an excitation profile somewhat correlated to the field profile, it did not show a correlation to the polarity of the field variation as was the case with the 2D chirp and HS1 pulses. When driving the x2−y2 shim current to its opposite extreme, the polarity of inhomogeneity rotated by π/2 (i.e., the offset varied from 0 to +1000 Hz along the x-direction and from 0 to −1000 Hz along the y-direction), and the excitation profile of the 2D chirp and HS1 pulses rotated by π/2 as well, whereas the 2D jinc pulse produced an image that looked similar to the previous case.
As shown in our initial simulation results (Fig. 8), by simply subtracting a phase that resembles the x2−y2 field profile from the existing pulse table, an improvement in the excitation profile can be seen in comparison with the non-compensated case. Based on these results, and considering that the excitation profile of the 2D spatiotemporal pulses behave in a predictable manner as B0 varies, it may be possible to fully compensate for B0 inhomogeneity in future work. Although not shown here, an alternative approach to compensate for B0 inhomogeneity was further explored through simulations using a similar method to that was used for B1 compensation, although instead of modifying the pulse amplitude, the frequency of the RF pulse along the coherence trajectory was altered. This approach did show an improvement in the excitation profile compared to the non-compensated case, but did not produce the degree of compensation hoped for. This was largely due to two reasons: 1) an inaccurate assumption of the coherence trajectory caused by a non-constant spatially varying B0, and 2) a change of the local quadratic phase coherence profile due to a spatially-varying adjacent field environment along the coherence trajectory.
Although the k-space trajectories evaluated were limited to radially symmetric trajectories (Figs. 6e–g) in this work, other trajectories such as an EPI-type raster trajectory can be used to excite a square-shaped region as long as the quadratic phase is allocated with radial symmetry. Also, by extending to three dimensions, for example by sampling a spherical trajectory, it should be possible to selectively excite a sphere for 3D imaging and to compensate for field inhomogeneity within.
ACKNOWLEDGEMENTS
Research reported in this publication was supported by the National Institute Of Mental Health under Award Number R24MH105998, the National Institute of Biomedical Imaging and Bioengineering under Award Number P41EB015894, and American Heart Association under Award Number 14PRE20380625. The content is solely the responsibility of the authors and does not necessarily represent the official views of the National Institutes of Health. The authors are grateful to Dr. Gregor Adriany for valuable technical assistance.
REFERENCES
- 1.Tannus A, Garwood M. Adiabatic Pulses. NMR Biomed. 1997;10:423–434. doi: 10.1002/(sici)1099-1492(199712)10:8<423::aid-nbm488>3.0.co;2-x. [DOI] [PubMed] [Google Scholar]
- 2.Garwood M, DelaBarre L. The Return of the Frequency Sweep: Designing Adiabatic Pulses for Contemporary NMR. J Magn Reson. 2001;153:155–177. doi: 10.1006/jmre.2001.2340. [DOI] [PubMed] [Google Scholar]
- 3.Pipe J. Spatial Encoding and Reconstruction in MRI with Quadratic Phase Profiles. Magn Reson Med. 1995;33:24–33. doi: 10.1002/mrm.1910330105. [DOI] [PubMed] [Google Scholar]
- 4.Park JY, DelaBarre L, Garwood M. Improved Gradient-Echo 3D Magnetic Resonance Imaging Using Pseudo-Echoes Created by Frequency-Swept Pulses. Magn Reson Med. 2006;55:848–857. doi: 10.1002/mrm.20821. [DOI] [PubMed] [Google Scholar]
- 5.Shrot Y, Frydman L. Spatially Encoded NMR and the Acquisition of 2D Magnetic Resonance Images Within a Single Scan. J Magn Reson. 2005;172:179–190. doi: 10.1016/j.jmr.2004.09.024. [DOI] [PubMed] [Google Scholar]
- 6.Chamberlain R, Park JY, Corum C, Yacoub E, Ugurbil K, Jack CR, Jr, Garwood M. RASER: A New Ultrafast Magnetic Resonance Imaging Method. Magn Reson Med. 2007;58:794–799. doi: 10.1002/mrm.21396. [DOI] [PubMed] [Google Scholar]
- 7.Dumez JN, Frydman L. Multidimensional Excitation Pulses Based on Spatiotemporal Encoding Concepts. J Magn Reson. 2013;226:22–34. doi: 10.1016/j.jmr.2012.10.010. [DOI] [PubMed] [Google Scholar]
- 8.Snyder A, Corum C, Moeller S, Powell N, Garwood M. MRI by Steering Resonance Through Space. Magn Reson Med. 2013;72:49–58. doi: 10.1002/mrm.24888. [DOI] [PMC free article] [PubMed] [Google Scholar]
- 9.Silver MS, Joseph RI, Hoult DI. Highly Selective π/2 and π Pulse Generation. J Magn Reson. 1984;59:347–351. [Google Scholar]
- 10.Pauly J, Nishimura D, Macovski A. A k-Space Analysis of Small-Tip-Angle Excitation. J Magn Reson. 1989;81:43–56. doi: 10.1016/j.jmr.2011.09.023. [DOI] [PubMed] [Google Scholar]
- 11.Powell N, Jang A, Park JY, Valette J, Garwood M, Marjanska M. Gradient Rotating Outer Volume Excitation (GROOVE): A Novel Method for Single-Shot Two-Dimensional Outer Volume Suppression. Magn Reson Med. 2014 doi: 10.1002/mrm.25101. [DOI] [PMC free article] [PubMed] [Google Scholar]
- 12.Duyn J, Yang Y, Frank J, van der Veen JW. Simple Correction Method for k-Space Trajectory Deviations in MRI. J Magn Reson. 1998;132:150–153. doi: 10.1006/jmre.1998.1396. [DOI] [PubMed] [Google Scholar]
- 13.Vaughan JT, Hetherington H, Otu J, Pan J, Pohost G. High Frequency Volume Coils for Clinical NMR Imaging and Spectroscopy. Magn Reson Med. 1994;32:206–218. doi: 10.1002/mrm.1910320209. [DOI] [PubMed] [Google Scholar]
- 14.Yarnykh V. Actual Flip-Angle Imaging in the Pulsed Steady State: A Method for Rapid Three-Dimensional Mapping of the Transmitted Radiofrequency Field. Magn Reson Med. 2007;57:192–200. doi: 10.1002/mrm.21120. [DOI] [PubMed] [Google Scholar]
- 15.Pauly J. Stanford University Radiological Sciences Laboratory RF Pulse Design Software. [Accessed April 2, 2015]; http://rsl.stanford.edu/research/software.html. Published March 1, 2003, Updated April 19, 2015. [Google Scholar]
- 16.Katscher U, Bornert P, Leussler C, van den Brink J. Transmit SENSE. Magn Reson Med. 2003;49:144–150. doi: 10.1002/mrm.10353. [DOI] [PubMed] [Google Scholar]
- 17.Zhu Y. Parallel Excitation With an Array of Transmit Coils. Magn Reson Med. 2004;51:775–784. doi: 10.1002/mrm.20011. [DOI] [PubMed] [Google Scholar]
- 18.Grissom W, Yip C, Zhang Z, Stenger V, Fessler J, Noll D. Spatial Domain Method for the Design of RF Pulses in Multicoil Parallel Excitation. Magn Reson Med. 2006;56:620–629. doi: 10.1002/mrm.20978. [DOI] [PubMed] [Google Scholar]
- 19.Jackson J, Meyer C, Nishimura D, Macovski A. Selection of a Convolution Function for Fourier Inversion Using Gridding. IEEE Trans Med Imaging. 1991;10:473–478. doi: 10.1109/42.97598. [DOI] [PubMed] [Google Scholar]
- 20.Haase A, Frahm J, Hanicke W, Matthaei D. 1H NMR Chemical Shift Selective (CHESS) Imaging. Phys Med Biol. 1985;30:341–344. doi: 10.1088/0031-9155/30/4/008. [DOI] [PubMed] [Google Scholar]


