Abstract
The development of magnetic particle imaging (MPI) has created a need for optimized magnetic nanoparticles. Magnetic particle relaxometry is an excellent tool for characterizing potential tracers for MPI. In this paper, we describe the design and construction of a high-throughput tabletop relaxometer that is able to make sensitive measurements of MPI tracers without the need for a dedicated shield room.
I. INTRODUCTION
Magnetic particle imaging (MPI) is an emerging tracer modality capable of imaging spatial distributions of superparamagnetic iron oxide (SPIO) nanoparticles.1 MPI is very sensitive (∼100 nmol/voxel detection limit), has exquisite contrast as a tracer modality (no background signal), and is capable of real-time imaging.2–4 In terms of applications, MPI has been proposed as an alternative angiographic imaging technique, especially for patients with chronic kidney disease (CKD) who cannot tolerate the iodine- and gadolinium-based contrast agents used in CT and MR angiography.5 Recent publications describing in vivo cell tracking have also demonstrated the significant potential of MPI as a molecular imaging technique.6
Here we describe the MPI imaging process. The MPI process exploits the nonlinear nature of SPIO magnetization as described by steady-state Langevin theory.1 Although different for each type of particle, the magnetization of SPIOs generally saturates at applied magnetic fields of around ±10 mT/μ0 (Hsat). At this point, the magnetic force is sufficient to overcome opposing thermal forces and align all of the SPIO magnetic moments with the applied field. If a magnetic field is swept from –Hsat to +Hsat across a voxel containing an SPIO tracer, it induces a magnetization reversal that can be detected in a nearby receiver coil. Imaging is accomplished via the combination of strong, temporally static gradient magnetic fields and spatially homogenous time-varying magnetic fields (“excitation fields”).7 The gradient field selectively saturates all tracers except for those located at the isocenter (termed the “field-free region” or FFR). In some designs, this FFR is a field-free point (FFP) while in others it is a field-free line (FFL).7,8 Time-varying but spatially homogeneous magnetic fields are superposed on the gradient field, causing the FFR to shift throughout the imaging volume in a known trajectory, which both generates the fundamental MPI signal and provides a mechanism to sample a large field-of-view (FOV) over time. The resulting time-dependent magnetization of SPIO particles induces a voltage in a receiver coil, and because the FFR trajectory is known, this raw signal can be gridded to the known field value to generate an image.3,4 When an FFL scanner is used, computed tomography reconstruction techniques such as filtered back projection are also needed.9
This time-domain to spatial-domain gridding, along with several additional processing steps such as recovery of the image information lost due to excitation feedthrough, defines x-space reconstruction. X-space MPI generates images with high native resolution and has a temporal footprint that approaches real-time imaging.9–11 Furthermore, x-space MPI requires no prior knowledge about the tracer and has been proven to be a linear and shift-invariant (LSI) imaging system.12 An alternative MPI reconstruction approach is known as harmonic-space MPI or system matrix reconstruction. While the governing physical principles are the same, the two techniques differ in both data acquisition and image reconstruction methods. In the harmonic-space approach, pre-characterization of the system is required. A system matrix is constructed from the Fourier transform of the time-domain signal corresponding to a full imaging trajectory applied to an idealized tracer point-source placed at each voxel location in the imaging FOV.13,14 A harmonic-space MPI image is obtained by scanning the sample and solving an inverse problem using the system matrix. In addition to the long acquisition time of system matrices, harmonic-space reconstruction generally involves regularization due to poor conditioning and other matrix inversion techniques that can be computationally expensive.15
Given that the resolution and sensitivity limits of MPI depend strongly on the tracer, there is great interest in developing optimized tracers for MPI, and it would be helpful to have a high-throughput device that can quickly predict or measure the imaging response.11,16–18 An MPI spectrometer is a zero-dimensional measurement that can accomplish this task: tracers are exposed to a sinusoidal magnetic field, and the received signal is transformed to the Fourier domain to observe the harmonic response. This response is equivalent to the spectral response of the tracer sample at the FFR in an imaging device.19 However, spectroscopy is limited in that it cannot predict image resolution or measure the time-domain relaxation dynamics; it only allows comparison of frequency-domain information between tracers.
An analogous device has been developed for x-space MPI, termed an MPI relaxometer.20 An x-space relaxometry experiment is essentially a one-dimensional imaging experiment. The relaxometer uses the same excitation fields and similar hardware as an imaging device but does not require gradients. The raw signal measured by the receive coils in the relaxometer is the voltage due to the SPIO tracers’ time-dependent magnetization (the same as for an imaging experiment). Using x-space acquisition and reconstruction methods, a relaxometer directly measures the one-dimensional point spread function (PSF) of the MPI system. This is directly related to resolution in an imaging format and provides information about the dynamic relaxation physics of the MPI tracer.21 Because the LSI MPI process can be mathematically described as a convolution of the PSF with the spatial distribution of tracers, the relaxometer is a powerful tool for screening potential imaging tracers. In this paper, we describe the design and construction of a tabletop relaxometer system. The relaxometer is intended for researchers who want to make high-sensitivity measurements without the need for a shield room and is particularly well suited for those interested in fabricating and characterizing new tracers for use in MPI.
II. X-SPACE MAGNETIC PARTICLE RELAXOMETRY
In this section, we describe MPI signal generation and how it motivates the use of a relaxometer to measure the point spread function. The tracers used in MPI can be approximately and phenomenologically described by the Debye model
| (1) |
where τeff is an effective relaxation time constant and M0 is the equilibrium magnetization described by the Langevin magnetization equation
| (2) |
| (3) |
where the spatial distribution of tracers ρ(x) δ(y) δ(z) is along one dimension (x) and is zero everywhere else (y, z indicated by the Dirac delta functions ), H(t) is the magnetic field experienced by the particle, and the particle-specific constant α is defined as
| (4) |
where kB is the Boltzmann constant and T is the temperature. The saturation magnetic moment ms is given by the relation
| (5) |
where dC is the magnetic core diameter and Ms is the saturation magnetization (0.6 T/μ0 for magnetite).3,21
The Debye model accounts for the non-instantaneity of magnetic moment alignment with the applied magnetic field due to relaxation physics. MPI tracers are in general subject to various forces (e.g., viscous and thermal) that oppose moment alignment, which, in addition to inertia (significant only for very large particles), cause the magnetization to lag the applied magnetic field. Magnetic relaxation in MPI is typically a combination of Brownian and Néel effects with relaxation times given by
| (6) |
| (7) |
where VC is the volume of the iron core, VH is the hydrodynamic volume of the iron core plus surfactant, η is the dynamic viscosity of the surrounding fluid, K is the crystalline anisotropy constant, and τ0 is a constant on the order of 10−10s.22,23 Magnetic relaxation also exhibits a strong dependence on applied magnetic field amplitude.24 All of these dependencies are lumped together into the effective relaxation time constant of the Debye model, τeff.
Solving the differential magnetization equation enables one to write the magnetization as a function of the equilibrium magnetization convolved with a relaxation kernel r(t)21
| (8) |
It follows that the signal from a receiver coil (with sensitivity B1) is written as a temporal convolution with r(t) as well
| (9) |
which can be written in terms of a spatial convolution of the particle distribution with a PSF h(x) multiplied by a scalar constant γ that collects various system parameters and the instantaneous FFP velocity, 3
| (10) |
Compensating for the FFP velocity and constant γ terms, the resulting image can be approximated by21
| (11) |
These spatial and temporal convolutions lead to an overall loss of signal-to-noise ratio (SNR) and asymmetric, scan direction-dependent blurring in the image.21 In theory, MPI’s image resolution improves linearly with gradient strength (G) and cubically with tracer core diameter and is defined in terms of experimental and particle characteristics3,13
| (12) |
In practice, because magnetic relaxation leads to a second blurring in addition to that provided by the fundamental steady-state Langevin physics, the resolution can be measured by the full-width at half-maximum (FWHM) of the experimental PSF.
III. HARDWARE
It is clear that measuring the PSF of a potential MPI tracer can provide great insight into final image quality. There is great effort toward developing tailored MPI tracers with minimal relaxation for high-resolution, high-SNR imaging, and it will be helpful to have a high-throughput device for efficient screening of potential tracers that does not require a specialized facility to function. The relaxometer described here is a sensitive tabletop system, particularly well suited for researchers interested in developing tracers. The relaxometer serves as a complement to standard characterization techniques, such as TEM and AC susceptometry, and fits well within the workflow of such experiments. The key components of the relaxometer are a high-power, low-distortion excitation transmit chain, a low-noise receive chain that rejects excitation field feedthrough and amplifies the harmonic signal from the particles, and an electromagnetic shield to reject ambient interference.
A. Transmit chain
A high-level depiction of the transmit chain is shown in Figure 1. The excitation circuitry must be capable of achieving strong magnetic fields able to fully saturate MPI tracers. Additionally, as the signal from the nanoparticles contains higher harmonics of the excitation frequency, care must be taken to achieve high attenuation of transmit harmonics that would otherwise contaminate the signal from the sample under test. A typical excitation waveform is several orders of magnitude stronger than the received signal, thus we require exquisite tonal purity.
FIG. 1.
High-level depiction of the transmit filter chain. A sinusoidal signal at the resonant frequency is generated by a National Instruments data acquisition system (DAQ) DAQ and fed to a power amplifier. The transmit filter chain consists of a matching inductor, common mode choke, and a differential low-pass filter. The final stage of the low-pass filter resonates with the transmit coil.
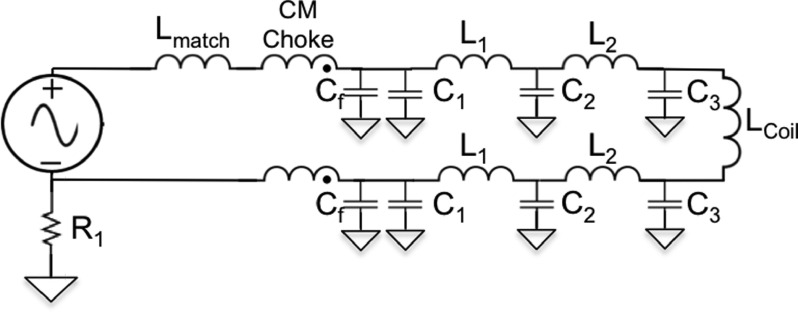
To achieve this, we have employed a high-power filter chain with our transmit coil. This chain contains common mode and differential mode filters and multiple resonances as shown in the schematic in Figure 2. Values for inductors and capacitors were calculated by solving an optimization problem based on linear two-port theory
| (13) |
The four capacitor and three inductor values are contained in the vector x. f1 evaluates the harmonic currents in the transmit coil, rewarding attenuation, while f2 penalizes deviation from the desired input impedance. The vector y contains the load current and voltage given by the linear two-port model. The remaining constraints are practical engineering constraints: is a discrete set of capacitor values and is a set defining box constraints for inductors, limiting them to 10-100 μH. With the exception of feedthrough capacitors, all capacitors in the transmit filter chain are high-power polypropylene capacitors (Celem, Jerusalem, Israel), which have been shown to introduce minimal distortion interference.25
FIG. 2.
Optimized transmit filter layout. Cf are feedthrough capacitors, and C1−3 are high-power Celem capacitors. L1−2 were wound by hand using 10AWG insulated copper wire around PVC pipe elbows. R1 is built in to the power amplifier.
The transmit chain is driven by a 16-bit DAQ (National Instruments USB6363, Austin, TX) fed to a high-power audio amplifier (AE Techron 7224, Elkhart, IN). The transmit coil was wound on a 3D-printed former using Litz wire (length = 14 cm, Nturns = 70, inductance = 37 μH) with resonant frequency f0 = 16.8 kHz. The transmit filter achieved an attenuation of 54 dB at 2f0 (the second harmonic) and greater than 80 dB at the third harmonic while capable of achieving excitation field amplitudes up to 20 mT at the fundamental.
B. Receive signal chain
The receive chain must accomplish two goals: amplify the signal from the sample and minimize the direct feedthrough from the excitation field. Because the transmit and receive coils are coaxial, there is significant feedthrough from the excitation field, which is orders of magnitude greater than the signal from the tracers. Failing to remove this feedthrough obscures the signal from the tracer under test, and can lead to preamplifier saturation. The receive coil was wound as a gradiometer to minimize shared flux with the transmit coil, and f0 was further attenuated by a notch filter for a total of 46 dB cancellation. The signal was then amplified by a low-noise preamplifier (SRS560) and sampled at 500 ksps by the same NI DAQ.
C. Shield
To reject ambient interference and enable high-sensitivity measurements, key components of the relaxometer were housed in an eddy current-shielded enclosure. Shield design was achieved by balancing the interference rejection goals with competing requirements of cost, size, and ease of machining. Enclosing the entire signal chain (including amplifiers and data acquisition systems) in a shield room is costly and runs counter to the goal of building a small tabletop system. To this end, only the transmit and receive filter chains, including the sample bore, were enclosed within the shield. All other components (amplifiers and data acquisition hardware) were located next to the shield, and all leads were kept short to minimize pickup.
The eddy current shield design was guided by the skin effect. Electromagnetic Interference (EMI) sources induce a surface current density (Js) on the shield, and this current density decays exponentially into the shield thickness, with a characteristic decay length known as the skin depth, δ
| (14) |
| (15) |
where d is the depth from the surface of the conductor, f is the operating frequency, μr is relative permeability, and σ is electrical conductivity. For a copper shield and operating frequency of 16.8 kHz, the skin depth is approximately 500 μm. The shield was thus constructed using 2 mm-thick copper sheet, corresponding to ∼4 skin depths for a ∼98% drop in current density.
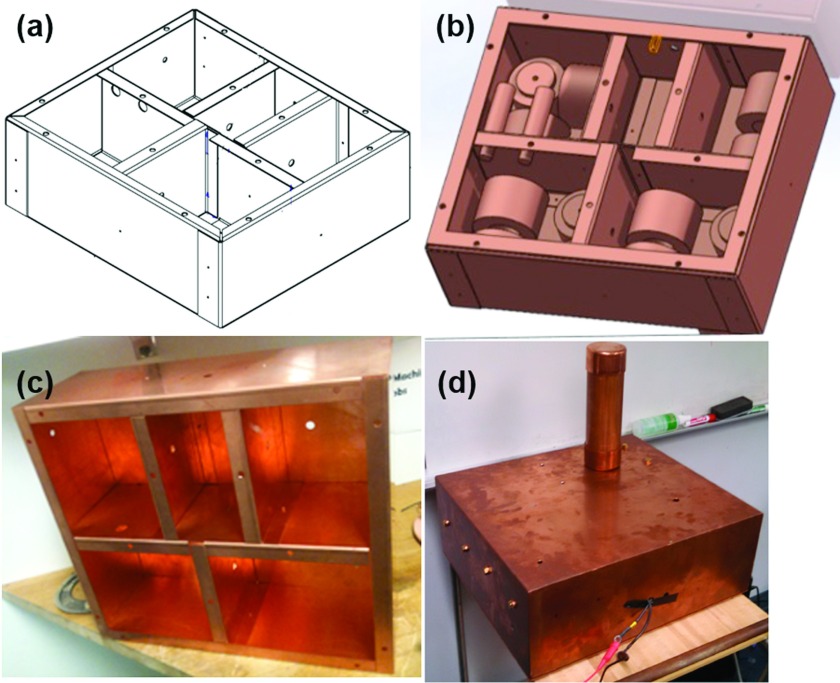
Shielding was designed using SOLIDWORKS (Dassault Systèmes, Waltham, MA) and is composed of three parts: body, inserts, and lid. For ease of machining, the body was constructed from a single sheet of copper that was cut, then folded, and riveted into shape. Copper sheet inserts were brazed into place to separate stages of the transmit and receive filter chains. A removable lid grants access to interior chambers, and copper-beryllium fingerstock provides additional conductive shielding. The transmit and receive coils are housed in a removable cylindrical shield. This cylindrical shield fits inside a copper plumbing cap bolted to the lid, and a second plumbing cap completes the bore shield. The SOLIDWORKS model for the finished shield can be seen in Figure 3.
FIG. 3.
Pictures of the completed relaxometer shield. ((a) and (b)) Picture of SOLIDWORKS model showing inserts that separate stages of the transmit and receive filter stages. ((c) and (d)) Complete shield including the cylindrical bore shield plus cap.
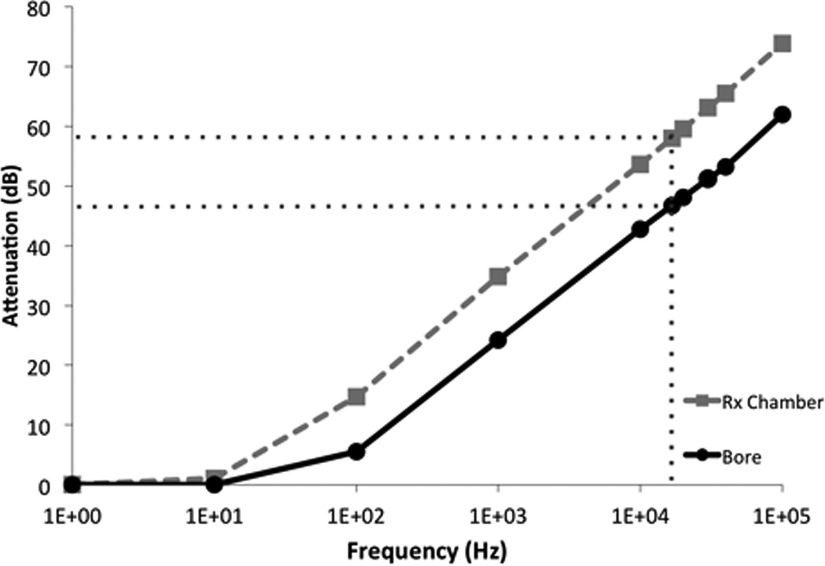
To demonstrate the importance of shielding the bore, the shield was simulated using COMSOL Multiphysics v5.0 (COMSOL, Inc., Burlington, MA). A spatially uniform magnetic field, with frequencies varying from 1 Hz to 100 kHz, was used as an interference source, and the magnetic field was evaluated in the centers of the receive chamber and bore. Shielding effectiveness was quantified in terms of an attenuation coefficient defined as
| (16) |
The attenuation in the receive bandwidth was predicted to be greater than 45 dB, as shown in Figure 4. The result further suggests the importance of shielding the bore, as any interference would be picked up by the receive coil and amplified along with the small sample signal.
FIG. 4.
Results from COMSOL shielding simulation. The attenuation in both the receive chamber and the bore was predicted to be greater than 45 dB in the receive bandwidth. The difference in attenuation factors is due to the geometry of the bore.
IV. CONTROLS
A. Pulse sequence
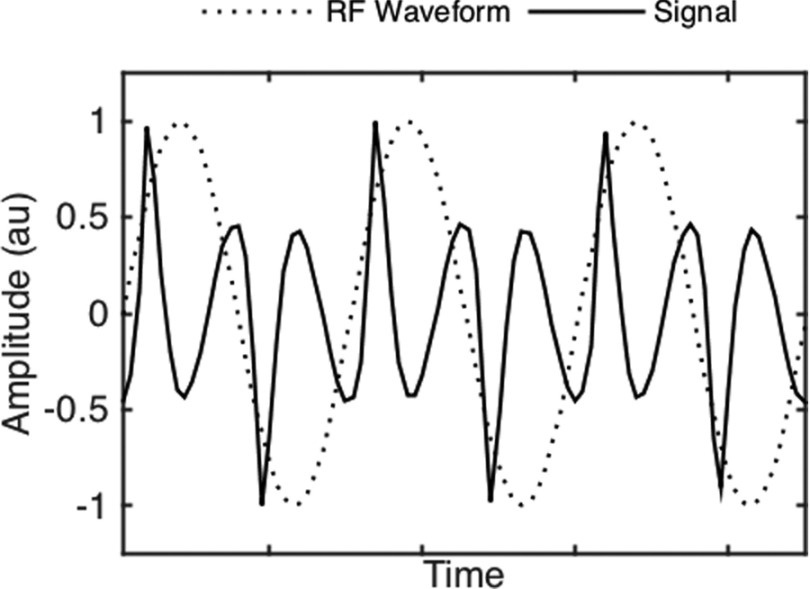
Data acquisition and reconstruction was controlled using a 16-bit DAQ (National Instruments USB6363, Austin, TX) and MATLAB (Mathworks MATLAB, Natick, MA). Total experiment time was on the order of 30 s, which includes initialization of the DAQ (∼20 s) and all data acquisition (∼10 s). A background acquisition (no sample) was acquired prior to every signal acquisition and averaged four times for each experiment (Navg = 4). The averaged background signal was subtracted from the averaged signal acquisition in processing. An example of the outgoing transmit signal and incoming raw data is shown in Figure 5.
FIG. 5.
Slices of the excitation field waveform and raw signal from the relaxometer.
B. Phase calibration
Because the signal is gridded to the instantaneous magnetic field experienced by the particles in x-space MPI, it is necessary to account for delays introduced by the transmit and receive chains. A sniffer coil is used to detect the phase of the excitation field and remove transmit chain delay. To calibrate the receive side, the PSF from a calibration sample with known negligible relaxation (Chemicell fluidMag 50 nm nanoparticles, Berlin, Germany) was reconstructed using varying delay times.21 The receive delay was chosen based on the delay time giving the maximally symmetric PSF.
C. Signal reconstruction
We used a standard x-space method for reconstruction.3,21 The received signal is first digitally low pass-filtered to remove noise not near a specific sub-band around each harmonic. The instantaneous magnetic field experienced by the sample is reconstructed using phase from the sniffer coil and the measured receive delay. The velocity of the excitation field is defined as the time derivative of the magnetic field waveform and is used to compensate (by division) the received signal. This step is necessary to achieve LSI. The acquired signal is then broken into right-moving and left-moving components (corresponding to positive and negative velocity, respectively). A simple gridding procedure is used to map the time domain signal to corresponding position (field) of the phase-compensated excitation field trajectory. This mapping is done via a finite set of bins in which simple averaging by number of samples per bin is employed. To recover the lost signal at the fundamental frequency, which corresponds to image DC signal, we can pin the edges of the reconstructed PSF to zero.12 Here we are making the assumption that at these large magnitudes in applied field, the particles are fully saturated and cannot yield a signal. For excitation waveforms with amplitudes much larger than the characteristic saturation of the tracer, this is well justified.
V. DISCUSSION
A. Sensitivity
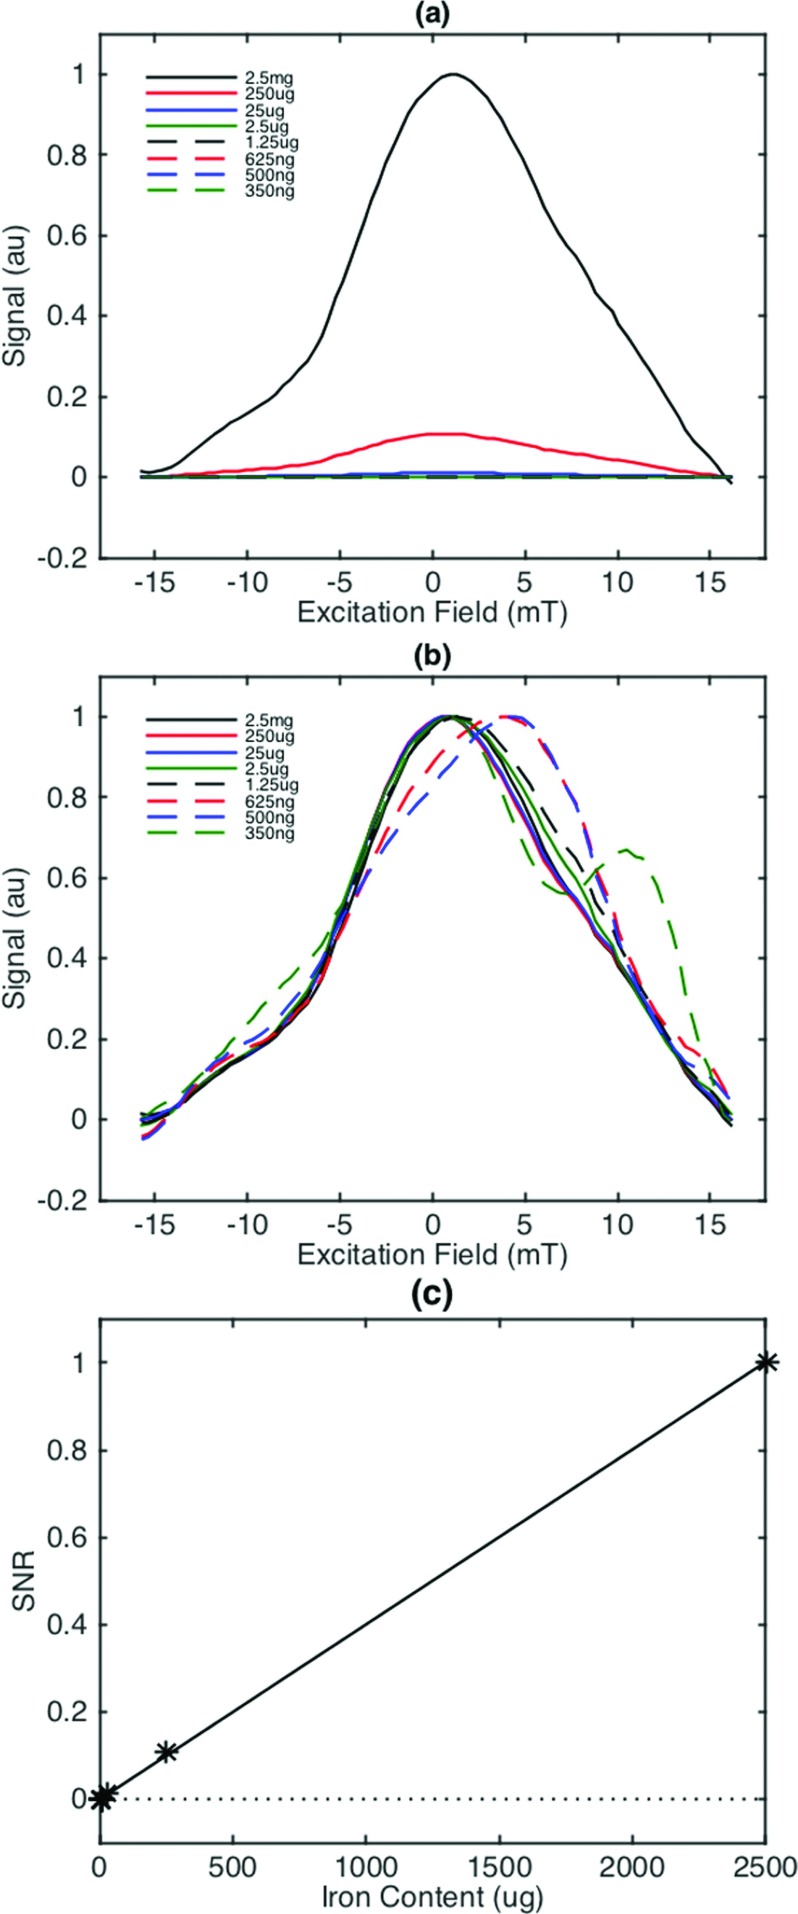
A chief characteristic of the relaxometer is its sensitivity to iron. At SNR = 1, the relaxometer is able to detect ∼350 ng iron. Figure 6(a) shows the PSF from several concentrations of Chemicell 50 nm particles while Figure 6(b) shows their normalized PSFs. PSF shape and FWHM are preserved, and the signal is linear with iron concentration, as expected (Figure 6(c)).
FIG. 6.
(a) PSF from several dilutions of Chemicell 50 nm fluidMag nanoparticles. (b) PSFs normalized to each sample’s peak value show that PSF shape is fairly well preserved, though the detection limit is reached at 350 ng. (c) The MPI signal is linear with respect to iron concentration, as predicted by MPI theory. The noise floor is denoted by the dotted line.
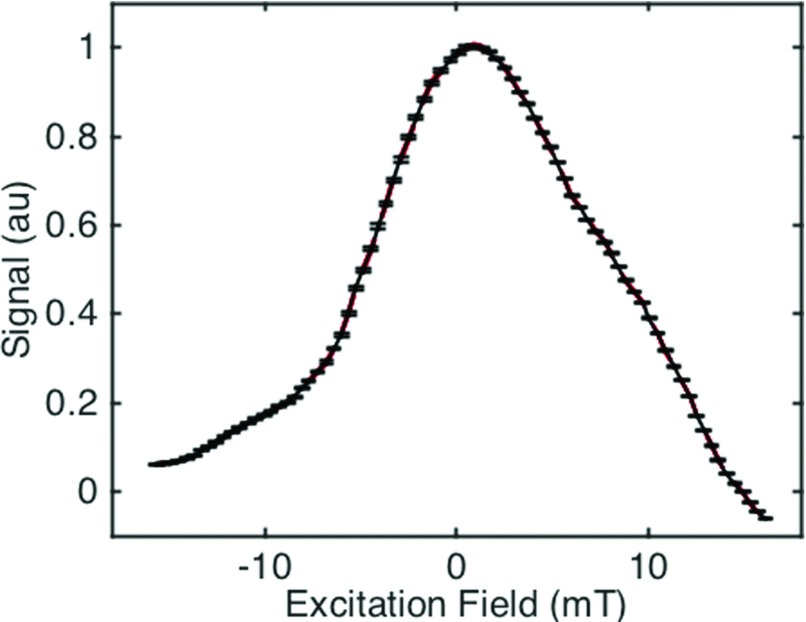
Each concentration is averaged over four repeated tests. Because the error in measuring the PSF is small, the error bars were not included in Figure 6 for ease of viewing. Figure 7 shows a representative example of a PSF with error bars.
FIG. 7.
Representative example of a PSF with error bars measured using a 250 μg sample of Chemicell 50 nm fluidMag nanoparticles. Four individual PSFs (red dashed lines) are plotted against their mean with error bars (black solid line). The error was ±0.002.
B. Example—varying viscosity
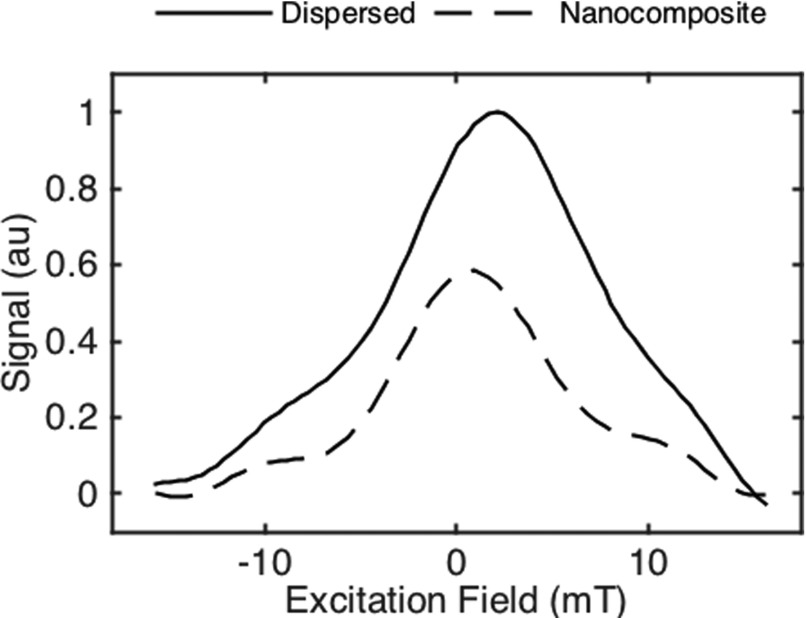
It is of great interest to study the effects of local viscosity on the MPI signal, especially because it can be linked to two of MPI’s key applications (angiography and targeted imaging). Some studies have suggested that whole blood viscosity may be linked to risk factors for cardiovascular disease and atherosclerosis, and that measuring it could provide useful diagnostic information.26,27 Spectroscopic measurements based on measuring Brownian relaxation have already been used to detect nanoparticle binding due to the difference in signal between bound and unbound states.28,29 To demonstrate the effect of changing viscosity of a sample of magnetic nanoparticles, Figure 8 compares the PSFs from 19 nm-diameter magnetite nanoparticle samples dispersed in toluene and embedded in a magnetic nanocomposite film (the mass of magnetic material was held constant). The nanocomposite films were fabricated by mixing nanoparticles with ultrahigh molecular weight polyethylene (UHMWPE) and compressing at high temperature and pressure, forming a thin, flexible film.30 The embedded nanoparticles have inhibited Brownian relaxation, leading to the decrease in PSF amplitude.
FIG. 8.
Comparison of PSFs of magnetite nanoparticles dispersed in toluene and embedded in a magnetic nanocomposite film.
VI. CONCLUSIONS
Development of new tracers for improvements in SNR and resolution is key to the advancement of MPI. At the same time, it is necessary to develop fast, sensitive characterization techniques that fit within the standard workflow of magnetic nanoparticle synthesis to enable more efficient characterization of potential tracers. It is also important that such a technique be accessible to all researchers, so it must not require a dedicated shield room, complicated machining, or costly construction. Further, data acquisition and signal processing should be as simple and fast as possible.
Here we have reviewed the role that magnetic relaxation plays in MPI from the physical basis of relaxation through its impact on the MPI signal. Magnetic particle relaxometry has already demonstrated its utility in characterizing MPI tracers, and in this paper, we have described the design and construction of an eddy current-shielded tabletop relaxometer that is particularly well suited to researchers involved in magnetic nanoparticle synthesis. The relaxometer measures the one-dimensional x-space PSF and is sensitive to ∼350 ng iron at SNR = 1, which is close to the sensitivity of an imaging experiment.7 Total experiment time is on the order of 30 s, allowing high-throughput screening of tracers.
The relaxometer described here was capable of excitation fields up to 20 mT, which is sufficient to saturate the vast majority of magnetic nanoparticle tracers. To measure the particles’ full range of saturation, however, a DC bias field could be added. This would require little additional hardware, but would necessitate employing a more complicated reconstruction scheme, based on partial FOVs.12 For most users, a high-amplitude excitation field alone should be sufficient and has the added benefit of keeping relaxometer construction and signal processing simple. It should be noted that the relaxometer may also be used as a spectrometer. Magnetic particle spectroscopy measures the harmonic response of tracers located in the FFR. As this particular relaxometer does not use a bias field, the entire sample under test is considered to be sitting within the FFR. To use the relaxometer as a spectrometer, one could acquire then transform the raw, time-dependent signal to the Fourier domain to observe the spectrum instead of proceeding with the usual x-space reconstruction.
While the relaxometer was designed with MPI in mind, it is not limited to tracer characterization but may be useful for other applications in which it is useful to probe the relaxation characteristics of iron oxide particles. Examples include local temperature estimation, measuring degradation of magnetic nanocomposite films, and drug delivery.18,31,32 X-space relaxometry is an excellent method for studying relaxation of magnetic nanoparticles, and the present relaxometer is a powerful tool for researchers interested in applications of magnetic relaxation.
Acknowledgments
The authors would like to thank Dr. Shu F. Situ and Dr. Anna Cristina S. Samia for nanocomposite samples. This work was supported in part by the National Cancer Institute’s Training Program in Cancer Pharmacology 5R25 CA148052 and by Grant No. 1R24MH106053-01 from the National Institutes of Health.
REFERENCES
- 1.Gleich B. and Weizenecker J., Nature 435, 1214 (2005). 10.1038/nature03808 [DOI] [PubMed] [Google Scholar]
- 2.Weizenecker J., Gleich B., Rahmer J., Dahnke H., and Borgert J., Phys. Med. Biol. 54, L1 (2009). 10.1088/0031-9155/54/5/L01 [DOI] [PubMed] [Google Scholar]
- 3.Goodwill P. W. and Conolly S. M., IEEE Trans. Med. Imaging 29, 1851 (2010). 10.1109/TMI.2010.2052284 [DOI] [PubMed] [Google Scholar]
- 4.Goodwill P. W. and Conolly S. M., IEEE Trans. Med. Imaging 30, 1581 (2011). 10.1109/TMI.2011.2125982 [DOI] [PMC free article] [PubMed] [Google Scholar]
- 5.Saritas E. U., Goodwill P. W., Croft L. R., Konkle J. J., Lu K., Zheng B., and Conolly S. M., J. Magn. Reson. 229, 116 (2013). 10.1016/j.jmr.2012.11.029 [DOI] [PMC free article] [PubMed] [Google Scholar]
- 6.Zheng B., Vazin T., Goodwill P. W., Conway A., Verma A., Saritas E. U., Schaffer D., and Conolly S. M., Sci. Rep. 5, 14055 (2015). 10.1038/srep14055 [DOI] [PMC free article] [PubMed] [Google Scholar]
- 7.Goodwill P. W., Lu K., Zheng B., and Conolly S. M., Rev. Sci. Instrum. 83, 033708 (2012). 10.1063/1.3694534 [DOI] [PMC free article] [PubMed] [Google Scholar]
- 8.Goodwill P. W., Konkle J. J., Zheng B., Saritas E. U., and Conolly S. M., IEEE Trans. Med. Imaging 31, 1076 (2012). 10.1109/TMI.2012.2185247 [DOI] [PMC free article] [PubMed] [Google Scholar]
- 9.Konkle J. J., Goodwill P. W., Carrasco-Zevallos O. M., and Conolly S. M., IEEE Trans. Med. Imaging 32, 338 (2013). 10.1109/TMI.2012.2227121 [DOI] [PMC free article] [PubMed] [Google Scholar]
- 10.Arami H., Khandhar A. P., Tomitaka A., Yu E., Goodwill P. W., Conolly S. M., and Krishnan K. M., Biomaterials 52, 251 (2015). 10.1016/j.biomaterials.2015.02.040 [DOI] [PMC free article] [PubMed] [Google Scholar]
- 11.Ferguson R. M., Khandhar A. P., Kemp S. J., Arami H., Saritas E. U., Croft L. R., Konkle J., Goodwill P. W., Halkola A., Rahmer J., Borgert J., Conolly S. M., and Krishnan K. M., IEEE Trans. Med. Imaging 34, 1077 (2015). 10.1109/TMI.2014.2375065 [DOI] [PMC free article] [PubMed] [Google Scholar]
- 12.Lu K., Goodwill P., Saritas E., Zheng B., and Conolly S., IEEE Trans. Med. Imaging 32, 1 (2013). 10.1109/TMI.2012.2236349 [DOI] [PMC free article] [PubMed] [Google Scholar]
- 13.Rahmer J., Weizenecker J., Gleich B., and Borgert J., BMC Med. Imaging 9, 4 (2009). 10.1186/1471-2342-9-4 [DOI] [PMC free article] [PubMed] [Google Scholar]
- 14.Rahmer J., Weizenecker J., Gleich B., and Borgert J., IEEE Trans. Med. Imaging 31, 1289 (2012). 10.1109/TMI.2012.2188639 [DOI] [PubMed] [Google Scholar]
- 15.Knopp T., Rahmer J., Sattel T. F., Biederer S., Weizenecker J., Gleich B., Borgert J., and Buzug T. M., Phys. Med. Biol. 55, 1577 (2010). 10.1088/0031-9155/55/6/003 [DOI] [PubMed] [Google Scholar]
- 16.Ferguson R. M., Khandhar A. P., and Krishnan K. M., J. Appl. Phys. 111, 07B318 (2012). 10.1063/1.3676053 [DOI] [PMC free article] [PubMed] [Google Scholar]
- 17.Goodwill P. W., Saritas E. U., Croft L. R., Kim T. N., Krishnan K. M., Schaffer D. V., and Conolly S. M., Adv. Mater. 24, 3870 (2012). 10.1002/adma.201200221 [DOI] [PubMed] [Google Scholar]
- 18.Bauer L. M., Situ S. F., Griswold M. A., and Samia A. C. S., J. Phys. Chem. Lett. 6, 2509 (2015). 10.1021/acs.jpclett.5b00610 [DOI] [PubMed] [Google Scholar]
- 19.Biederer S., Knopp T., Sattel T. F., Lüdtke-Buzug K., Gleich B., Weizenecker J., Borgert J., and Buzug T. M., J. Phys. D: Appl. Phys. 42, 205007 (2009). 10.1088/0022-3727/42/20/205007 [DOI] [PubMed] [Google Scholar]
- 20.Goodwill P. W., Tamrazian A., Croft L. R., Lu C. D., Johnson E. M., Pidaparthi R., Ferguson R. M., Khandhar A. P., Krishnan K. M., and Conolly S. M., Appl. Phys. Lett. 98, 22 (2011). 10.1063/1.3604009 [DOI] [Google Scholar]
- 21.Croft L. R., Goodwill P. W., and Conolly S. M., IEEE Trans. Med. Imaging 31, 2335 (2012). 10.1109/TMI.2012.2217979 [DOI] [PMC free article] [PubMed] [Google Scholar]
- 22.W. F. Brown, Jr., Phys. Rev. 130, 1677 (1963). 10.1103/PhysRev.130.1677 [DOI] [Google Scholar]
- 23.Shliomis M. I., Sov. Phys. Usp. 221, 427 (1974). 10.3367/UFNr.0112.197403b.0427 [DOI] [Google Scholar]
- 24.Deissler R. J., Wu Y., and Martens M. A., Med. Phys. 41, 012301 (2014). 10.1118/1.4837216 [DOI] [PubMed] [Google Scholar]
- 25.Zheng B., Goodwill P., Yang W., and Conolly S., in Magnetic Particle Imaging: A Novel SPIO Nanoparticle Imaging Technology, 140th ed., edited by Buzug T. M. and Borgert J. (Springer-Verlag, Berlin, Heidelberg, 2012), pp. 319–324. [Google Scholar]
- 26.Jeong S.-K., Cho Y. I., Duey M., and Rosenson R. S., Cardiovasc. Drugs Ther. 24, 151 (2010). 10.1007/s10557-010-6239-7 [DOI] [PubMed] [Google Scholar]
- 27.Pop G. A. M., Duncker D. J., Gardien M., Vranckx P., Versluis S., Hasan D., and Slager C. J., Neth. Heart J. 10, 512 (2002). [PMC free article] [PubMed] [Google Scholar]
- 28.Rauwerdink A. M. and Weaver J. B., Appl. Phys. Lett. 96, 10 (2010). 10.1063/1.3291063 [DOI] [Google Scholar]
- 29.Tu L., Jing Y., Li Y., and Wang J., Appl. Phys. Lett. 98, 213702 (2011). 10.1063/1.3595273 [DOI] [Google Scholar]
- 30.Pablico-Lansigan M. H., Situ S. F., and Samia A. C. S., Nanoscale 5, 4040 (2013). 10.1039/c3nr00544e [DOI] [PubMed] [Google Scholar]
- 31.Peiris P. M., Bauer L., Toy R., Tran E., Pansky J., Doolittle E., Schmidt E., Hayden E., Mayer A., Keri R. A., Griswold M. A., and Karathanasis E., ACS Nano 6, 4157 (2012). 10.1021/nn300652p [DOI] [PMC free article] [PubMed] [Google Scholar]
- 32.Weaver J. B., Rauwerdink A. M., and Hansen E. W., Med. Phys. 36, 1822 (2009). 10.1118/1.3106342 [DOI] [PMC free article] [PubMed] [Google Scholar]


