Abstract
Complete surgical resection is the first-line treatment for most liver malignancies. This goal would be facilitated by an intraoperative imaging method that enables more precise visualization of tumor margins, and detection of otherwise invisible microscopic lesions. To this end, we synthesized silica-encapsulated surface-enhanced Raman scattering (SERS) nanoparticles (NPs) that act as a molecular imaging agent for liver malignancies. We hypothesized that, after intravenous administration, SERS NPs would avidly home to healthy liver tissue, but not to intrahepatic malignancies. We tested these SERS NPs in genetically engineered mouse models of hepatocellular carcinoma and histiocytic sarcoma. After intravenous injection, liver tumors in both models were readily identifiable with Raman imaging. In addition, Raman imaging using SERS NPs enabled detection of microscopic lesions in liver and spleen. We compared the performance of SERS NPs to fluorescence imaging using Indocyanine Green (ICG). We found that SERS NPs delineate tumors more accurately and are less susceptible to photobleaching. Given the known advantages of SERS imaging, namely high sensitivity and specific spectroscopic detection, these findings hold promise for improved resection of liver cancer.
Keywords: Surface-enhanced Raman scattering (SERS), nanoparticles, hepatocellular carcinoma, sarcoma, intraoperative imaging, image-guided tumor resection
Graphical Abstract
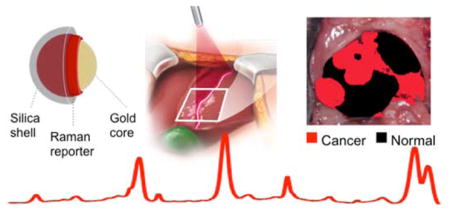
For most solid malignancies, including those affecting the liver, surgery remains the first line of therapy and is often the only curative treatment option. The ability to visualize the full extent of the tumor during the operation, including regional metastatic spread and microscopic lesions, has major implications for the therapeutic outcome. However, such lesions are often too small to visualize with conventional imaging methods. The delineation of the full extent of tumor invasion is invaluable for achieving maximal tumor resection while also preserving as much healthy tissue as possible. With a recent surge in laparoscopic and robotically-assisted tumor resections,1 the accurate detection of tumor spread is becoming even more important. This is because one of the major weaknesses of such minimally invasive procedures is the limited ability of the surgeon to visualize the organ of interest.2
Currently, magnetic resonance imaging (MRI), computed tomography (CT), positron-emission tomography (PET), and ultrasound are the modalities that are used most frequently to detect and characterize liver tumors.3 MRI is generally more sensitive and can provide more complete characterization of liver lesions than CT. While MRI is well suited for preoperative planning, it has not found widespread use for intraoperative surgical guidance due to its high cost, large footprint, relatively long imaging times, and issues with false positive contrast enhancement. The use of intraoperative MRI in the abdomen would be especially difficult because breathing motion can compromise image quality. PET suffers from other limitations, such as the high uptake of 18F-fluorodeoxyglucose (18F-FDG) in normal liver tissue, its limited spatial resolution, and the drawback of exposure to ionizing radiation.4–6 Ultrasound is the modality that is currently used most frequently for metastatic survey of the liver in the operating room.7–8 However, ultrasound has limited sensitivity and signal specificity, resulting in the difficulty of distinguishing cancer from normal tissue and inability to visualize microscopic disease.8, 9 Therefore, there is a large unmet need for new imaging technologies that allow accurate intraoperative assessment of liver neoplasms.2, 10, 11
In this study, we have explored the ability of surface-enhanced Raman scattering (SERS) nanoparticles (NPs)12 as a molecular imaging modality for liver cancer detection and delineation. Although an optical imaging technique, SERS imaging is fundamentally different from fluorescence imaging. It is an emerging optical spectroscopic technique that is gaining interest in the biomedical community because of its very high sensitivity and signal specificity (Raman molecular “fingerprint”).13–18 By adsorbing a reporter molecule with a specific Raman signature on a gold or silver nanoparticle surface, SERS NPs can be created through which the amplitude of the Raman spectrum of that molecule is massively amplified. SERS imaging has several key advantages over fluorescence imaging, such as higher sensitivity, unequivocal detection without issues of autofluorescence, and photostability.19–20 Therefore, SERS imaging could represent an ideal intraoperative method complementary to the whole-body imaging capabilities of MRI and PET, especially in applications where high precision tumor margin delineation is essential.15, 21–23
In previous reports, superparamagnetic iron oxide nanoparticles (SPIONs) were shown to aid in detecting cancerous tissues in organs of the reticuloendothelial system (RES), when used as a contrast agent for MRI.6, 24, 25 We hypothesized that SERS NPs, despite their different size and surface chemistry, would exhibit a similar behavior as SPIONs, and thus result in image contrast that could be used to guide intraoperative detection and surgical resection of liver tumors. We tested whether SERS NPs enable the intraoperative delineation of liver tumors and compared the accuracy to an already established optical imaging technique, i.e. fluorescence imaging using indocyanine green (ICG).
RESULTS
Nanoparticle Characterization
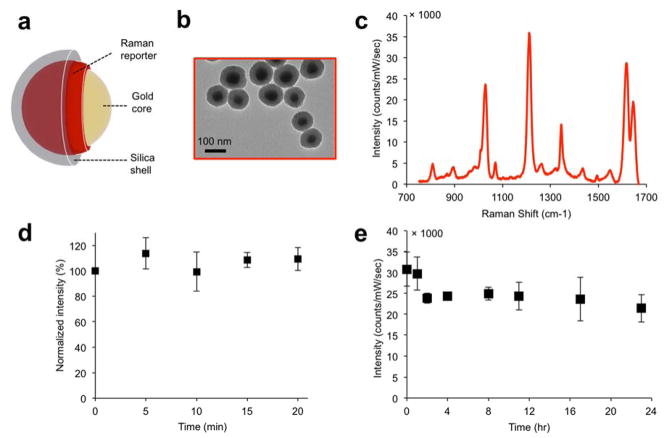
The SERS NPs were synthesized and characterized as described in the methods section and reported in previous studies.19, 20 They consist of a gold core, coated with a Raman reporter molecule, and encapsulated in a silica shell, shown schematically in Figure 1a. As characterized with transmission electron microscopy (TEM) (Figure 1b), the nanoparticle gold cores were found to be 58±11 nm in diameter, and the final nanoparticle size (including the silica shell) 108±11 nm. The SERS NPs produced distinct spectra based on the Raman reporter dye (Figure 1c). Dynamic light scattering of the NPs (Supporting Information Figure S1a) gave a polydispersity index of 0.156, and the zeta potential in buffer (pH 7.1) was measured as ζ=− 46.9±1.2 mV.
Figure 1. SERS NP characterization.
(a) Illustration and (b) transmission electron micrographs of the SERS NPs. (c) the SERS spectrum of the NPs depends on the Raman reporter molecule used (here, trans-1,2-bis(4-pyridyl)-ethylene (BPE)). (d) Signal stability (based on the intensity of the 1215 cm−1 band) of SERS NPs suspension under continuous laser irradiation (785 nm; 50 mW/cm2). (e) Signal stability of SERS NPs incubated in 50% mouse serum (v/v) over a 24 hour period.
We then assessed the photo- and serum stability of the SERS NPs, as described in the Methods section. The SERS intensity was measured intermittently while exposing them to continuous laser illumination, and, as shown in Figure 1d, no significant change in signal intensity was observed. Serum stability was assessed by incubation in 50% mouse serum (v/v) for 24 hours at 37 °C. Although an initial decrease in SERS signal intensity was observed, the signal then remained stable (Figure 1e). A similar pattern was observed when monitoring stability in serum by UV-Vis absorption spectroscopy: the absorption peak initially decreased, and then stabilized after around 4 hours. The particle instability parameter,26 a metric of colloidal stability, remained under the critical threshold of 0.1, signifying that the suspension stabilized after 4 hours (Supporting Information Figure S1 b, c).
Nanoparticle Uptake and Biodistribution
After intravenous administration, nanoparticles are typically rapidly cleared from the circulation by the RES, in particular via uptake by hepatic Kupffer cells.27 The SERS NPs used in this study featured a bare silica shell, with no surface modifications after synthesis that may prevent or delay RES uptake (such as PEG or other moieties). The silica shell not only prevents nanoparticle aggregation, but also serves as an insulation layer that ensures that only the Raman reporter is in direct contact with the gold surface. This is important to prevent the unintended SERS amplification of surrounding biomolecules in vivo.
We first tested the SERS NPs in vivo in mice without tumors. Wild type mice (C57BL/6, n=3) were injected with a bolus of SERS NPs, and sacrificed 12 hours later. Livers and spleens were excised and imaged with an InVia Raman imaging system (details in Methods section, under “Raman Imaging”). The organs demonstrated the characteristic Raman signature of the SERS NPs. The SERS signal intensity appeared spatially homogeneous in the tissue, as shown in Supporting information Figure S2 (middle), with signal-to-noise ratios of > 5. These data confirmed our hypothesis that the RES would avidly take up our SERS NPs, similar to what has been reported regarding SPIONs. 28–30
A direct classical least squares (DCLS) model was developed to help visualize the presence of the Raman signature of the SERS NPs (details in the Methods section). Pixels in which the reference spectrum was detected were assigned the color black (Supporting information Figure S2 (right)). This color scheme was used for all DCLS-derived images: black indicating normal liver tissue, red indicating cancer, and white/transparent indicating background (non-cancer, non-RES tissue).
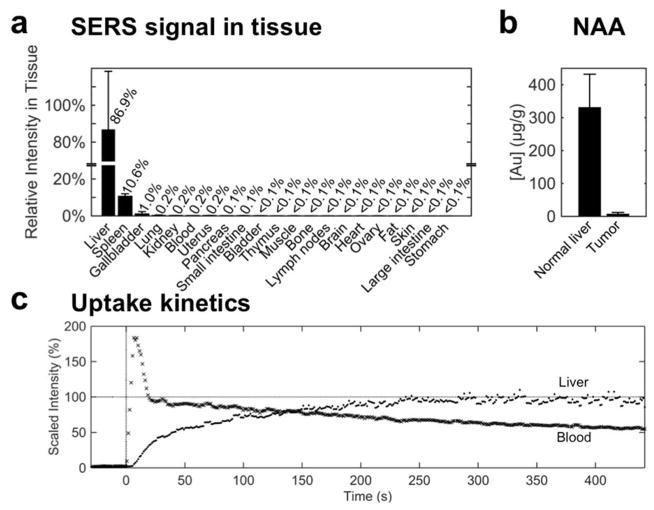
The SERS signal intensity was measured in phantoms generated from homogenates of various tissues in order to provide a semi-quantitative biodistribution of the SERS NPs. The SERS signal was found to be highest in the liver, followed by the spleen and the gallbladder. In fact, these three organs accounted for almost 99% of the signal intensity, with all other tissues exhibiting negligible signal (Figure 2a).
Figure 2. Biodistribution and uptake of SERS NPs.
(a) Signal intensity of spectra collected from tissue homogenates of healthy mice (C57BL/6, n=2), 18 hours after IV administration of SERS NPs. After adjusting for tissue weight, 99% of the SERS signal—signifying the presence of SERS NPs—was detected in the liver, spleen, and gallbladder. (b) Neutron activation analysis of liver vs. tumor tissue from the Myc-driven HCC mouse model (n=3) quantifies the gold content (core of the SERS NPs). This corroborates that the SERS NPs home predominantly into healthy liver tissue, and much less into tumor tissue. (c) Uptake kinetics of SERS NPs were established by monitoring the Raman intensity over time in the liver (·) and the abdominal aorta (x) beginning with a SERS NP bolus injection at t=0 s. The signal intensity (of the characteristic 960 cm−1 peak) is plotted, normalized by the final intensity in the liver. The SERS NPs are taken up by the liver with a time constant τ=77 s.
We next verified the presence of SERS NPs in liver vs. tumor tissue in a Myc-driven hepatocellular carcinoma (HCC) mouse model (see Methods), with two independent methods: TEM and elemental analysis of gold content using neutron activation analysis (NAA). TEM analysis demonstrated many clusters of nanoparticles in the normal liver (Supporting Information Figure S3). By surveying an area of 0.56 mm2, 34 such foci were observed. In addition to the clustered foci, 77 isolated nanoparticles were also found, most of them in proximity to a cluster. When a similar area of tumor tissue was surveyed (1.2 mm2), nanoparticles were only found in one single frame (data not shown). In order to better quantify the accumulation of the SERS NPs in liver and tumor tissues, we performed NAA in the same HCC mouse model (n = 3 samples each), which enables direct quantification of the gold of the SERS NP cores (Figure 2b). This showed a gold content for normal liver tissue of 332±99 μg/g, and of 8±4 μg/g in tumor tissue, thus corroborating the TEM observations.
To measure the kinetics of SERS NP uptake into the liver, we performed two in vivo experiments monitoring the Raman signal in the liver and in the blood of a mouse after the injection of a bolus of SERS NPs via tail vein as described in the Methods (under Real-time kinetics of SERS NP extraction from the vasculature and intrahepatic uptake). The Raman signal in the liver reached a plateau within four minutes, with a time constant of approximately 77 s (Figure 2c). In the blood, the signal reached a maximum intensity immediately after the SERS NP injection, and decreased steadily as the particles were sequestered from the circulation (Figure 2c). The circulation half-life was determined as approximately 10 minutes.
In Vivo Imaging of Liver Tumors
Since the SERS NPs resulted in homogeneous signal throughout normal livers and spleens, we reasoned that SERS NPs could enable intraoperative delineation of tumors with SERS imaging. This hypothesis was based on the well-established observation that the cells in healthy RES tissues demonstrate a high phagocytic activity, which is markedly decreased when normal RES tissue is displaced by tumor tissue. We evaluated the ability of our SERS NPs to detect cancerous lesions based on this principle in two mouse models in vivo: a Myc-driven model, and the Ink4A/Arf−/− model. The Myc-driven model produces hepatocellular carcinomas (HCCs), while the Ink4A/Arf−/− model is known to spontaneously develop histiocytic sarcomas, soft tissue sarcomas, and lymphomas31–33 (histiocytic sarcomas in our case as confirmed by histopathology). Both are genetic models that develop tumors spontaneously and mimic human tumors more closely than models based on injection of tumor cells. More information about the animal models, as well as the imaging procedures, is provided in the Methods section.
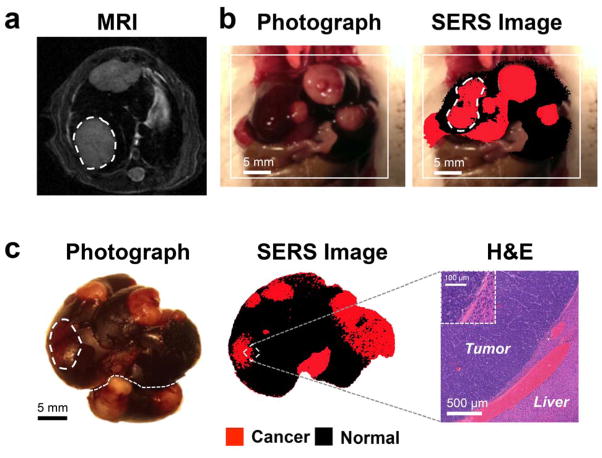
In vivo Raman scans were performed in order to establish the efficacy of the SERS NPs as a contrast-enhancing agent for liver tumor delineation. Myc-driven HCC bearing mice (n=6) (tumor presence confirmed by MRI, Figure 3a) were injected with a bolus of SERS NPs 12–18 hours prior to imaging. To simulate an intraoperative imaging scenario, the livers of the mice were surgically exposed under general anesthesia, followed by acquisition of Raman maps (Figure 3b).
Figure 3. SERS NPs enable delineation of liver tumors (Genetic Myc-driven HCC mouse model).
(a) T2-weighted axial MR images through the liver show hyperintense lesions corresponding to the tumors (one of them is outlined with a dashed line). (b) Photograph and in vivo SERS image (overlaid) shows the liver with several tumors in red (outlined tumor corresponds in location to the tumor outlined on MRI). (c) Photograph and corresponding SERS image of the excised liver, showing multiple liver tumors (red). Histology with H&E staining confirms the precise delineation of the liver tumor margin by SERS imaging. Inset: Magnified view of the tumor-liver margin. SERS images were produced using DCLS, as described in Methods.
Subsequently, livers were excised and correlative white light and SERS images acquired (Figure 3c). This showed a high congruency between the tumors visible with white light and with SERS, whereas some abnormalities visualized by SERS could not be detected with white light. Histological confirmation showed that SERS imaging precisely delineated the tumor margins (Figure 3c).
Subsequently, we aimed at validating this SERS imaging technique in a second mouse model to test if it could also detect microscopic tumors. For this purpose, we chose the genetic Ink4A/Arf−/− model, which spontaneously develops histiocytic sarcomas, soft tissue sarcomas, and lymphomas. 31–33 The tumors in the liver and spleen in our model were confirmed to represent histiocytic sarcomas by pathological examination. As development of liver tumors is rare, we only had one animal (n=1) available during the course of the study. The results thus serve only as a proof-of-principle of how well the technique performs with spontaneously developing microscopic lesions. Figure 4a depicts a hyperintense lesion (arrowhead) in the liver on a T2-weighted MRI of the liver. After the MRI, the mouse was injected with SERS NPs, and after about 14 hours the liver excised. White light imaging demonstrated an abnormal gray lesion corresponding to the abnormality on MRI (Figure 4b). SERS imaging demonstrated a corresponding abnormality in nanoparticle accumulation (Figure 4c). Of note, SERS imaging showed innumerable additional microscopic abnormalities (Figure 4c), which were not visible with either MRI or white light illumination. These were confirmed to represent cancerous foci by histology (Figure 4d). SERS NPs were also shown to detect microscopic histiosarcomas in the spleen (Figure 5).
Figure 4. SERS NPs enable detection of microscopic liver tumors (Histiosarcomas; genetic Ink4A/Arf−/− mouse model)w.
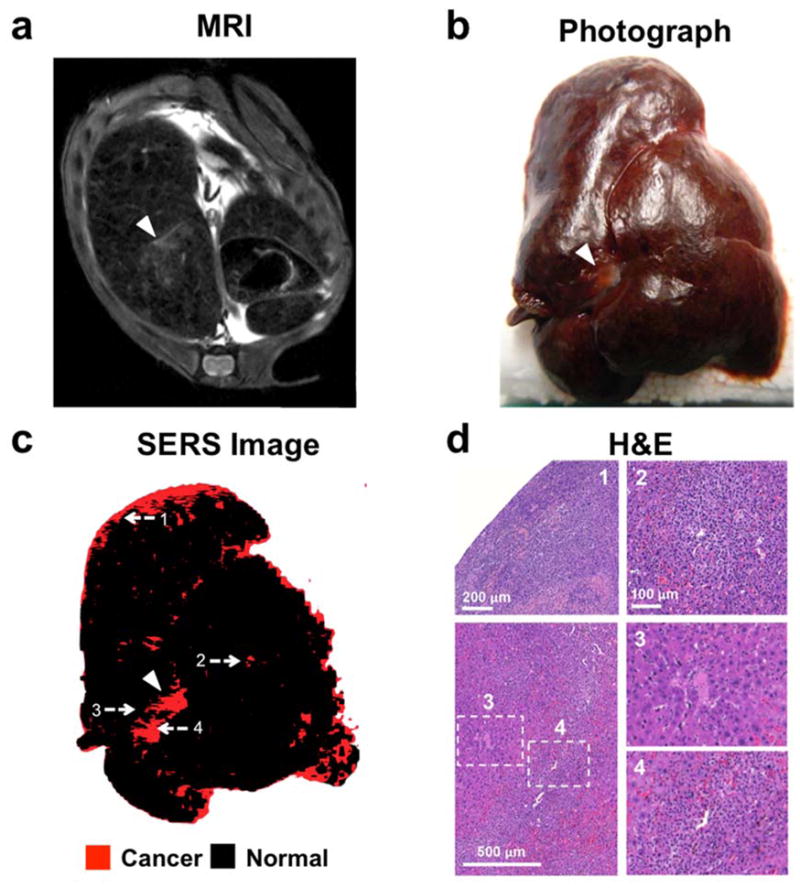
(a) T2-weighted axial fast spin echo MR image through the liver shows several foci that are T2-hyperintense relative to the T2-hypointense liver background (largest focus indicated with arrowhead). (b) Photograph of the excised liver, showing a focus of abnormal gray color (arrowhead), corresponding to the T2-hyperintense focus identified by MRI. (c) SERS image of the excised liver, demonstrating a focus of abnormal Raman signal (arrowhead) corresponding in location to the abnormality on MRI and the photograph. Many additional smaller Raman foci (red) are present, which were not visible by MRI or upon visual inspection. (d) H&E images correlating to the numbered locations on the SERS image confirm that SERS NPs were able to correctly identify very small cancerous lesions (as in examples 1, 2 and 4) and correctly distinguish them from adjacent healthy liver tissue (example 3). SERS images were produced using DCLS, as described in Methods.
Figure 5. SERS NPs enable detection of small tumors in the spleen. (Histiosarcomas; genetic Ink4A/Arf−/− mouse model).
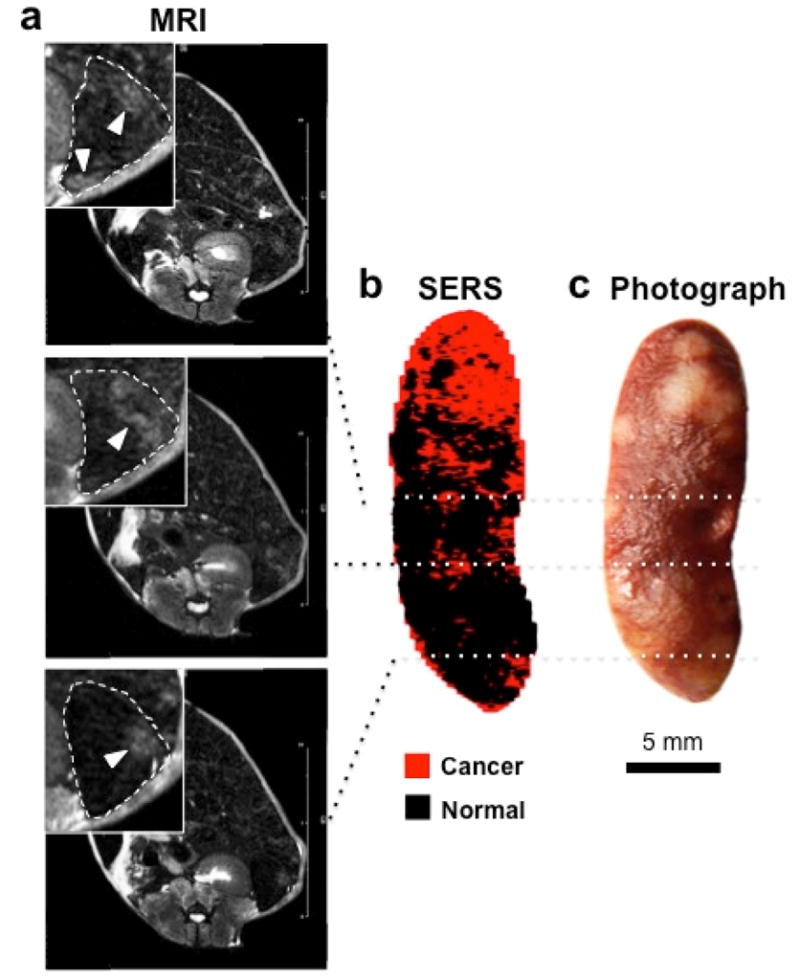
(a) T2-weighted axial fast spin echo MR images at different levels through the spleen show several lesions that are T2-hyperintense relative to the rest of the spleen. Insets are magnified views outlined by dashed boxes (dashed lines: outline of the spleen; arrowheads: T2-hyperintense lesions). (b) DCLS-derived SERS image of the excised spleen shows foci of abnormal Raman signal (red) that correspond to the T2-hyperintense foci on MRI. (c) White light photograph corroborated the presence of tumors (bright lesions) in these locations. SERS images were produced using DCLS, as described in Methods.
Comparison of SERS NPs with ICG as an Established Fluorescence Method
Fluorescence imaging using ICG as a contrast agent is an established method for a variety of medical and experimental procedures, and recently its use for liver tumors has been explored preclinically and clinically.1, 2, 11, 34, 35 In order to assess if SERS NPs might have advantages over this established technique, we performed direct in vitro and in vivo comparisons.
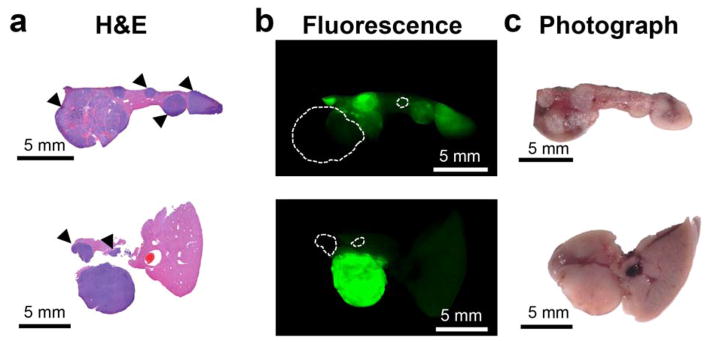
To determine the efficacy of ICG in delineating liver tumors, we performed fluorescence imaging in situ, and ex vivo, using an infrared fluorescence imager (see Methods). The results showed that most of the HCC tumors were made visible by ICG. However, different tumors retained different amounts of the dye, and as such, had different intensities. Furthermore, the normal liver parenchyma also demonstrated a substantial amount of background fluorescence. Selected slices from livers of two different animals are shown in Figure 6, where the H&E stained slice (column a) is compared to the fluorescence image (column b). Although most tumors are visible in the fluorescence image, they demonstrate different intensities, and thus different contrast versus normal tissue. The tumors that are clearly visible have tumor-to-background (normal liver) ratios (TBRs) in the 6–12 fold range. Tumors exhibiting contrast less than two-fold over normal tissue are marked with arrowheads.
Figure 6. Histopatological validation of the ability of ICG to demarkate tumors. ICG fails to visualize certain tumors.
(a) H&E-stained liver slices from two animals (genetic Myc-driven HCC mouse model) are shown. (b) Although most tumors retain ICG fluorescence in higher concentrations than normal liver tissue, the accumulation is heterogenous. Tumors marked with arrowheads in (a) present intensities less than two-fold over the healthy tissue, which would likely be problematic to detect with certainty in a clinical setting. Dashed circles in b indicate those tumors that are completely missed as they are essentially invisible on the ICG fluorescence image. (c) Photograph of the section prior to embedding.
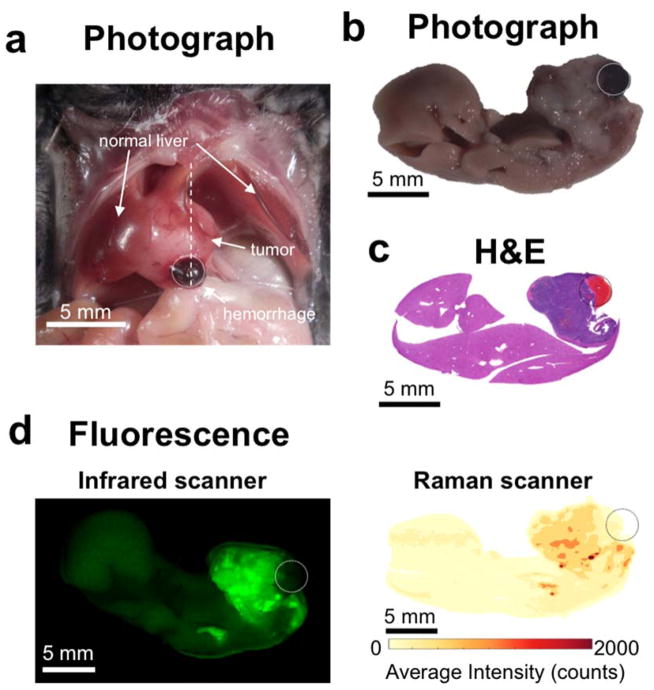
In the third animal, we observed that the tumor presented with a tumor-associated hemorrhage (circle in Figure 7a). The liver was excised and fixed, and a slice was cut through the hematoma (Figure 7b), along the dotted line shwon in Figure 7a. The tumor, along with the hematoma, was confirmed histologically (Figure 7c). The slice was imaged with the infrared fluorescence scanner, which showed that no detectable dye was present within the hematoma (Figure 7d, left). Finally, we performed additional scans of the slice with the InVia Raman imaging system (Figure 7d, right). The goal of this comparison was to determine whether the results of the infrared fluorescence scanner could be compared with the ones from the InVia Raman scanner. The Raman scan of this slice faithfully recapitulates the image acquired by the infrared fluorescence scanner.
Figure 7. ICG misses area of tumor-associated hemorrhage.
(a) Photograph of the exposed mouse abdomen, showing a large tumor with an associated hematoma (circled). (b) Photograph, and (c) H&E staining of the excised liver, sliced along the dotted line in (a). (d) Left: scan with the infrared fluorescence scanner demonstrates that ICG can visualize the tumor, but not the hemorrhage. Right: in the absence of SERS NPs, the Raman spectrometer faithfully captures the fluorescence of ICG. The average intensity across all wavenumbers is plotted.
In order to directly compare the efficacies of SERS NPs and ICG in delineating liver tumors in the same mice, we next injected both contrast agents (ICG and SERS NPs19) into HCC bearing mice (genetic Myc-driven model, n=2) and then imaged the animals using both the infrared fluorescence scanner and the Raman microscope.
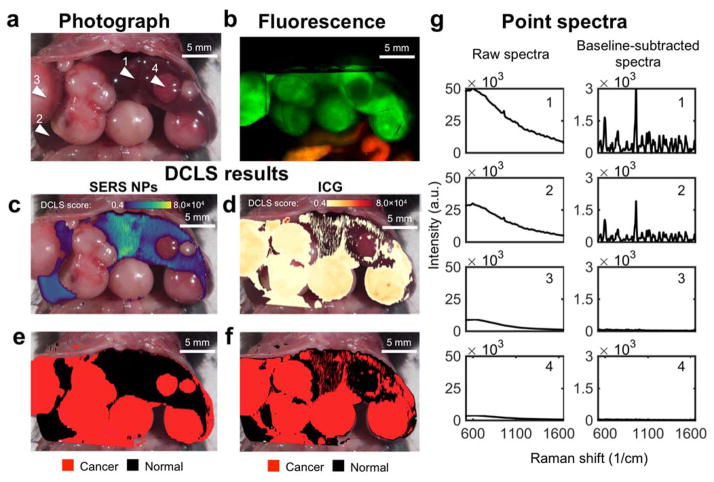
The first mouse was imaged with the fluorescence scanner first, and then with the Raman microscope. Prior to imaging, the animal was euthanized and its abdomen was surgically exposed. The liver presented with multiple HCCs, as shown in Figure 8a. The fluorescence scan, shown in Figure 8b, verified that tumors had taken up the fluorescent dye, although not all tumors showed the same intensity. The normal liver tissue also demonstrated fluorescence, with a much higher intensity than the liver of animals administered ICG alone. This fluorescence in fact emanated from the SERS NPs, which in addition to their SERS signal also emit fluorescence.
Figure 8. Comparison of SERS NPs vs. ICG after co-injection of both contrast agents into the same HCC bearing mice.
(a) Photograph of the exposed abdomen, showing multiple HCCs. Arrowhead 1 and 2 = normal liver; arrowhead 3 and 4 = HCC. (b) In situ fluorescence scan. (c, d) DCLS analysis identifies the presence of SERS signal from the NPs (c), and the fluorescence from ICG (d). (e) Areas identified as positive for SERS NPs are denoted as normal liver (black). Areas of low intensity (no SERS nor fluorescence) are rendered transparent, and the remaining areas are denoted as tumor (red). (f) The areas identified as positive for ICG are denoted as cancer (red), and as in (e) the remaining areas are denoted as normal. (g) Representative spectra collected from points 1–4 indicated in (a). The raw spectra (left) are dominated by the fluorescence, whereas, after baseline subtraction (right), the Raman bands become prominent. Points 1 and 2 are from normal liver tissue, 3 and 4 from tumor. ICG falsely identifies a tumor (arrowhead 4) as normal liver tissue.
After the fluorescence scan, the animal was imaged using the Raman microscope. The same protocol for imaging was followed as with the scans performed previously with SERS NPs only. The acquired Raman image was analyzed using DCLS, with the spectra of SERS NPs and ICG as references. The reference spectra were normalized in such a way that the scores produced by the model correspond approximately to photon counts acquired by the spectrometer (see methods, and Supporting Information Figure S5). DCLS scores on the reference spectra were evaluated for every point scanned. The DCLS scores of each point are shown in Figures 8c and 8d, for SERS NPs and ICG, respectively. An arbitrary threshold of score > 4 × 10³ was selected for both components, and used to create the DCLS maps shown in Figure 8e and 8f, with healthy liver marked in black, and tumor in red, as per our convention.
The SERS signal map, shown in Figure 8e, clearly distinguishes normal liver parenchyma from the tumors. On the other hand, the map derived from the ICG fluorescence is noisy, with many false positive areas marked in red. This is due to the arbitrary threshold we selected (4,000 counts), which is low for this specific example, and is thus susceptible to noise. The receiver operating characteristic curve (Figure S6) suggests that the ICG data could be illustrated using a higher threshold, to minimize noise. The reason we selected this low threshold is to illustrate beyond any doubt that at least one of the tumors (arrow 4 in Figure 8a) is completely missed by the ICG fluorescence, even with this low threshold, producing a false negative result. Additionally, ICG signal was detected in the intestine. Unlike the previous scans where the intestines exhibited low levels of autofluorescence (see Figure S4), and could programmatically be excluded, here we observed a large fluorescent signal emanating from ICG after biliary clearance.
In order to further demonstrate the differences between the SERS NPs and ICG as contrast agents, independently from the DCLS method, we examined the spectra collected from four areas, marked by arrowheads in Figure 8a. The spectra are shown in Figure 8g, with the raw spectra on the left side, and the same spectra after baseline subtraction on the right. Points collected from areas with normal liver tissue (points 1 and 2) may have different intensities (area under the curve), but after baseline subtraction (right column) the Raman signature of our SERS NPs becomes the unequivocal marker of normal liver tissue. Spectra collected from tumors, namely points 3 and 4, show variable fluorescence intensity. Point 3 has a peak intensity of about 10,000 counts, whereas point 4 has less than 4,000 counts. These characteristics are correctly interpreted by our DCLS model, which uses the raw spectra, without baseline subtraction.
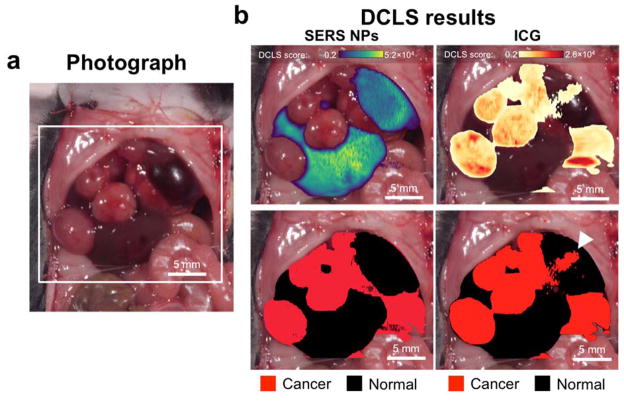
For the second mouse, we performed an in vivo scan using the Raman microscope first, following the same procedure as in previous scans. The area interrogated is shown in Figure 9a. The same DCLS model as before was used to produce two maps, again stemming from the SERS NPs and the ICG (Figure 9b). A threshold score of 2,000 was selected in this case. Again, SERS NPs present clear margins of the normal liver morphology. ICG performed better than in the last example, but not as well as the SERS NPs, as an area of false positive signal was present, marked by the arrowhead (Figure 9b).
Figure 9. Comparison of SERS NPs vs. ICG as contrast agents in vivo.
(a) Photograph of the exposed mouse abdomen, showing multiple HCCs. (b) The signal from the two contrast agents is decoupled using DCLS. The scores on the SERS spectrum of the NPs and the fluorescent dye are shown on the top (left and right, respectively). The scores are used as masks to generate maps identifying tumors (bottom). The two contrast agents have similar performance when demarcating the tumors. However, the ICG exhibits a false positive area indicated by the arrowhead.
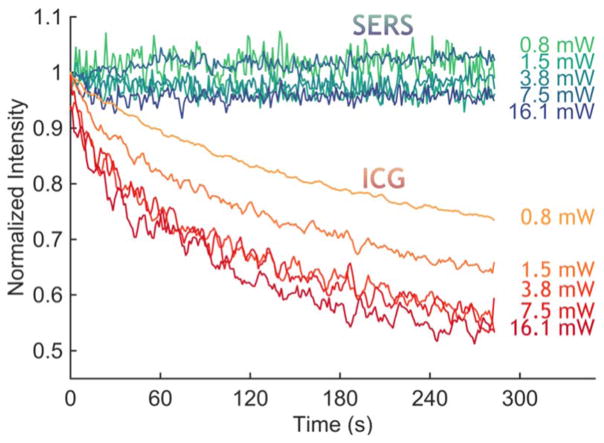
A major requirement for optical imaging is photostability. It is well known that fluorescent dyes undergo photobleaching, which could become problematic under the prolonged exposure needed for complicated procedures such as liver surgeries. We compared the photostability over time of ICG and SERS NPs in excised livers of wild type animals (C57BL/6, Figure 10). The ICG fluorescence in the liver, defined as the area under the curve, invariably showed a decrease in intensity as the laser light bleached the dye. For laser intensities of 3.8 mW and higher, the signal degraded to about 50% of its initial value within 4.5 minutes. On the other hand, the SERS signal, defined as the amplitude of the 1215 cm−1 peak after baseline subtraction, remained stable for the entire time of illumination (4.5 minutes).
Figure 10. Photostability comparsion between ICG and SERS NPs in ex vivo liver tissue.
With continuous illumination, the 785 nm laser bleached the ICG fluorescence signal from an ex vivo liver sample, within minutes for all tested intensities, whereas the SERS signal, measured as the intensity of a specific peak (1215 cm−1), remained stable.
DISCUSSION
This study reports the use of SERS NPs to visualized liver tumors. Our study was based on the hypothesis that our SERS NPs with a bare silica coating would behave similar to SPIONs with regard to sequestration by the liver, despite different chemical composition, diameter, and surface charge. It is well established that clinically used MRI contrast agents based on superparamagnetic iron oxides nanoparticles (SPIONs) accumulate within the healthy organs of the RES such as the liver, spleen, and lymph nodes. On the other hand, tumors located in these organs take up markedly less SPIONs relative to the surrounding healthy liver tissue, a phenomenon that is due to the displacement of the RES cells by the tumors.6, 28–30 RES tissues are rich in phagocytotically active cells, and thus their replacement is expected to decrease nanoparticle uptake. Our data quantifying nanoparticle accumulation via neutron activation analysis (Figure 2b) corroborate this by demonstrating an over 40-fold higher accumulation of SERS NPs in healthy liver parenchyma than in liver tumors.
We report here that gold-silica–based SERS NPs demonstrate a similar behavior in liver and spleen as SPIONs, and, as a consequence, enabled precise discrimination of healthy from cancerous tissues via SERS imaging. Because of this behavior, we found that two different types of liver tumors, including the clinically important HCC, could be delineated intraoperatively with SERS spectroscopic imaging. The SERS signal proved to be particularly sensitive and specific for normal liver parenchyma, outlining microscopic cancerous lesions – as small as approximately 250 μm – that were neither seen with MRI nor with visual inspection or palpation. This has the potential to impact clinical management and course in two major aspects: 1) Achieving tumor-free resection margins would be facilitated, while at the same time sparing of normal liver tissue could be maximized; 2) in case of unexpected abnormal SERS areas intraoperative sampling could be performed. If unexpected additional metastases are found, they could be either selectively excised or surgery could be aborted, thus optimizing patient care.
Silica and gold are considered inert materials, and SERS NPs similar in size and composition as those used in this study have already passed rigorous toxicity studies.36 The silication method used in our nanoparticle synthesis does not require toxic surface primers, but instead uses biologically compatible capping agents, therefore maintaining a non-toxic composition. Because of their characteristic pharmacokinetic behavior and retention in the RES, SERS NPs require only a single intravenous injection for extended intraoperative imaging. While we focused our initial assessment on HCC, we expect this technique to be applicable to the detection of other primary liver tumors as well as liver metastases.
Several fluorescence-based methods based on the dye indocyanine green (ICG) for detection of primary and metastatic liver tumors have recently been reported.2, 10, 11, 34, 35, 37 These methods are based on fundamentally different principles than nanoparticle-based imaging. First, ICG is a small molecule fluorescent dye, and its uptake into liver malignancies is still only partially understood.11 Second, it is known that there is also significant uptake of ICG into normal liver parenchyma,34 which can compromise the TBR. Third, organic fluorescent dyes are in general prone to photobleaching, which could represent a limiting factor in lengthy intraoperative procedures. Other studies have used fluorochromes targeted against a specific receptor overexpressed in tumors, such as for example folate receptor-α. This has shown promising results in human ovarian cancer patients.38 However, similar results have not yet been reported for liver tumors. This is probably due to the difficulty in active targeting of intrahepatic tumors with sufficient TBRs because of the avid accumulation of most contrast agents in the normal liver parenchyma.
We show here that SERS NPs outperform ICG as a contrast agent for HCC delineation. SERS NPs identified every tumor correctly, as corroborated by histopathology, whereas ICG demonstrated cases of false positive and false negative results. This is not surprising when analyzing the data. ICG-based detection is limited by the variable uptake of the dye by tumors, and a TBR that ranges from modest to low (factor of 2 or less for some tumors). For SERS NPs, a difference in accumulation between tumors and normal liver of ~40-fold was measured, which can explain the higher TBRs. In addition to this superior pharmacokinetic behavior, the spectroscopic Raman signature of SERS NPs is unmistakable, which adds to the specificity of the approach. In a real-life scenario in human patients, this specificity could be decreased by other co-existing liver pathologies that also lead to decreased uptake of SERS NPs. However, most of these entities, such as focal benign liver lesions or geographic parenchymal abnormalities such as fibrosis or cirrhosis can be visualized during preoperative MRI and thus be taken into consideration during the operation. Additionally, we demonstrate here that SERS NPs are photostable, whereas ICG is prone to photobleaching upon prolonged illumination. This is an important consideration for lengthy surgical procedures such as liver resections.
A limitation of our study and the use of SERS NPs in general is that real-time Raman imaging devices for use in patients are currently still in the stage of development,39 whereas they already exist for fluorescence imaging.40 A second inherent limitation is that SERS molecular imaging agents are nanoparticles, and despite their inert composition (gold, silica) their regulatory approval is expected to take more time than is generally necessary for small molecule fluorescent dyes. Long-term toxicity and excretion studies will still need to be performed.
CONCLUSIONS
In conclusion, this study has demonstrated that SERS NP-based Raman imaging can be used to delineate liver tumors in mice. Gold-silica SERS NPs accumulate avidly in normal liver tissues, but not in liver tumors, resulting in high contrast and high resolution tumor delineation based on the Raman spectroscopic fingerprint. In a genetic mouse model of hepatocellular carcinoma, SERS NPs enabled detection of all tumors, with high accuracy in the delineation of tumor margins. In a simulated intraoperative scenario, SERS imaging enabled detection of microscopic tumor that would have been otherwise missed by a surgeon. In a genetic mouse model that produces histiocytic sarcomas in liver and spleen, SERS imaging enabled the detection of microscopic tumors not visible by white light microscopy. This translatable SERS imaging approach holds promise for more complete tumor resections as well as for the detection of otherwise occult tumors.
METHODS
All animal studies were approved by the Institutional Animal Care and Use Committees.
Materials
Histology chemicals were purchased from Thermo Scientific (Kalamazoo, MI). ICG (Cardiogreen) was purchased from Chem-Impex International (Wood Dale, IL). Ferumoxytol (Feraheme®) was purchased from AMAG Pharmaceuticals. All other reagents were purchased of the highest purity from Sigma-Aldrich (St. Louis, MO) and were used as received. Dialysis cassettes (MWCO 3.5 kDa; slide-a-lyzer G2) were purchased from Thermo-Fisher Scientific (Waltham, MA).
Synthesis of SERS NPs
Initially, hydroxylamine (5.0 mL, 0.1 M) was added to a boiling aqueous solution (800 mL) of hydrogen tetrachloroaurate(III) (60 μM) and ferumoxytol (170 μL). The resulting gold nanoparticles were stabilized with trisodium citrate (10 mM), cooled to ambient temperatures, and collected by centrifugation (30 min, 4,000×g, 4°C) prior to purification by dialysis against 18.2 MΩ·cm water for two to three days. After we had developed further generations of nanoparticles with greater SERS signal amplification, the gold nanoparticles were synthesized as described in 19. Silica shell: Nanoparticle concentration was adjusted to 2–3 nM prior to coating with silica in the presence of the Raman reporter via a modified Stöber method.41 An aqueous gold nanoparticle dispersion (4 mL) was added to 200 ml ethanol prior to the addition of 4 mL aqueous ammonium hydroxide (28% w/v) and 20 mL 18.2 MΩ·cm water. Under vigorous stirring, an ethanolic solution (60 mL) with 400 μL Raman dye (trans-1,2-bis(4-pyridyl)-ethylene (BPE) for the first generation particles or IR-780 perchlorate for the second) in DMF (25 mM), and 10 mL tetraethyl orthosilicate was then added and the resulting dispersion was allowed to continue to stir vigorously for 40 min. The resulting SERS NPs were isolated by centrifugation (3,500×g, 10 min), washed with ethanol twice, and stored in water for future use.
SERS NP Characterization
Nanoparticles were imaged by transmission electron microscopy (TEM) acquired on carbon grids (Ted Pella, Inc.) using a JEOL 1200 EX microscope (Peabody, MA). Dispersion concentrations were determined by Nanoparticle Tracking Analysis (NTA; Nanosight, Duxbury, MA). To investigate photostability of the particles, a 0.25 nM dispersion of SERS NPs was subjected to continuous irradiation with a 785 nm laser at 50 mW cm−2 for 30 minutes, and Raman spectra were collected intermittently. For stability in serum the signal (based on the intensity of the 1214 cm−1 band) of SERS NPs (1.0 nM) incubated in 50% mouse serum (v/v) at 37 °C was monitored over a 24 hour period. For absorbance spectroscopy characterization, SERS NPs (30 pM) were incubated in 100% mouse serum at 37 °C and monitored for 24 hours.
Mouse models
To generate endogenous HCCs in mice, we performed hydrodynamic tail vein injections of the transposon expressing Myc cDNA, which is integrated into the liver following transient expression of transposase from a plasmid harboring a recombinant Sleeping Beauty (SB) transposon.42 A sterile 0.9% NaCl solution/plasmid mix was prepared containing 5 μg of DNA of pT3-EF1a-Myc together with CMV-SB13 Transposase (1:5 ratio) for each injection. The pT3 transposon vector was a kind gift by Dr. Xin Chen (UCSF). FVBN mice from JAX were injected with the 0.9% NaCl solution/plasmid mix into the lateral tail vein with a total volume corresponding to 10% of body weight in 5–7 sec. 43 Approximately seven weeks after injection, numerous tumors were observed in the livers. Pathological examination confirmed that the tumors represented poorly differentiated HCCs. The Ink4A/Arf−/− model is known to spontaneously develop histiocytic sarcomas, soft tissue sarcomas, and lymphomas. 31–33 Pathological examination demonstrated histiocytic sarcomas in liver and spleen.
MRI
MR images were acquired on a dedicated small animal MRI scanner consisting of a 4.7 Tesla superconducting magnet (Bruker Biospin Corp., Billerica, MA) and a gradient (Resonance Research Inc., Billerica, MA) with a clear bore size of 20 cm, maximum gradient amplitude of 400 mT m−1, and a maximum slew rate of 1,300 T·m−1s−1. Bruker Avance electronics, console and IECO amplifiers (International Electric Co., Helsinki, Finland) with custom-made RF coils were used for RF excitation and detection. T2-weighted RARE fast spin echo sequences were employed, typically using a 256×256 matrix, a 3–4 cm field-of-view, a TE/TR of 40 ms/~4000 ms, a slice thickness of 1000 μm and a number of excitation of 8 for a total imaging time of ~10 min.
Raman imaging
Mice were administered 150 μL of a SERS NP suspension in 2-(N-morpholino) ethanesulfonic acid (MES) buffer (10 mM, pH 7.1–7.3) via tail-vein injection 12–18 hours prior to imaging. For experiments using the first generation SERS NPs, a concentration of 22 nM SERS NPs was used (results shown in Figures 3–5, S2). In all other experiments, the second generation of SERS NPs were used at a concentration of 3 nM, corresponding to a dose of 50 mg/kg (Figures 2, 8–10, S4). After a 12–18 h circulation period, depending on the experimental setting, the mice were either anesthetized with 2% isoflurane for in vivo imaging or euthanized by carbon dioxide asphyxiation and organs imaged in situ.
All Raman scans and measurements were performed with a Renishaw InVia Raman microscope (Renishaw, Hoffman Estates, IL) equipped with a 785-nm diode laser (300 mW cm−2) and a 1-inch charge-coupled–device detector with a spectral resolution of 1.07 cm−1. Raman spectra were acquired through a 5× objective (Leica, Buffalo Grove, IL), where laser output at the objective was measured to be 100 mW cm−2 using a handheld laser power meter (Edmund Optics, Inc, Barrington, NJ). The focal plane was selected by focusing on the region of interest with a white light camera. The Raman scans where collected in ‘Streamline mode’, and have a resolution of 14 μm in the x-direction, and 150–300 μm in the y-direction. A typical Raman scan took between 40–80 minutes, depending on the resolution and area scanned.
ICG imaging
Fluorescence imaging was performed with an Odyssey infrared imaging system (LI-COR, Lincoln, NE) with excitation at 700 and 800 nm. Mice (genetic Myc-driven HCC mouse model, n=3) were administered ICG (0.5 mg/kg) via tail vein injection, and euthanized 24 hours later. The livers were then imaged in situ and ex vivo, fixed in 4% PFA, and sliced in blocks of 1–2 mm thickness. The blocks were once again scanned, embedded in paraffin, and stained with H&E for histopathological evaluation. For experiments using both SERS NPs and ICG simultaneously, we first performed injection of ICG (0.5 mg/kg via tail vein injection), 24 hours before imaging, followed by the injection of the SERS NPs 6 hours later.
Biodistribution Studies
Healthy C57BL/6 wild type mice (n=2) were injected with a bolus of SERS NPs, and sacrificed 18 hours later. The organs were harvested, homogenized, and placed in a 386-well plate. Raman imaging was performed, using scanning parameters similar to in vivo scans. The spectra collected from each well were averaged and then scaled inversely by the weight of the tissue used in the phantom. These weighted intensities were used to determine the relative uptake of the SERS NPs by each tissue. Samples of normal liver and tumor from the HCC bearing mice (n=3) were analyzed for their gold content using neutron activation analysis (NAA), which was performed by Elemental Analysis, Inc. (Lexington, Kentucky).
Real-Time Kinetics of SERS NP Extraction from the Vasculature and Intrahepatic Uptake
The liver of a healthy C57BL/6 wild type mouse was surgically exposed under isoflurane-induced anesthesia. Raman spectra were recorded continuously every second for 10 minutes after the injection of the SERS NPs. In a second experiment, performed under identical conditions on a different healthy C57BL/6 mouse, the Raman signal was monitored at the abdominal aorta to establish the pharmacokinetics of SERS NPs in the blood circulation. The intensities of the signal were subjected to baseline subtraction and normalized based on the final intensity of the SERS signal, recorded at the liver of each animal, at t=40 minutes.
Histology
After imaging, livers and spleens were harvested and fixed in 4% paraformaldehyde (PFA, MP Chemicals, Solon, OH) overnight at 4 °C, followed by a rinse with phosphate-buffered saline (PBS) for 15–30 minutes and then kept in 70% ethanol. As needed, tissues were sliced for further ex vivo Raman or fluorescence imaging before embedding in paraffin. 5-μm-thick sections were then cut from the paraffin block and stained with hematoxylin and eosin and scanned with a Mirax digital slide scanner (Zeiss, Jena, Germany) for histopathological analysis.
Data Analysis
Data analysis of the spectral images was performed in MATLAB (R2014b) and PLS Toolbox v.8.0 (Eigenvector Research, Inc., Wenatchee, WA). For displayed SERS intensities, baseline subtraction was performed on the collected spectra using a Whittaker filter with λ=200 cm−1. For the DCLS models, no baseline subtraction was performed. Reference spectra were collected from pure solutions of SERS NPs (with either BPE or IR-780 dye), and ICG. The reference spectra were first subjected to an L∞-norm (normalization by max), followed by a Savitzky–Golay filter (2nd degree polynomial fit, 1st order derivative, width: 15 steps). The experimental data were only subjected to the Savitzky–Golay filter (no normalization), and then assessed by the model. In this way, the scores assigned by the model correspond roughly to physical intensity units.
Raman Images: For each experiment, an arbitrary threshold was established on the DCLS scores, such that the lowest scores above the noise are shown, and this was assigned to correspond to healthy liver and represented with a black color. The intensity of the remaining areas (due mostly to autofluorescence) was mapped out in contours, and was assigned as tumor if above a certain threshold. For in vivo images in Figure 3 and Supporting Information Figure S4 the gut autofluorescence was used to guide a human operator to remove these areas from being displayed as tumor. The receiver operating characteristic curves for SERS NPs and ICG were generated under the assumption that true positives are points identified as tumor by both imaging agents. Although neither agent is a “gold standard”, the comparison allows to assess the relative sensitivity and specificity of the two methods.
Determination of Photobleaching of SERS NPs and ICG
For the experiment involving SERS NPs, the same procedure was followed as for in vivo imaging: a single bolus was injected into a healthy C57BL/6 mouse 18 hours prior to sacrifice and excision of the liver. The liver was placed under the Raman microscope, and time sequence acquisitions were performed, under constant illumination with different light intensities, using a 785 nm diode laser and a 5× objective. A different area on the liver was illuminated for each time sequence. For the ICG experiment a healthy C57BL/6 mouse was injected with a bolus of ICG (0.5 mg/kg) and sacrificed ten minutes later. The liver was illuminated using identical parameters as for the SERS NPs.
Supplementary Material
Acknowledgments
The authors thank S. Harmsen and M. Wall (MSKCC, Kircher lab) for helpful advice; M. Levine (MSKCC, Kircher lab) for assistance with the experiments; J. White (MSKCC Center of Comparative Medicine and Pathology) for help with interpreting histological slides; and the MSKCC electron microscopy core (N. Lampen) and molecular cytology core. This study was funded (in part) by the following grants: NIH R01 EB017748 (M.F.K.); NIH K08 CA16396 (M.F.K.); M.F.K. is a Damon Runyon-Rachleff Innovator supported (in part) by the Damon Runyon Cancer Research Foundation (DRR-29-14); Pershing Square Sohn Prize by the Pershing Square Sohn Cancer Research Alliance (M.F.K.); The Dana Foundation Brain and Immuno-Imaging Grant and Dana Neuroscience Scholar Award (M.F.K.); Geoffrey Beene Cancer Research Center at MSKCC Grant Award (M.F.K.) and Shared Resources Award (M.F.K.); Bayer HealthCare Pharmaceuticals/RSNA Research Scholar Grant (M.F.K.); Center for Molecular Imaging & Nanotechnology (CMINT) Grant (M.F.K.); The Center for Experimental Therapeutics of Memorial Sloan Kettering Cancer Center, and Molecularly Targeted Intra-Operative Imaging Grants (M.F.K.); Mr. William H. and Mrs. Alice Goodwin and the Commonwealth Foundation for Cancer Research; MSKCC Office of Technology TDF Grant (M.F.K.); Society of MSKCC Research Grant (M.F.K.); Deutsche Forschungsgemeinschaft (DFG) NE 1922/2-1 (V.N.). NIH 5P01 CA013106 and NIH 5U01 CA168409 (S.W.L). This research was funded in part through the NIH/NCI Cancer Center Support Grant P30 CA008748.
ABBREVIATIONS
- SERS
surface enhanced Raman spectroscopy
- NP
nanoparticle
- HCC
hepatocellular carcinoma
Footnotes
AUTHOR CONTRIBUTIONS
C.A. synthesized and characterized nanoparticles, performed in vitro and in vivo experiments, developed the DCLS analysis model, analyzed the data, and contributed to writing the paper. V.N. designed and performed in vivo experiments. D.T., C.H., and S.W.L. provided the HCC mouse model and helpful discussions. A.O. synthesized nanoparticles. P.I. synthesized and characterized nanoparticles, and contributed to writing the paper. H.K. assisted in initial in vivo experiments and contributed to writing the paper. R.C. and L.M. critically reviewed and edited the paper. M.F.K. conceived the study, designed the research, supervised the study, performed in vivo experiments and wrote the paper. All authors reviewed and approved the final version of the paper.
Supporting Information Available: Size distribution, zeta potential, and in in vitro stability tests using DLS and UV-vis. Raman maps of SERS NP uptake by healthy liver and spleen. Ex vivo TEM of SERS NPs in liver tissue. Procedure for determining cancer versus healthy liver tissue using Raman imaging and DCLS. Reference spectra used for DCLS model. ROC curves for SERS NPs and ICG as contrast agents for liver tumor imaging. This material is available free of charge via the Internet at http://pubs.acs.org.
References
- 1.Ishizawa T, Gumbs AA, Kokudo N, Gayet B. Laparoscopic Segmentectomy of the Liver: From Segment I to VIII. Ann Surg. 2012;256:959–964. doi: 10.1097/SLA.0b013e31825ffed3. [DOI] [PubMed] [Google Scholar]
- 2.Kudo H, Ishizawa T, Tani K, Harada N, Ichida A, Shimizu A, Kaneko J, Aoki T, Sakamoto Y, Sugawara Y, Hasegawa K, Kokudo N. Visualization of Subcapsular Hepatic Malignancy by Indocyanine-Green Fluorescence Imaging During Laparoscopic Hepatectomy. Surg Endosc. 2014;28:2504–2508. doi: 10.1007/s00464-014-3468-z. [DOI] [PubMed] [Google Scholar]
- 3.Bonanni L, De’liguori Carino N, Deshpande R, Ammori BJ, Sherlock DJ, Valle JW, Tam E, O’Reilly DA. A Comparison of Diagnostic Imaging Modalities for Colorectal Liver Metastases. Eur J Surg Oncol. 2014;40:545–550. doi: 10.1016/j.ejso.2013.12.023. [DOI] [PubMed] [Google Scholar]
- 4.Grimm J, Kircher MF, Weissleder R. Cell Tracking. Principles and Applications. Radiologe. 2007;47:25–33. doi: 10.1007/s00117-006-1449-5. [DOI] [PubMed] [Google Scholar]
- 5.Kircher MF, Gambhir SS, Grimm J. Noninvasive Cell-Tracking Methods. Nat Rev Clin Oncol. 2011;8:677–688. doi: 10.1038/nrclinonc.2011.141. [DOI] [PubMed] [Google Scholar]
- 6.Kircher MF, Willmann JK. Molecular Body Imaging: MR Imaging, CT, and US. Part I. Principles. Radiology. 2012;263:633–643. doi: 10.1148/radiol.12102394. [DOI] [PMC free article] [PubMed] [Google Scholar]
- 7.Damian CD, Rednic N, Munteanu D, Cazacu M. The Role of Intraoperative Ultrasound for the Assessment of the Focal Liver Lesions in Patients with Colorectal Cancer. Med Ultrason. 2014;16:114–118. doi: 10.11152/mu.201.3.2066.162.cdd1nr2. [DOI] [PubMed] [Google Scholar]
- 8.Kruskal JB, Kane RA. Intraoperative US of the Liver: Techniques and Clinical Applications. Radiographics. 2006;26:1067–1084. doi: 10.1148/rg.264055120. [DOI] [PubMed] [Google Scholar]
- 9.Mui LW, Pursell LJ, Botwinick IC, Allendorf JD, Chabot JA, Newhouse JH. Routine Intraoperative Hepatic Sonography Does Not Affect Staging or Postsurgical Hepatic Recurrence in Pancreatic Adenocarcinoma. J Ultrasound Med. 2014;33:47–51. doi: 10.7863/ultra.33.1.47. [DOI] [PubMed] [Google Scholar]
- 10.Iida G, Asano K, Seki M, Ishigaki K, Teshima K, Yoshida O, Edamura K, Kagawa Y. Intraoperative Identification of Canine Hepatocellular Carcinoma with Indocyanine Green Fluorescent Imaging. J Small Anim Pract. 2013;54:594–600. doi: 10.1111/jsap.12148. [DOI] [PubMed] [Google Scholar]
- 11.Ishizawa T, Masuda K, Urano Y, Kawaguchi Y, Satou S, Kaneko J, Hasegawa K, Shibahara J, Fukayama M, Tsuji S, Midorikawa Y, Aburatani H, Kokudo N. Mechanistic Background and Clinical Applications of Indocyanine Green Fluorescence Imaging of Hepatocellular Carcinoma. Ann Surg Oncol. 2014;21:440–448. doi: 10.1245/s10434-013-3360-4. [DOI] [PubMed] [Google Scholar]
- 12.Zavaleta CL, Kircher MF, Gambhir SS. Raman’s “Effect” on Molecular Imaging. J Nucl Med. 2011;52:1839–1844. doi: 10.2967/jnumed.111.087775. [DOI] [PubMed] [Google Scholar]
- 13.Iacono P, Karabeber H, Kircher MF. A “Schizophotonic” All-in-One Nanoparticle Coating for Multiplexed SE(R)RS Biomedical Imaging. Angew Chem Int Ed Engl. 2014;53:11756–11761. doi: 10.1002/anie.201403835. [DOI] [PMC free article] [PubMed] [Google Scholar]
- 14.Karabeber H, Huang R, Iacono P, Samii JM, Pitter K, Holland EC, Kircher MF. Guiding Brain Tumor Resection Using Surface-Enhanced Raman Scattering Nanoparticles and a Hand-Held Raman Scanner. ACS Nano. 2014;8:9755–9766. doi: 10.1021/nn503948b. [DOI] [PMC free article] [PubMed] [Google Scholar]
- 15.Kircher MF, de la Zerda A, Jokerst JV, Zavaleta CL, Kempen PJ, Mittra E, Pitter K, Huang R, Campos C, Habte F, Sinclair R, Brennan CW, Mellinghoff IK, Holland EC, Gambhir SS. A Brain Tumor Molecular Imaging Strategy Using a New Triple-Modality MRI-Photoacoustic-Raman Nanoparticle. Nat Med. 2012;18:829–834. doi: 10.1038/nm.2721. [DOI] [PMC free article] [PubMed] [Google Scholar]
- 16.Spaliviero M, Harmsen S, Huang R, Wall MA, Andreou C, Eastham JA, Touijer KA, Scardino PT, Kircher MF. Detection of Lymph Node Metastases with SERRS Nanoparticles. Mol Imaging Biol. 2016 Mar 4; doi: 10.1007/s11307-016-0932-2. [Epub ahead of print] [DOI] [PMC free article] [PubMed] [Google Scholar]
- 17.Huang R, Harmsen S, Samii JM, Karabeber H, Pitter KL, Holland EC, Kircher MF. High Precision Imaging of Microscopic Spread of Glioblastoma with a Targeted Ultrasensitive SERRS Molecular Imaging Probe. Theranostics. 2016 doi: 10.7150/thno.13842. (in press) [DOI] [PMC free article] [PubMed] [Google Scholar]
- 18.Andreou C, Kishore SA, Kircher MF. Surface-Enhanced Raman Spectroscopy: A New Modality for Cancer Imaging. J Nucl Med. 2015;56:1295–1299. doi: 10.2967/jnumed.115.158196. [DOI] [PMC free article] [PubMed] [Google Scholar]
- 19.Harmsen S, Huang R, Wall MA, Karabeber H, Samii JM, Spaliviero M, White JR, Monette S, O’Connor R, Pitter KL, Sastra SA, Saborowski M, Holland EC, Singer S, Olive KP, Lowe SW, Blasberg RG, Kircher MF. Surface-Enhanced Resonance Raman Scattering Nanostars for High-Precision Cancer Imaging. Sci Transl Med. 2015;7:271–277. doi: 10.1126/scitranslmed.3010633. [DOI] [PMC free article] [PubMed] [Google Scholar]
- 20.Harmsen S, Bedics MA, Wall MA, Huang R, Detty MR, Kircher MF. Rational Design of a Chalcogenopyrylium-Based Surface-Enhanced Resonance Raman Scattering Nanoprobe with Attomolar Sensitivity. Nat Commun. 2015;6:6570. doi: 10.1038/ncomms7570. [DOI] [PMC free article] [PubMed] [Google Scholar]
- 21.Schlucker S. Surface-Enhanced Raman Spectroscopy: Concepts and Chemical Applications. Angew Chem Int Ed Engl. 2014;53:4756–4795. doi: 10.1002/anie.201205748. [DOI] [PubMed] [Google Scholar]
- 22.Wang Y, Yan B, Chen L. SERS Tags: Novel Optical Nanoprobes for Bioanalysis. Chem Rev. 2013;113:1391–1428. doi: 10.1021/cr300120g. [DOI] [PubMed] [Google Scholar]
- 23.Campion A, Kambhampati P. Surface-Enhanced Raman Scattering. Chem Soc Rev. 1998;27:241–250. [Google Scholar]
- 24.Kircher MF, Willmann JK. Molecular Body Imaging: MR Imaging, CT, and US. Part II. Applications. Radiology. 2012;264:349–368. doi: 10.1148/radiol.12111703. [DOI] [PubMed] [Google Scholar]
- 25.Kawamori Y, Matsui O, Kadoya M, Yoshikawa J, Demachi H, Takashima T. Differentiation of Hepatocellular Carcinomas from Hyperplastic Nodules Induced in Rat Liver with Ferrite-Enhanced MR Imaging. Radiology. 1992;183:65–72. doi: 10.1148/radiology.183.1.1549696. [DOI] [PubMed] [Google Scholar]
- 26.Ray TR, Lettiere B, de Rutte J, Pennathur S. Quantitative Characterization of the Colloidal Stability of Metallic Nanoparticles Using Uv-Vis Absorbance Spectroscopy. Langmuir. 2015;31:3577–3586. doi: 10.1021/la504511j. [DOI] [PubMed] [Google Scholar]
- 27.Sadauskas E, Wallin H, Stoltenberg M, Vogel U, Doering P, Larsen A, Danscher G. Kupffer Cells Are Central in the Removal of Nanoparticles from the Organism. Part Fibre Toxicol. 2007;4:10. doi: 10.1186/1743-8977-4-10. [DOI] [PMC free article] [PubMed] [Google Scholar]
- 28.Hekimoglu K, Ustundag Y, Dusak A, Kalaycioglu B, Besir H, Engin H, Erdem O. Small Colorectal Liver Metastases: Detection with SPIO-Enhanced MRI in Comparison with Gadobenate Dimeglumine-Enhanced MRI and CT Imaging. Eur J Radiol. 2011;77:468–472. doi: 10.1016/j.ejrad.2009.09.002. [DOI] [PubMed] [Google Scholar]
- 29.Kim YK, Kim CS, Lee YH, Kwak HS, Lee JM. Comparison of Superparamagnetic Iron Oxide-Enhanced and Gadobenate Dimeglumine-Enhanced Dynamic MRI for Detection of Small Hepatocellular Carcinomas. AJR Am J Roentgenol. 2004;182:1217–1223. doi: 10.2214/ajr.182.5.1821217. [DOI] [PubMed] [Google Scholar]
- 30.Mergo PJ, Engelken JD, Helmberger T, Ros PR. Mri in Focal Liver Disease: A Comparison of Small and Ultra-Small Superparamagnetic Iron Oxide as Hepatic Contrast Agents. J Magn Reson Imaging. 1998;8:1073–1078. doi: 10.1002/jmri.1880080511. [DOI] [PubMed] [Google Scholar]
- 31.Carrasco DR, Fenton T, Sukhdeo K, Protopopova M, Enos M, You MJ, Di Vizio D, Nogueira C, Stommel J, Pinkus GS, Fletcher C, Hornick JL, Cavenee WK, Furnari FB, DePinho RA. The PTEN and Ink4a/Arf Tumor Suppressors Maintain Myelolymphoid Homeostasis and Cooperate to Constrain Histiocytic Sarcoma Development in Humans (Vol 9, Pg 379, 2006) Cancer Cell. 2006;10:171. doi: 10.1016/j.ccr.2006.03.028. [DOI] [PubMed] [Google Scholar]
- 32.Serrano M, Lee HW, Chin L, CordonCardo C, Beach D, DePinho RA. Role of the Ink4a Locus in Tumor Suppression and Cell Mortality. Cell. 1996;85:27–37. doi: 10.1016/s0092-8674(00)81079-x. [DOI] [PubMed] [Google Scholar]
- 33.Sharpless NE, Ramsey MR, Balasubramanian P, Castrillon DH, DePinho RA. The Differential Impact of P16(Ink4a) or P19(Arf) Deficiency on Cell Growth and Tumorigenesis. Oncogene. 2004;23:379–385. doi: 10.1038/sj.onc.1207074. [DOI] [PubMed] [Google Scholar]
- 34.Sheth RA, Arellano RS, Uppot RN, Samir AE, Goyal L, Zhu AX, Gervais DA, Mahmood U. Prospective Trial with Optical Molecular Imaging for Percutaneous Interventions in Focal Hepatic Lesions. Radiology. 2015;274:917–926. doi: 10.1148/radiol.14141308. [DOI] [PMC free article] [PubMed] [Google Scholar]
- 35.Sheth RA, Heidari P, Esfahani SA, Wood BJ, Mahmood U. Interventional Optical Molecular Imaging Guidance During Percutaneous Biopsy. Radiology. 2014;271:770–777. doi: 10.1148/radiol.14131880. [DOI] [PMC free article] [PubMed] [Google Scholar]
- 36.Thakor AS, Luong R, Paulmurugan R, Lin FI, Kempen P, Zavaleta C, Chu P, Massoud TF, Sinclair R, Gambhir SS. The Fate and Toxicity of Raman-Active Silica-Gold Nanoparticles in Mice. Sci Transl Med. 2011;3:79–33. doi: 10.1126/scitranslmed.3001963. [DOI] [PMC free article] [PubMed] [Google Scholar]
- 37.van der Vorst JR, Hutteman M, Mieog JS, de Rooij KE, Kaijzel EL, Lowik CW, Putter H, Kuppen PJ, Frangioni JV, van de Velde CJ, Vahrmeijer AL. Near-Infrared Fluorescence Imaging of Liver Metastases in Rats Using Indocyanine Green. J Surg Res. 2012;174:266–271. doi: 10.1016/j.jss.2011.01.009. [DOI] [PMC free article] [PubMed] [Google Scholar]
- 38.van Dam GM, Themelis G, Crane LM, Harlaar NJ, Pleijhuis RG, Kelder W, Sarantopoulos A, de Jong JS, Arts HJ, van der Zee AG, Bart J, Low PS, Ntziachristos V. Intraoperative Tumor-Specific Fluorescence Imaging in Ovarian Cancer by Folate Receptor-Alpha Targeting: First in-Human Results. Nat Med. 2011;17:1315–1319. doi: 10.1038/nm.2472. [DOI] [PubMed] [Google Scholar]
- 39.Bohndiek SE, Wagadarikar A, Zavaleta CL, Van de Sompel D, Garai E, Jokerst JV, Yazdanfar S, Gambhir SS. A Small Animal Raman Instrument for Rapid, Wide-Area, Spectroscopic Imaging. Proc Natl Acad Sci U S A. 2013;110:12408–12413. doi: 10.1073/pnas.1301379110. [DOI] [PMC free article] [PubMed] [Google Scholar]
- 40.Troyan SL, Kianzad V, Gibbs-Strauss SL, Gioux S, Matsui A, Oketokoun R, Ngo L, Khamene A, Azar F, Frangioni JV. The Flare Intraoperative near-Infrared Fluorescence Imaging System: A First-in-Human Clinical Trial in Breast Cancer Sentinel Lymph Node Mapping. Ann Surg Oncol. 2009;16:2943–2952. doi: 10.1245/s10434-009-0594-2. [DOI] [PMC free article] [PubMed] [Google Scholar]
- 41.Mine E, Yamada A, Kobayashi Y, Konno M, Liz-Marzan LM. Direct Coating of Gold Nanoparticles with Silica by a Seeded Polymerization Technique. J Colloid Interface Sci. 2003;264:385–390. doi: 10.1016/S0021-9797(03)00422-3. [DOI] [PubMed] [Google Scholar]
- 42.Yant SR, Meuse L, Chiu W, Ivics Z, Izsvak Z, Kay MA. Somatic Integration and Long-Term Transgene Expression in Normal and Haemophilic Mice Using a DNA Transposon System. Nat Genet. 2000;25:35–41. doi: 10.1038/75568. [DOI] [PubMed] [Google Scholar]
- 43.Huang CH, Lujambio A, Zuber J, Tschaharganeh DF, Doran MG, Evans MJ, Kitzing T, Zhu N, de Stanchina E, Sawyers CL, Armstrong SA, Lewis JS, Sherr CJ, Lowe SW. Cdk9-Mediated Transcription Elongation Is Required for Myc Addiction in Hepatocellular Carcinoma. Genes Dev. 2014;28:1800–1814. doi: 10.1101/gad.244368.114. [DOI] [PMC free article] [PubMed] [Google Scholar]
Associated Data
This section collects any data citations, data availability statements, or supplementary materials included in this article.


