

Abstract
The effect of soil moisture on seasonal variation in soil air and indoor radon is studied. A brief review of the theory of the effect of soil moisture on soil air radon has been presented. The theoretical estimates, together with soil moisture measurements over a period of 10 y, indicate that variation in soil moisture evidently is an important factor affecting the seasonal variation in soil air radon concentration. Partitioning of radon gas between the water and air fractions of soil pores is the main factor increasing soil air radon concentration. On two example test sites, the relative standard deviation of the calculated monthly average soil air radon concentration was 17 and 26 %. Increased soil moisture in autumn and spring, after the snowmelt, increases soil gas radon concentrations by 10–20 %. In February and March, the soil gas radon concentration is in its minimum. Soil temperature is also an important factor. High soil temperature in summer increased the calculated soil gas radon concentration by 14 %, compared with winter values. The monthly indoor radon measurements over period of 1 y in 326 Finnish houses are presented and compared with the modelling results. The model takes into account radon entry, climate and air exchange. The measured radon concentrations in autumn and spring were higher than expected and it can be explained by the seasonal variation in the soil moisture. The variation in soil moisture is a potential factor affecting markedly to the high year-to-year variation in the annual or seasonal average radon concentrations, observed in many radon studies.
INTRODUCTION
Radon-bearing soil air is the most important factor affecting enhanced indoor radon concentrations. Many physical factors and processes are involved in the generation and transfer of radon from mineral grains to soil gas and in the movements of radon-bearing soil air. The entry of soil gas into living spaces is controlled by the flow dynamics of soil air in the porous soil media and through a large variety of gaps, air-permeable building blocks and openings in the structures in contact with soil or in floor structures in crawl space houses. Furthermore, the physical properties of the house itself (such as indoor temperature, air-tightness and air exchange) are important. Climatic factors, wind, outdoor temperature and rain affect the physical processes of soil air radon generation, entry into buildings and accumulation and removal from living spaces. In addition, terrain-related factors (such as soil permeability, slopes and hills in the immediate surroundings) affect radon entry into buildings.
Seasonal and diurnal variation in indoor radon concentration is created by the interaction of climatic factors with the multiple mineral, soil and building-bound factors described above. The main removal process decreasing indoor radon concentration is the air exchange in indoor spaces. Both indoor–outdoor temperature difference and wind contribute to the pressure difference in the envelopes of residential buildings, which is the driving force for air exchange. It is noteworthy that the same pressure difference is also the driving force for airflow from soil to indoor spaces. Modelling these phenomena provides a tool for understanding the seasonal variation in indoor radon concentration.
Seasonal variation in indoor radon has been studied for a long time(1–5). The dominant observation in seasonal variation is a higher indoor radon concentration in winter than in summer. In the current British(3, 6), Irish(7) and French(8) studies, the seasonality factors are ∼1.30 for the coldest winter months and 0.70 for midsummer. In the extensive Italian study with 4742 houses the geometric mean of the winter/summer ratio was 1.23 (geometric standard deviation, GSD 1.71)(9). In the Italian study two 6-months measurements were carried out. Large variation in seasonality factors characterises the results.
The observed coefficient of variation (COV) of the 3 months-long radon measurement about the annual average is typically 30 %(6, 10). The observed year-to-year variations in the annual average are also high. Steck(11) and Zhang et al.(12) report variation in the range of from 0 to 110 %. The median COV in these studies was 26 and 19 %. Based on large data from countries involved in the European epidemiological study(13), the country-specific year-to-year variation expressed as the COV in the annual average radon activity concentration was 17–62 %. On the basis of the German epidemiological analysis, Heid et al.(14) conclude in a corresponding error estimate of 0.55. High year-to-year variation indicates that variation between e.g. subsequent summers or autumns may be higher than the observed variation in the annual average. These high variation figures are difficult to explain purely on the basis of variation in climatic factors, ventilation practices or other living practices.
A remarkable seasonal variation in soil gas radon concentration has been observed. Nazaroff(15) states that day-to-day variations in deep soil radon concentrations of 100 % and seasonal variation up to an order of magnitude have been observed at a depth of 70–100 cm. The most prominent observations have been made in hilly areas where subterranean air flow strongly affects the seasonal variation in soil gas radon concentration(16–18).
Rose et al.(19) have studied seasonal variation in different temperature, soil type, and soil moisture regimes in the USA. The study concludes that among the many effects of water on soil gas radon, the effect of the varying proportion of pore space occupied by water appears to be among the largest and most universal. The study estimates that soil gas radon will be most elevated by moisture effects in the eastern USA. In some states, the summer concentration of soil gas radon was predicted to be higher than the winter concentration. In later studies of indoor radon, little or no attention has been paid to these important findings.
Numerical modelling of radon entry has provided valuable information on the effect of soil permeability and moisture on radon entry(15, 20–22). However, soil moisture measurements made simultaneously with soil gas measurements have been analysed only in a few studies(23, 24). This lack of knowledge is partly due to the fact that new practical and cheap soil moisture probes did not become available until the end of the 1990s.
Soil moisture and drying affect the transport properties of soil air. Measurements and modelling studies of Grasty(25) indicate that because of long periods of low precipitation, clays were drying out in summer, allowing fractures to develop and radon to migrate easily through the ground.
In this article, the potential effect of soil moisture content on seasonal variation in indoor radon concentrations is studied. First, the theory section considers the effect of soil moisture on soil gas radon concentration. Second, the seasonal variation in soil moisture content is studied on the basis of experimental long-term measurements. Using these results the variation in soil gas radon concentration is estimated. Third, monthly variation of indoor radon over a period of 1 y in a representative sample of 326 Finnish houses is studied. The variation pattern is compared with modelling results. Finally, the role of soil moisture as a factor affecting the observed degree of temporal variation in indoor radon concentration is discussed. This kind of multidisciplinary analysis has not been carried out before.
MATERIALS AND METHODS
This study entails two main experimental sections: (1) measurements of soil gas water content and application to soil air radon concentration; and (2) analysis of monthly indoor radon measurements in 326 houses. The theoretical approach entails two sections: (1) theory and calculation of soil gas radon concentration and (2) simplified modelling of indoor radon concentration using meteorological and soil water data.
Soil water content
Measurements of soil water content presented in the study are from the control programme of the Finnish Geological Survey on altogether from over 40 and ongoing 20 measurement sites established since 2001. The data used in this study are from Nurmijärvi and Multia established in 2001 because they represent well the soil conditions of a typical Finnish single family house. Nurmijärvi is located (lat/lon) 60°30.5′/24°39.4′, in southern Finland, 40 km north of Helsinki. Multia is located 62°24.6′/25°3.2′, in the middle of Finland, 250 km north of Helsinki. The soil temperature (T107; Campbell Scientific, USA) and water content measurements are carried out at depths of 10, 30, 50, 70 and 90 cm. In this study, the mean of these measurements represents the average water content at a depth of 0−100 cm. The water content information is derived from the effect of changing the dielectric constant on electromagnetic waves propagating along a wave guide (CS615; Campbell Scientific, USA) corrected by dry sand calibration values determined in GTK(26).
Water movement in soil occurs in the pore volume. The pore volume consists of micropores where the movement of water is slow and macropores where water moves fast(27, 28). The water movement in coarse soil types such as gravel, sand and sandy tills is mainly in macropores and less in micropores, which have slow motion residual water; in other words, they have low field capacity. In non-rainy periods, surface gravel layers get dry soon after rain water has been transported through them. In fine soil types, such as silts and clays, micropores are prevailing, water movement is slow and those are practically always wet.
Monthly radon measurements
The study was carried out in the area of 84 municipalities in the south of Finland. The municipalities belong to the high radon provinces, where 21–51 % of the houses exceed the reference level for new construction (200 Bq m−3)(29). The 300 houses formed a random sub-sample of 3000 houses from this area. The original sample was selected using simple random sampling carried out by the Population Register Centre of Finland. In the case of a person under the age of consent, the elder parent was chosen. A leaflet on radon and a letter of invitation were sent to the chosen persons. The persons who sent a positive reply were sent 12 radon detectors for subsequent months from October 1996 to September 1997. In connection with the first detector, a 1-y detector was also sent for checking the integrated radon concentration for this study period. The standard questionnaire of the STUK radon measurement service was used to gather information on the house type, foundation type, ventilation strategies and other house characteristics. Due to the representative sample and minor changes in the housing stock, the material is still valuable.
An integrating alpha track detector with polycarbonate radon film was used. The detector sensitivity is 0.015 (tracks cm−2)/(Bq d m−3). The active area of the polycarbonate film is 1.56 cm2. The relative standard deviation (RSD) for detectors with laboratory exposure corresponding to periods of 1 month in the median radon concentration of this study (120 Bq m−3) is 15 %. The detector background is 3 tracks cm−2. The normal measurement period required from household radon measurements in Finland is 2 months, providing a corresponding standard deviation of 11 %.
Since 1999, the traceability of the detectors is based on the calibration services of the Physikalisch-Technische Bundesanstalt (PTB) in Germany. PTB calibrates biannually the secondary calibration instrument of STUK. There is no marked difference affecting the calibration and quality control of the radon detectors used in this study in 1996–97 compared with the practices introduced in 1999.
Modelling of indoor radon concentration
The model estimates indoor radon concentration assuming a constant concentration of soil air radon. A simplified version compared with the previous publication(4) was used. The model combines the total radon entry rate and the air exchange rate. Radon concentration ARn in the dwelling can be calculated using Equation (1). The radon entry rate comprises two components: diffusive and convective entry rates, Sd and Ssoil. N is the air exchange rate (h−1) and V is the house interior volume. λ is the radioactive decay constant of 222Rn, 0.0076 h−1. Aout is the outdoor air radon concentration; in this study, a low value of 5 Bq m−3 has been used. The force driving the convective flow is the pressure differential caused by the indoor–outdoor temperature difference ΔT. This phenomenon is designated as the stack effect.
| (1) |
| (2) |
| (3) |
The Lawrence Berkeley Laboratory model(30) was used in air infiltration predictions. It adds in quadrature the infiltration rates due to indoor–outdoor temperature differences (stack effect) and wind speed (v) (Equation (2)). Q is the total infiltration (m3 h−1), ELA is the effective leakage area, fsr is the stack parameter and fwr is the wind parameter. Typical values of these parameters have been used(30): fsr is 0.12 m s−1 K−1/2 and fwr is 0.13. The meteorological data used is from Jokioinen, located 100 km northwest of Helsinki. The indoor temperature was set to 21°C.
The effective leakage area, ELA, is a standard measure of building tightness, which is measured by pressurising a building with a fan. ELA has been set to a value of 0.028 m2, which results in an air exchange rate of 0.4 h−1 using the annual average outdoor temperature (6.3°C) and wind speed (3.6 m s−1) in Jokioinen. The exponent 0.72 of ΔT in Equation (2) is based on extensive studies of the air flow versus the pressure difference behaviour in Finnish houses(31). Ssoil is the source term expressing the entry rate per unit temperature difference. The diffusive radon entry rate Sd for the house is 1500 Bq h−1. In a house with a volume of 250 m3 and an air exchange rate of 0.4 h−1, this source strength results in a radon concentration of 15 Bq m−3. In Finnish apartments with concrete elements in floors, walls and ceilings(29), the average indoor radon concentration is 50 Bq m−3. Therefore, in a typical wooden house where the floor slab is concrete and the walls and ceilings are wooden, the effect of diffusive entry from a floor slab can be roughly approximated using the entry rate 1500 Bq h−1. The parameter for the convective radon entry Ssoil has been set to a value, which in the Finnish climate results in an annual average radon concentration of 120 Bq m−3, where the contribution of the diffusive and convective radon entry is 15 and 105 Bq m−3.
THEORY OF SOIL AIR RADON CONCENTRATION
Air and water porosity
The brief review of this chapter on soil moisture, temperature and soil air radon concentration follows the terminology and theoretical approach in the presentations of Nazaroff(15) and Andersen(22). The total volume of a reference element of soil V can be divided into three parts: volume of grains Vg, volume of water Vw and volume of air Va. The radon activity concentrations in water and air parts are correspondingly Cw and Ca. The partitioning of radon between air and water phases is described by the following equation:
| (4) |
where L is the Ostwald partition coefficient, which equals 0.525, 0.429, 0.357 and 0.302 at temperatures of 0, 5, 10 and 15°C(32). Linear isotherms are assumed.
The radon generation rate per pore volume (Bq s−1 m−3) is defined as
| (5) |
where λ is the decay constant of radon (2.098 10−6 s−1), f emanation factor, and ARa the activity concentration of 226Ra (Bq kg−1) per dry mass, ρg is the grain density (2.65 kq m−3) and ε is the total porosity (Vw + Va)/V.
Emanation
Radon emanation factor f (or emanation power) is the fraction of radon atoms that escape to the soil pore volume when 226Ra atoms decay. The rest (fraction 1 – f) remain trapped in the solid mineral grains. A comprehensive review on emanation measurements is provided by Sakoda et al.(33). One of the key findings of emanation studies is the fact that in the range of 0–10 % of the volumetric water content in soil pores, the emanation factor increases roughly by a factor of two(21, 33–37). Already small moisture increases of 1–3 volume per cent increase the radon emanation of dry soil. A sharp rise from 0.13 to 0.28 has been observed for sand samples as the pore moisture content increases from zero to only 0.5 %(21). Markkanen and Arvela as well as Strong and Levins observed a similar rise in the range from 0 to 3 %. The grain size distribution affects the moisture dependence. When radon atoms are trapped in the water volume, radon is further free to escape into the soil pore volume, which is described by porosity and is typically 10–30 % for different soil types. Figure 1 presents a relative emanation factor versus water saturation factor(37).
Figure 1.

Relative emanation factor as a function of the water saturation factor.
Diffusion
The radon concentration at the atmospheric surface of soil is zero. Radon concentration Ca(z) at depth z can be expressed as
| (6) |
| (7) |
| (8) |
Cad presents the deep soil radon concentration and β = εa + L εw the partition-corrected porosity where the air porosity εa is Va/V and the water porosity εw is Vw/V. m is the fraction of water saturation of soil pores referred to below as water saturation fraction. Figure 2 shows the soil air radon concentration for the m-values of 0.9, 0.7, 0.5 and 0.3 at varying soil temperature(38). Kemski et al.(38) has presented similar results on the basis of the studies of Rose et al.(19) ARa is 27 Bq kg−1, emanation factor f is 0.2, soil porosity ε is 0.3 and the density of soil grains ρg is 2.65 kg m−3. These results show that the effect of temperature is stronger for high saturation factors. The effect of the increasing saturation factor, due to partitioning of radon into air volume, is more marked than the effect of temperature.
Figure 2.

Deep soil air radon concentration for different soil temperatures and water saturation fractions of soil pore volume.
The concept of diffusivity is sometimes unclear in the literature. Therefore the terms ‘bulk’ and ‘effective’ may be used with different meanings(22). De is the effective diffusivity. The bulk diffusivity D is the product of the partition-corrected porosity β and the effective diffusivity De. The diffusivity of radon in wet soil has been studied by Rogers and Nielson(39). In this study, we use their empirical equation based on measurements of more than 1000 samples of various types of soils
| (9) |
where D0 = 1.1 × 10⁻⁵ m2 s−1. Figure 3 shows both the effective diffusivity and air permeability for increasing water saturation factor. The agreement with this empirical equation and later tests in moisturised sand is good(21).
Figure 3.

Effective diffusivity and normalised soil permeability for varying water saturation factor of soil.
The diffusion length (De/λ)½ represents the depth where the soil gas radon concentration has been reduced to 63 % of the deep soil radon concentration. The diffusion length for dry soil with porosity of 0.3 is 1.25 m. The effective diffusivity decreases from 3 ×10⁻⁶ to 1 × 10⁻⁶ m2 s−1 when the water saturation factor increases from 0 to 0.5 and further by a factor of 10 when the saturation goes to 0.8. Figure 4 demonstrates the decrease in radon concentration with the water saturation factor for varying depths. At a depth of 1 m, soil air radon concentration increases from 30 to 62 kBq m−3 when the water saturation fraction increases from 0.3 to 0.7. Figure 4 shows that the variations in soil air radon concentration due to variation in the water saturation factor is an important factor affecting finally also the indoor radon concentrations.
Figure 4.

Soil radon concentration as a function of water saturation fraction of the soil pore volume.
Air permeability
Air permeability of the soil is the most important factor affecting the flow rate of radon-bearing soil air through gaps in the base floor into living spaces. Low permeability soils such as clay and silt reduce the leakage air flow compared with high permeability soils such as gravel and sand. The difference is explained by the high range of permeability that covers up to nine decades from coarse gravel (10−7 m2) to clay (10−16 m2). The typical air permeability for sand is from 10 to 10−12 m2. In real conditions, coarse aggregate layers below the floor slab increase air flows by a factor of 3–5 in the case of low permeability soils(40).
Increased soil water content reduces the air permeability in a roughly similar way as for the diffusion constant. Figure 3 presents the experimental results of Rogers and Nielson(20). The permeability normalised to dry soil permeability Kn is presented by Equation (10).
| (10) |
The dry soil permeability requires knowledge of soil porosity and the average diameter of the soil grain particles(20).
Implications for radon entry into houses
The radon-bearing soil air flowing into living spaces through the gaps in the foundation is affected by both the soil beneath the floor slab and soil masses outside the foundation perimeter. Soil beneath the floor area is not affected directly by rain waters. However, horizontal water movements can also affect the water content of soil layers directly beneath the floor slab. Drainage piping outside the foundation perimeter may also affect water movements.
The example calculations shown in Figures 2–5 indicate that the principal effect of increased water saturation factor is the increased soil air radon concentration at the depth of house foundations. Both partitioning of soil gas between air and water phases and reduction of the diffusivity are important factors. The changes in soil air radon concentration affect the indoor concentrations. However, at the same time, the air permeability of soil is also reduced. The effect of changes in permeability may be varying and depends strongly on permeability distribution with depth. The reduced permeability may decrease or redirect the soil air movement in the foundation surroundings. If only the upper soil layers (e.g. 0–30 cm) are close to saturated with water, the air flows towards the footings may come from greater distances, which increases the radon concentration of sub-foundation air(21).
Figure 5.
Variation in the monthly mean water saturation fraction of sand–moraine soil at a depth of 0–100 cm, Multia, Finland. Corresponding calculated radon concentration at a depth of 100 cm in soil pore air. Soil temperature measured at 90 cm was used.
An increase in the radon emanation factor directly increases the radon concentration in soil pore air. In the case of soils with a water saturation fraction above 0.1, the effect is not marked. In the case of warm climates and long dry periods, the marked changes in the emanation factor in the water saturation fraction range of 0–0.1 (Figure 1) should be taken into account.
Experimental studies confirm that radon transport in moisturised sand is much more complicated than in room-dry sand(21). The higher complexity is mainly due to partitioning, varying moisture content and diffusion.
The calculated temperature dependence implicates enhanced soil air and indoor radon concentrations, compared with winter concentrations.
RESULTS
Soil water measurements and soil gas radon concentration
Table 1 exhibits some hydrological properties of the soils in Multia and Nurmijärvi. In Multia, the median water saturation fraction is 46 %, showing that there is still plenty of free-air volume in the soil. In Nurmijärvi, at a depth of 60–100 cm, the corresponding figure is 85 % and at 0–60 cm 30 %. The calculated water movement in Nurmijärvi, 13–86 mm d−1, is faster than in the more fine-grained soil in Multia. In Multia, the 10th percentile of the daily water content distribution is 12 % and in Nurmijärvi it is 4 %, indicating that Multia soil is steadily moister than Nurmijärvi soil.
Table 1.
Hydrological features of Multia and Nurmijärvi soils.
| Multia |
Nurmijärvi |
|||
|---|---|---|---|---|
| 10th percentile | Median | 10th percentile | Median | |
| Water saturation fraction, 0–60 cm | 32 (11) % | 46 (15) % | 9 (3) % | 30 (10) % |
| Water saturation fraction, 60–100 cm | 37 (12) % | 46 (15) % | 13 (4) % | 85 (28) % |
| Calculated velocity, mm d−1 | 10–18 | 13–86 | ||
Distribution of the daily mean water saturation fraction (volumetric water content), 10th percentile and median. Calculated water velocity.
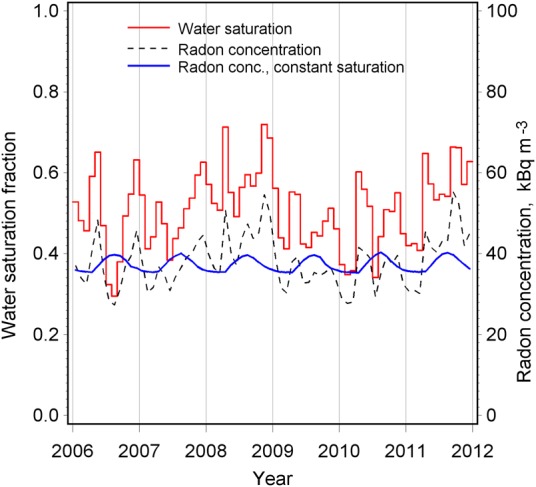
Figures 5 and 6 show the variation in the mean water saturation factor at a depth of 0–100 cm at two research sites in 2006–11 (Multia) and in 2002–8 (Nurmijärvi). The Multia site represents a sandy till, and the Nurmijärvi site represents poorly sorted esker sand. At the Multia site, water contents at depths of 0–50 cm and 50–100 cm were quite similar, with water content medians of 50 % (15 volume per cent). But at Nurmijärvi, the deepest (0.9 m) layer was normally very wet, nearly saturated, with water saturation fraction over 90 % (close to 30 volume per cent, 80 % of the d), or occasionally also dry, with water saturation fraction (content) below 30 % (<10 volume per cent, 15 % of the days). The Nurmijärvi site gets dry during low rain periods much easier, with the 10th percentile of water saturation distribution of 10 % (3 volume per cent) compared with more fine-grained soil at the Multia site, with the corresponding value of 30 % (10 volume per cent). The median water saturation values at a depth of 0–60 cm in Nurmijärvi are 30 % (10 volume per cent) and at a depth of 60–100 cm the values are 85 % (28 volume per cent). In dry periods, also deep gravel layers may dry effectively up to low water saturation factors.
Figure 6.

Variation in the monthly mean water saturation fraction in sand–moraine soil of an esker at a depth of 0–100 cm, Nurmijärvi, Finland. Corresponding calculated radon concentration at a depth of 100 cm in soil pore air. Soil temperature measured at 90 cm was used.
Figures 5 and 6 also demonstrate the variation in soil air radon concentration at a depth of 100 cm due to variation in soil water content; Equations 6, 8 and 9 have been used. The pattern of soil gas radon concentration follows the variation in soil water saturation. October–December is typically a period of rising water content and soil gas radon concentration. In winter, when soil is covered with snow, water content declines. In April, the melting waters increase the soil water content. In Nurmijärvi (Figure 6), winter 2002–3 represents a period when the coarse soil below the frozen soil surface remains dry for a period of 5 months. Autumn 2002 was a low rain period. Winter started already in mid-October and lasted until April 2003. At the same time, the calculated soil air radon concentration was only ∼50 % of its normal long-term average. In summer on coarse gravel soils, long warm and non-rainy periods also result in dry soil periods. The water saturation factor may come down to below 10 %, where the decrease in emanation factor comes into play as an important factor affecting soil gas radon concentration (Figure 1). In the case of more fine soil types where soil water fraction stays permanently above 10 %, the role of emanation factor is low.
Figures 5 and 6 show the variation in soil gas radon concentration calculated using a constant water saturation fraction calculated as the average over 6 y periods. These curves represent the effect of soil temperature variation. At the Multia site, the typical soil temperatures at a depth of 90 cm in summer and winter are 15 and 1°C. The variation causes a sinusoidal pattern within the range of 35–40 kBq m−3, the range representing a summertime increase of 14 %, compared with winter values.
Table 2 shows the variation in the measured soil water saturation factor and in the calculated monthly and annual average soil gas radon concentrations for the two measurement sites during 2002–11. The results show a marked variation with RSD of 18 and 35 % in the monthly results of water saturation factors and 17 and 26 %, respectively, in soil gas radon concentrations. The variation in the calculated annual average soil air radon concentration is lower, however still marked, the RSDs being 8.4 and 16 %. The variation is markedly lower in sand moraine than with in gravel.
Table 2.
Monthly variation in 2002–11 in soil water saturation fraction and in the calculated soil air radon concentration at a depth of 100 cm at two Finnish test sites.
| Test site | Multia | Nurmijärvia |
|---|---|---|
| Soil type | Sand moraine | Gravel |
| Water saturation fraction, monthly | ||
| Average | 0.51 | 0.51 |
| Minimum | 0.29 | 0.07 |
| Maximum | 0.72 | 0.81 |
| RSD | 18 % | 35 % |
| Soil gas radon kBq m−3, monthly | ||
| Average | 38 | 40 |
| Minimum | 27 | 20 |
| Maximum | 55 | 57 |
| RSD | 17 % | 26 % |
| Soil gas radon kBq m−3, annual | ||
| Average | 38 | 40 |
| Minimum | 35 | 29 |
| Maximum | 44 | 49 |
| RSD | 8.4 % | 16 % |
The mean water saturation factor at a depth of 0–100 cm has been used. Variation in the annual average soil air radon concentration during the same years.
aMeasurements from 2009 excluded due to lack of data.
Figure 7 shows the variation in the average water saturation factor calculated for the 12 months in the period of 2006–11 in Multia. The 6-y average filters out a lot of the year-specific monthly variation. The winter observation with low moisture values during the freezing period is characteristic for all soil types. The resulting pattern illustrates the general annual variation described above. The range of monthly soil gas radon concentration of 31–43 kBq m−3 represents 32 % of the average of 38 kBq m−3.
Figure 7.

The monthly average water saturation fraction variation in sand–moraine soil at a depth of 0–100 cm, Multia, Finland, 2006–11. Calculated monthly variation in soil air radon concentration at a depth of 100 cm in soil pore air. Soil temperature measured at 90 cm was used.
MEASUREMENTS OF SEASONAL VARIATION
Monthly measurements
Table 3 shows a summary of the monthly radon measurements in 326 houses. The mean, median and geometric mean of the annual average in all 326 houses were 181, 117 and 114 Bq m−3. The distribution of the results was lognormal. The results show a clear minimum in the summer. The mean of June–August was 109 Bq m−3, and for the other 9 months it was 209 Bq m−3. Surprisingly, radon concentrations in September were at the same level as those in January–February, the coldest period. Based on the previous modelling studies with constant soil gas radon concentration(4), maximum in winter and lower values in autumn were expected. This observation was one of the reasons for the soil moisture studies presented in this study.
Table 3.
Summary of the monthly indoor radon concentrations and of the ratio of monthly indoor radon concentration to the annual average (seasonality factor) measurements in 326 houses.
| Year | 1997 |
1996 |
||||||||||
|---|---|---|---|---|---|---|---|---|---|---|---|---|
| Month | 1 | 2 | 3 | 4 | 5 | 6 | 7 | 8 | 9 | 10 | 11 | 12 |
| Radon | ||||||||||||
| Mean, Bq m−3 | 225 | 225 | 203 | 209 | 163 | 109 | 103 | 114 | 209 | 210 | 193 | 216 |
| Median, Bq m−3 | 146 | 150 | 130 | 135 | 109 | 75 | 68 | 75 | 149 | 148 | 132 | 131 |
| Gmean, Bq m−3 | 139 | 140 | 124 | 132 | 108 | 73 | 73 | 79 | 144 | 137 | 120 | 136 |
| GSD | 2.7 | 2.7 | 2.7 | 2.6 | 2.5 | 2.4 | 2.3 | 2.3 | 2.4 | 2.6 | 2.7 | 2.5 |
| Seasonality factor | ||||||||||||
| Mean | 1.18 | 1.17 | 1.04 | 1.09 | 0.90 | 0.66 | 0.67 | 0.72 | 1.19 | 1.15 | 1.01 | 1.13 |
| RSD, % | 36 | 33 | 31 | 28 | 33 | 52 | 57 | 53 | 31 | 31 | 30 | 31 |
| Median | 1.15 | 1.15 | 1.04 | 1.07 | 0.89 | 0.60 | 0.62 | 0.65 | 1.14 | 1.13 | 1.01 | 1.09 |
| Gmean | 1.10 | 1.10 | 0.98 | 1.04 | 0.85 | 0.58 | 0.57 | 0.63 | 1.13 | 1.08 | 0.95 | 1.07 |
| GSD | 1.52 | 1.46 | 1.47 | 1.38 | 1.44 | 1.77 | 1.81 | 1.76 | 1.38 | 1.45 | 1.47 | 1.39 |
The study started in October 1996 (month 10) and was finished in September 1997 (month 9).
Figure 8 and Table 3 also show the monthly seasonality factor of the measurements in 326 houses. The concept of seasonality factor used here is defined as the ratio of the radon concentration of the period to the annual average. Therefore, it is the inverse of the seasonal correction factor used in many studies. When multiplying the result of indoor radon concentration measurement by the seasonal correction factor, one gets the annual average.
Figure 8.

Arithmetic and geometric mean and the GSD of the monthly seasonality factor of the 326 houses measured. The study started in October 1996 (month 10) and finished in September 1997 (month 9).
The gmean of the seasonality factor for the coldest half of the year November–April ranges from 0.95 to 1.10 and for the warmest months June–August from 0.57 to 0.63. The GSD of the seasonality factor for these periods ranges from 1.39 to 1.52 and from 1.76 to 1.81, respectively. Figure 8 illustrates this clear increase in summertime GSDs. The reason to the high GSD is most probably the increased airing through open windows and doors in summer. These practices vary from house to house, increasing the distribution in comparison with other months when only short-term airing through windows is normal. Opening windows very effectively decreases the pressure difference due to a radical reduction in the air-tightness of the house envelope(41) and increases the ventilation rate, resulting in a decrease in indoor radon concentration.
Due to the low radon concentration in summer and the clearly higher variation compared with the November–April period, radon measurements in households are recommended to be taken in November–April. The mean of the seasonality factors for this period is 1.10. This corresponds to the average seasonal correction factor of 0.91 for this half-year measurement period.
Measurement period and variation in seasonality factors
Table 4 shows the GSD of the seasonality factor for measurement periods with lengths of 1–11 months. The values have been calculated by summing the subsequent measurements using the length of the measurement as a weight factor. The table exhibits the results for January, March, June and October as a starting month. For a measurement of 1, 2 or 3 months starting in October, the GSDs are 1.45 1.29 and 1.22, respectively. The 95 % confidence interval for a distribution with a geometric mean (GM) and a GSD of 1.45 spans from GM/GSD2 to GM × GSD2. For 1- and 3-month periods with a GM of 1.0 and GSDs of 1.45 and 1.22, these spans are from 0.48 to 2.1 and from 0.67 to 1.48, respectively. Using a measurement period of 3 months markedly decreases the confidence interval of the estimated annual average radon activity concentration compared with 1-month measurements. Table 4 demonstrates clearly that inclusion of the warmest period of June–August to the measurement period decreases the accuracy of estimates of the annual average.
Table 4.
GSD of the ratio of indoor radon concentration during the period to the annual average, for measurement periods of 1–11 months, starting in January, March, June and October (alternatively February, May, August and November).
| Starting month | GSD, period/annual average radon concentration ratio |
||||||||||
|---|---|---|---|---|---|---|---|---|---|---|---|
| Duration of the period, months | |||||||||||
| 1 | 2 | 3 | 4 | 5 | 6 | 7 | 8 | 9 | 10 | 11 | |
| Jan | 1.52 | 1.37 | 1.29 | 1.23 | 1.17 | 1.14 | 1.11 | 1.11 | 1.08 | 1.05 | 1.04 |
| March | 1.47 | 1.29 | 1.21 | 1.17 | 1.17 | 1.18 | 1.15 | 1.12 | 1.10 | 1.06 | 1.03 |
| June | 1.77 | 1.61 | 1.58 | 1.33 | 1.23 | 1.18 | 1.12 | 1.08 | 1.06 | 1.04 | 1.03 |
| Oct | 1.45 | 1.29 | 1.22 | 1.19 | 1.19 | 1.18 | 1.16 | 1.13 | 1.10 | 1.07 | 1.05 |
Period averages were calculated from the consecutive one-month measurements in 326 houses.
The results of variation for periods longer than 1 month in this study were calculated as a weighted mean of the one-month measurements. In comparison with the measurements carried out using a single detector over periods of multiple months, the variation is slightly higher. Variation due to electrochemical etching of multiple radon films and also due to posting of the detectors are enhancing factors.
MODEL CALCULATIONS
Figure 9 demonstrates the results of modelling estimates and the comparison with measurements in 326 houses presented above. The model results were calculated using a convective radon entry rate, which, together with a radon entry rate from building materials of 1500 Bq h−1, gives an average radon concentration of 117 Bq m−3. This is the median of the annual average in all 326 houses. The model results shown in Figure 9 have been normalised to the annual average. The measured and calculated results with a constant soil air radon concentration exhibit a roughly similar pattern of annual variation with a clear minimum in the summer months. The most marked difference can be observed in September–October, when the model predicts a lower relative radon concentration compared with measurements.
Figure 9.

Geometric mean of the ratio of the monthly indoor radon concentration to the seasonal average in 326 Finnish houses. Subsequent monthly measurements beginning in October 1996 were used. Normalised monthly model predictions using a constant soil gas radon concentration. Corresponding monthly predictions using soil water saturation fraction corrections. Contribution from building material to the model predicted indoor radon concentration, based on a radon entry rate of 1500 Bq h−1.
Model calculations with constant soil air radon concentration show a maximum radon concentration for heating period and for the coldest months January and February. Both source strength and air exchange increase when the indoor–outdoor temperature difference is higher. However, the increase in source strength is stronger, due to the higher exponent of source term ΔT compared with the exponent in the air exchange term (Equations 1–3). In the case of dominating source strength from building materials, a maximum in summer would result. This is due to the higher natural air exchange rate in winter. Radon entry from building materials in winter represents <20 % of the total indoor radon concentration, while in summer the contribution is 20–30 % (Figure 9).
As an example of the effect of water saturation fraction and the resulting variation in soil gas radon concentration, Figure 9 exhibits two corrected model predictions using the mean monthly soil gas radon concentration at a depth of 100 cm in the Multia test site presented in Figure 7. The first correction was achieved by multiplying the constant soil air radon concentration with the normalised monthly averages presented in Figure 7. In the second correction, 50 % of radon concentration was assumed to be constant and 50 % was corrected as above. This correction can be justified by the fact that water content in soil masses below the slab is less affected by variations in the soil moisture in the surroundings of the house foundation. Furthermore, the soil air having its origin below the foundations is not affected by moisture variation as much as soil layers close the surface.
The first correction due to variation in soil water content in Figure 9 increases the November–December soil air and indoor air concentration due to rainfall at the end of the year decreases the January–March concentrations when soil is covered by snow and again increases the concentration in April when snow is melting. The second correction results in slightly more cautious estimate. The average for 2006–11 was used because water content measurements for the study period 1996–97 were not available. Easy and inexpensive technology for soil water measurements was introduced at the end of 1990s, which made it possible to start soil moisture surveys in the first years of the 2000s. Although the measurements for 1996–97 are lacking, the data are useful for this example comparison because the general autumn, winter and spring trends can be found from the patterns of most years in Figure 5. The year-to-year variation in seasonal rain and soil water content is marked and should be taken into account when estimating the results. The corrections presented are rough examples aiming at illustrating the effect of soil moisture.
Year-to-year variation
Figure 10 illustrates the year-to-year variation for the 13-year period of 2000–13. These results are calculated using the model with constant soil air radon concentration. The most marked reduction can be observed during warm winter periods and also during hot summers when the monthly average can be reduced by 20–30 % compared with the average summer concentration. A similar analysis for the 30-year period of 1983–2012 gives a RSD of 2.0 % for the annual average and the range of 113.8–122.4 Bq m−3, which is 7.3 % of the mean for the total period 117.8 Bq m−3.
Figure 10.
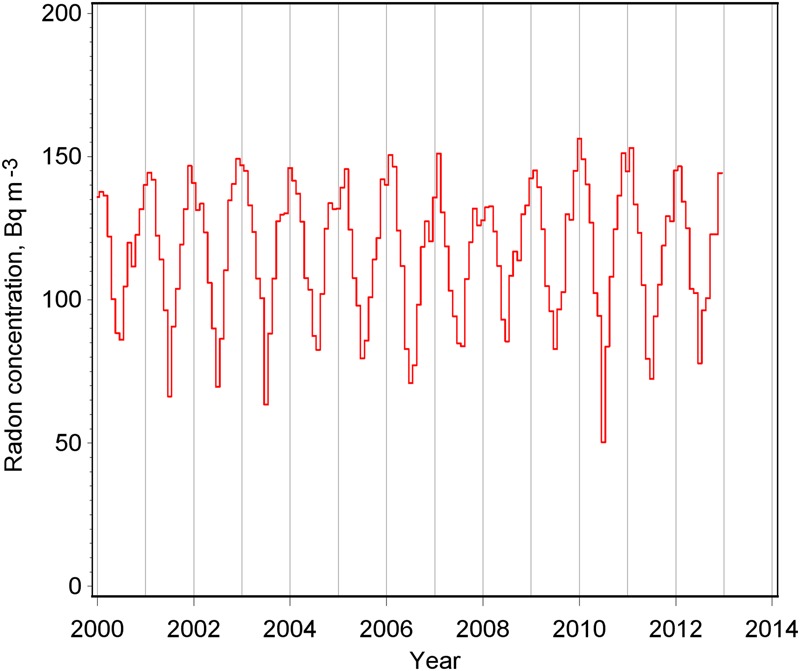
Model-based variation in the monthly average indoor radon concentration. A constant soil air radon concentration was assumed.
The estimated variation in the modelling results based on the constant soil gas radon concentration is markedly lower than the predicted variation due to variation in soil gas radon concentration. The site-specific RSD estimates were 8.6 and 16 % (Table 2).
DISCUSSION
The review of theoretical analysis evidently shows the marked effect of soil moisture on soil pore air radon concentration. Partitioning of radon gas between the water and air fractions of soil pores is the main factor increasing soil air radon concentration with the increasing water saturation factor. Soil temperature is also an important factor. Only a few studies have analysed soil air radon concentration together with measured soil water content. This lack of knowledge is partly due to the fact that new practical and cheap soil moisture probes did not become available until the end of the 1990s.
Pinault and Baubron(23) have concluded that soil gas radon concentration is controlled by soil moisture and temperature, not by atmospheric pressure. The results show a marked increase in soil gas radon concentration when soil moisture expressed as a water saturation fraction increased roughly from 0.2 to 0.5. Rise in the soil temperature from 7 to 25°C increased the soil air radon concentration by 10–15 %. This is in agreement with calculations presented in Figure 2, assuming that the reported soil moisture content of 6 g/100 g corresponds to a water saturation fraction of 0.3. This approximation is valid if the soil porosity is 0.3.
Long-term soil gas radon studies in a highly permeable sandy-gravelly soil in Hungary show a 2.5 times higher average soil gas radon concentration in winter than in summer(24). The average water saturation fraction in summer was 62 % and in winter 93 %. In comparison, the calculations presented in Figure 4 predict an increase by a factor of two for these moisture values at the depth of 0.8 m used in the Hungarian study.
The estimates of this study imply that the effect of variation in soil gas radon concentration is a more marked contributor to variations in the annual average indoor radon concentration than the variation in climatic parameters affecting radon entry into homes and the air exchange rate in houses. The latter results are presented in this study by the model estimates proposing a constant soil gas radon concentration. Depending of the soil type the RSD due to soil borne effects presented in Table 2 were 8–16 %. The corresponding constant soil gas model RSD, based on 30 y climatic data, was only 2 %.
Studies carried out over two decades in 98 Minnesota houses resulted in the year-to-year RSD of the annual mean of 14 %(11). The median radon concentration of the 98 houses was 120 Bq m−3, which is nearly equal with the median of Finnish houses(29). In the Minnesota material the only climatic variable that showed significant correlation with radon concentration was the total annual precipitation. However, the precipitation differences accounted for <10 % of the year-to-year variation. Based on the Finnish experience, the annual total precipitation figures do not alter significantly and in addition to the total precipitation many factors as temperature, hot periods, seasonal distribution of the precipitation, direct evaporation and evaporation through plants and trees affect the soil moisture at the depth of house foundations. Soil type is most important factor affecting the moisture level and the degree of variation(42). Table 2 describes variation measured in moraine and gravel. In the Minnesota study, houses in snowier climates tended to have higher radon variation, which is in agreement with the results of this study. Under snow cover, coarse soil types tend to get dry and the melting of snow causes a strong variation in soil moisture.
The dominant observation in seasonal variation is a higher indoor radon concentration in winter than in summer. In the current British(3, 6) and Irish(7) studies, the seasonality factors are ∼1.30 for the coldest winter months and 0.70 for midsummer. The latest British studies in 91 homes resulted in a mean seasonality factor of 1.14, corresponding to the seasonal correction factor of 0.88, for the 6-month periods starting in October(6). The average seasonality factor for November–April, predicted by the model of this study, is 1.15 (Figure 9). The measurements in 326 Finnish houses in this study gave a mean factor of 1.10. An earlier Finnish national random sample survey(29) in 2267 houses gave a corresponding geometric mean of the seasonal correction factor of 0.89.
An analysis of Irish indoor radon measurements in 5456 dwellings shows that there is a clear regional variation in seasonality of radon levels(7). The Irish study gives a brief literature review on the potential factors affecting the seasonal pattern observed in radon measurements, e.g. climatic variables in temperature and wind velocity, construction materials, occupancy patterns and air-conditioning systems. The present results indicate that also regional variation in soil types and water content is a potential factor affecting the seasonal variation. Regional variation in the contribution from building materials is also a potential factor. As the contribution from building materials increases, the probability of the summer maximum in seasonal variation increases.
The Swedish results on seasonal variation show a similar seasonal pattern in indoor radon concentration(5), but with a less pronounced summer minimum. Sweden is a neighbouring country of Finland. Variation in soil moisture is a potential contributor also to the Swedish results, where spring and autumn radon concentration are comparable with winter concentrations.
The calculated GSDs for measurement periods of different lengths (Table 4) are in reasonable agreement with the observed COV values of the 75 houses in Minnesota(10). In this Minnesota study, the COV was calculated as 100 × (GSD – 1), where GSD is the geometric standard deviation of the period/annual average radon concentration ratio (as in Table 4 of this study). The COV values for the Minnesota study for 1, 3 and 6 months were 40, 25 and 17 %, respectively. The corresponding values of this study for measurements starting in January are 52, 29 and 14 % and for measurements starting in October they are 45, 22 and 18 %. In the Minnesota study, the instrumental variation has been subtracted. In the results of Table 4, the instrumental variation is included.
The estimates of this study are based on many simplifications. In real housing environments, soil types, soil permeability, uranium concentration and soil water content vary with depth. These factors will cause house-to-house variation in the seasonal variation in indoor radon concentration. Further effect of moisture to the convective transport properties of soil has not been considered.
Ventilation through open windows in summertime affects indoor radon concentrations through increased air flows and also through decreasing the underpressure forcing the inflow of soil air into living spaces. This airing has not been taken into account in the modelling results. However, the observation in the 326 houses clearly show that due to the variation in ventilation practices the variation in the monthly seasonality factor is in summer markedly higher than in winter. Comparison with the model also shows that in June–July the observed indoor radon concentrations are lower than the model predicted values. The Nordic climate with a short summer provides good conditions for model comparisons because ventilation through windows is difficult to control. In countries with moderate or warm climate the effect of airing may be stronger.
CONCLUSIONS
Soil air radon concentration has been widely accepted as the main source of elevated indoor radon concentration. However, only little attention has been paid to the strong effect of soil moisture content and temporal variation in moisture on soil air radon concentration. This study presents a brief review on the physical phenomena contributing to moisture-related soil air radon variations. The calculations presented show that at a depth of 1 m, soil air radon concentration doubles when the water saturation fraction of soil increases from 0.3 to 0.7. This observation together with typical winter–summer soil moisture variations indicates that the effect of soil moisture affects markedly also the seasonal variation in indoor radon concentration.
The soil moisture content measured over a period of 6 y at two different research sites in Finland has been studied. The variation in soil moisture content affects a strong seasonal variation in soil air radon concentration. On two example test sites, the RSD of the calculated monthly average soil air radon concentration was 17 and 26 %.
In the numerical modelling of indoor radon concentrations, an average variation over a period of 6 y has been utilised. In this variation pattern, there are specific Nordic features due to snow and frozen soil surface in winter. In this period soil moisture content typically decreases. The variation pattern and the calculated effect on soil gas radon concentration provide a valuable example also to the countries with moderate or warm climate because typical moisture variation of a similar scale can be observed between different seasons.
The model predictions using constant soil gas radon concentration result in the maximum during the coldest months and the minimum in the summer. This behaviour is clearly visible in the monthly indoor radon measurements over a period of 1 y in 326 Finnish houses. However, radon concentrations in autumn and spring were higher than expected. Variation in soil moisture is a potential explanation for the observation. Increased soil moisture in autumn and spring, after the snow melt, increases soil gas radon concentrations by 10–20 % and makes the monthly average indoor radon concentrations comparable with the coldest months. High soil temperature in summer increased the calculated soil gas radon concentration by 14 % compared with winter values. The observed and estimated seasonal variation of indoor radon concentration is generally in agreement with seasonality studies from many countries.
The observed variation in seasonal correction factors or period/annual average indoor radon concentration ratios are high, e.g. the GSD of 1.29 for measurements with duration of 3 months starting in January. No marked difference was observed for different foundation types or ventilation strategies. Similarly, many radon studies report high year-to-year variation in the annual or seasonal average radon concentration. Soil properties and the seasonal variation in soil moisture are potential factors that can cause variation comparable to that caused by outdoor temperature.
The results presented in this study provide indirect evidence on the effect of soil moisture on indoor radon concentrations. Further studies, i.e. simultaneous measurements of soil moisture and soil air radon close to the house foundations and indoor radon measurements are needed to confirm the findings.
REFERENCES
- 1.Majborn B. Seasonal variations of radon concentrations in single-family houses with different sub-structures. Radiat. Prot. Dosim. 45, 443–447 (1992). [Google Scholar]
- 2.Miles J., Green B., Lomas P. Radon affected areas: Derbyshire, Northamptonshire and Somerset. Documents of the NRPB 3(4), 18–28. National Radiological Protection Board (1992).
- 3.Pinel J., Fearn T., Darby S. C., Miles J. C. H. Seasonal correction factors for indoor radon measurements in the United Kingdom. Radiat. Prot. Dosim. 58, 127–132 (1995). [Google Scholar]
- 4.Arvela H. Seasonal variation in radon concentration of 3000 dwellings with model comparisons. Radiat. Prot. Dosim. 59, 33–42 (1995). [Google Scholar]
- 5.Hubbard L. M., Mellander H., Swedjemark G. A. Studies on temporal variations of radon in Swedish single-family houses. Environ. Int. 22, 715–722 (1996). [Google Scholar]
- 6.Miles J., Howarth C., Hunter N. Seasonal variation of radon concentrations in UK homes. J. Radiol. Prot. 32, 275–287 (2012). [DOI] [PubMed] [Google Scholar]
- 7.Burke O., Murphy P. Regional variation of seasonal correction factors for indoor radon levels. Radiat. Measur. 46, 1168–1172 (2011). [Google Scholar]
- 8.Baysson H., Billon S., Laurier D., Rogel A., Tirmarche M. Seasonal correction factors for estimating radon exposure in dwellings in France. Radiat. Prot. Dosim. 104, 245–252 (2003). [DOI] [PubMed] [Google Scholar]
- 9.Bochicchio F., et al. Annual average and seasonal variations of residential radon concentration for all the Italian Regions. Radiat. Measur. 40, 686–694 (2005). [Google Scholar]
- 10.Steck D. J. Residential radon risk assessment: how well is it working in a high radon region. In: Proceedings of the Fifteenth Annual International Radon Symposium. San Diego, CA. Fletcher, NC: American Association of Radon Scientists and Technologists, pp. 1–13 (2005).
- 11.Steck D. J. Annual average indoor radon variations over two decades. Health Phys. 96, 37–47 (2009). [DOI] [PubMed] [Google Scholar]
- 12.Zhang Z., Smith B., Steck D., Quo Q., Field W. Variation in yearly residential radon concentration in the upper Midwest. Health Phys. 93, 288–297 (2007). [DOI] [PubMed] [Google Scholar]
- 13.Darby S., et al. Residential radon and lung cancer—detailed results of a collaborative analysis of individual data on 7148 persons with lung cancer and 14,208 persons without lung cancer from 13 epidemiological studies in Europe. Scand. J. Work Environ. Health 32, 1–84 (2006). [PubMed] [Google Scholar]
- 14.Heid I. M., Kuchenhoff H., Miles J., Kreienbrock L., Wichmann H. E. Two dimensions of measurement error: classical and Berkson error in residential radon exposure assessment. J. Exp. Anal. Environ. Epidemiol. 14, 365–377 (2004). [DOI] [PubMed] [Google Scholar]
- 15.Nazaroff W. W. Radon transport from soil to air. Rev. Geophys. 30, 137–160 (1992). [Google Scholar]
- 16.Wilson D. L., Gammage R. B., Dudney C. S., Saultz R. J. Summertime elevation of 222Rn levels in Huntsville, Alabama. Health Phys. 60, 189–197 (1991). [DOI] [PubMed] [Google Scholar]
- 17.Arvela H., Voutilainen A., Honkamaa T., Rosenberg A. High indoor radon variations and the thermal behavior of eskers. Health Phys. 67, 254–260 (1994). [DOI] [PubMed] [Google Scholar]
- 18.Sundal A. V., Valen V., Soldal O., Strand T. The influence of meteorological parameters on soil radon levels in permeable glacial sediments. Sci. Total Environ. 389, 418–428 (2008). [DOI] [PubMed] [Google Scholar]
- 19.Rose A. R., Ciolkosz E. J., Washington J. W. Effects of regional and seasonal variations in soil moisture and temperature on soil gas transport. In: Proceedings of the International Symposium on Radon and Radon Reduction Technology: Volume III. Preprints. EPA/600/9-90/005c. Atlanta, GA, USA; 19–23 February 1990. C-VI-5 (1990).
- 20.Rogers V. C., Nielson K. K. Multiphase radon generation and transport in porous materials. Health Phys. 60, 807–815 (1991). [DOI] [PubMed] [Google Scholar]
- 21.van der Spoel W. H., van der Graaf E. R., de Meijer R. J. Diffusive transport of radon in a column of moisturized sand. Health Phys. 77, 163–177 (1999). [DOI] [PubMed] [Google Scholar]
- 22.Andersen C. E. Numerical modelling of radon-222 entry into houses: an outline of techniques and results. Sci. Total Environ. 272, 33–42 (2001). [DOI] [PubMed] [Google Scholar]
- 23.Pinault J., Baubron J. Signal processing of soil gas radon, atmospheric pressure, moisture, and soil temperature data: a new approach for radon concentration modeling. J. Geophys. Res. 101, 3157–3171 (1996). [Google Scholar]
- 24.Szabó K. Z., Jordan G., Horváth Á, Szabó C. Dynamics of soil gas radon concentration in a highly permeable soil based on a long-term high temporal resolution observation series. J. Environ. Radioact. 124, 74–83 (2013). [DOI] [PubMed] [Google Scholar]
- 25.Grasty R. L. Summer outdoor radon variations in Canada and their relation to soil moisture. Health Phys. 66, 185–193 (1994). [DOI] [PubMed] [Google Scholar]
- 26.Sutinen R., Äikää O., Piekkari M., Hänninen P. Snowmelt infiltration through partially frozen soil in Finnish Lapland. Geophysica 45, 27–39 (2009). [Google Scholar]
- 27.Laine-Kaulio H. Development and analysis of a dual-permeability model for subsurface stormflow and solute transport in a forested hillslope. Aalto University Publication Series, Doctoral Dissertations 71 (2011). Available on http://lib.tkk.fi/Diss/. ISBN 978-952-60-4245-9. [Google Scholar]
- 28.Hänninen P., Laine-Kaulio H., Sutinen R. Macropores and preferential flowpaths in the vadose zone. Vesitalous, 3, 33–37 (2010), in Finnish. [Google Scholar]
- 29.Mäkeläinen I., Valmari T., Reisbacka H., Kinnunen T., Arvela H. Radon in Finnish dwellings—sample survey 2006. Report STUK-A242. Radiation and Nuclear Safety Authority—STUK (2009). Available on www.stuk.fi ISBN 978-952-478-506-8 (abstract in English).
- 30.Sherman M., Modera M. Comparison of Measured and Predicted Infiltration Using the LBL Infiltration Model. LBL-17001. Lawrence Berkeley Laboratory; (1984) [Google Scholar]
- 31.Jokisalo J., Kurnitski J., Korpi M., Kalamees T., Vinha J. Building leakage, infiltration, and energy performance analyses for Finnish detached houses. Build. Environ. 44, 377–387 (2009). [Google Scholar]
- 32.Clever H. L. Solubility Data Series. Volume 2. Krypton, Xenon and Radon-Gas Solubilities. Pergamon Press; (1979). [Google Scholar]
- 33.Sakoda A., Ishimori Y., Yamaoka K. A comprehensive review of radon emanation measurements for mineral, rock, soil, mill tailing and fly ash. Appl. Radiat. Isot. 69, 1422–1435 (2011). [DOI] [PubMed] [Google Scholar]
- 34.Tanner A. B. Radon migration in the ground: a supplementary review. Natural Radiation Environment III, Vol. 1, pp. 5–56 (1980). [Google Scholar]
- 35.Strong K. P., Levins D. M. Effect of moisture content on radon emanation from uranium ore and tailings. Health Phys. 42:27–32 (1982). [DOI] [PubMed] [Google Scholar]
- 36.Markkanen M., Arvela H. Radon emanation from soils. Radiat. Prot. Dosim. 45, 269–272 (1992). [Google Scholar]
- 37.Bossew P. The radon emanation power of building materials, soils and rocks. Appl. Radiat. Isot. 59, 389–392 (2003). [DOI] [PubMed] [Google Scholar]
- 38.Kemski J., Klingel R., Siehl A., Neznal M., Matolin M. Erarbeitung fachlicher Grundlagen zum Beurteilung der Vergleichbarkeit unterschiedlicher Messmethoden zur Bestimmung der Radonbodenluftkonzentration—Vorhaben 3609S10003: Bd. 2, Sachstandsbericht “Radonmessungen in der Bodenluft—Einflussfaktoren, Messverfahren, Bewertung”. Bundesamt für Strahlenschutz (BfS), BfS-RESFOR-63/12-Bd. 2 (2012).
- 39.Rogers V. C., Nielson K. K. Correlations for predicting air permeabilities and 222Rn diffusion coefficients of soils. Health Phys. 61, 225–230 (1991). [DOI] [PubMed] [Google Scholar]
- 40.Revzan K., Fisk W. Modeling radon entry into houses with basements. Indoor Air 2, 40–48 (1992). [Google Scholar]
- 41.Arvela H., Holmgren O., Reisbacka H., Vinha J. Review of low-energy construction, air tightness, ventilation strategies and indoor radon: results from Finnish houses and apartments. Radiat. Prot. Dosim. 162, 351–363 (2014). [DOI] [PubMed] [Google Scholar]
- 42.Liwata P., Hänninen P., Okkonen J., Sutinen R. Time-stability of soil water through boreal (60–68°N) gradient. J. Hydrol. 519, 1584–1593 (2014). [Google Scholar]