

Abstract
Physical activity interventions have recently become a popular strategy to help postmenopausal women prevent and manage obesity. The current systematic review evaluates the efficacy of physical activity interventions among overweight and obese postmenopausal women and sheds light on the behavioral change techniques that were employed in order to direct future research. Method. Five electronic databases were searched to identify all prospective RCT studies that examine the impact of physical activity on adiposity indicators, physical capacity, and/or mental health outcomes among healthy, sedentary overweight, and obese postmenopausal women in North America. The behavior change technique taxonomy was used to identify the various strategies applied in the programs. Results. Five RCTs met the inclusion criteria. The findings showed that adiposity indicators and physical capacity outcomes significantly improved following long-term interventions; however, mental health outcomes showed nonsignificant changes. Furthermore, 17 behavior change techniques were identified with the taxonomy across all trials. The intrapersonal-level techniques were the most common. Conclusion. Physical activity interventions had a positive effect on adiposity measures and physical capacity. Future research should focus on testing the effectiveness of physical activity interventions on mental health and incorporate strategies at the individual and environmental level to maximize the health impact on the population.
1. Introduction
Overweight/obesity is one of the most widespread health problems on a global scale [1] and the most significant contributor to poor health, exceeding both undernutrition and infectious diseases [2]. The issue has become a primary concern for public health officials and practitioners as more than 50% of Canadians and Americans are classified as either obese or overweight [3, 4]. In recent years, the prevalence of obesity and overweight has remained stable except among middle aged and older women; trends have continued to rise for this group [3]. In North America, the prevalence of obesity is higher among middle aged women (40–59 years old), followed closely by 60-year-old and older women (39.5% and 35.4%, resp.) [5]. The North American Menopause Society [6] noted that by 2025 the number of postmenopausal women is projected to increase substantially, and those who are overweight and obese will presumably need additional clinical care and weight intervention. Evidently, this subpopulation requires attention in order to understand and prevent such prospective trends.
Various health-related consequences have been associated with excessive body weight. Overweight and obesity can have adverse effects on nearly every aspect of health from contributing to chronic conditions such as osteoarthritis [7] to interfering with sexual function [8], breathing [9], mood [10], and social interactions [11]. More specifically, Yatsuya et al. [12] found that the hazard ratio of stroke increased with higher levels of body mass index (BMI) among obese black and white women (1.10, 95% Confidence Interval (CI) (0.97, 1.24); 1.25, 95% CI (1.07, 1.46), resp.). Among older women, more severe vasomotor symptoms (e.g., night sweat and hot flashes) during the menopause transition and postmenopausal phase are experienced as BMI increases [6]. Overweight and obese postmenopausal women also experience increased risk for type II diabetes, breast cancer, coronary heart disease, and depression. For instance, a meta-analysis of 18 cohort studies [13] found that the relative risk of type II diabetes for obese men and women compared to normal weight individuals was 7.19 (95% CI (5.74, 9.00)) and for overweight men and women was 2.99 (95% CI (2.42, 3.72)). Based on a pooled analysis of 7 cohort studies [14], the relative risk of breast cancer among overweight postmenopausal women was 1.26 (95% CI (1.09, 1.46)). A longitudinal study by Li et al. [15] found that the relative risk of coronary heart disease was 3.44 (95% CI (2.81, 4.21)) for women who were obese (BMI ≥ 30 kg/m2) and sedentary (exercise < 1 hr/wk), 2.48 (95% CI (1.84, 3.34)) for women who were active but obese, and 1.48 (95% CI (1.24, 1.77)) for women who had a healthy weight but were sedentary compared to the normal BMI and physically active group. Even modest weight gain (8 to 20 pounds) during adulthood was associated with 27% (95% CI (12% to 45%)) increased risk of coronary heart disease compared to women with a stable weight after adjusting for physical activity and other cardiovascular risk factors. Based on a meta-analysis of longitudinal survey studies [16], the pooled odds ratio for the association between obesity at baseline (time 1) and increased depression at follow-up (time 2) was 1.55 (95% CI (1.22, 1.98)). The status of overweight at baseline also increased the risk of onset of depression at follow-up (odds ratio 1.27, 95% CI (1.07, 1.51)).
According to Rosano et al. [17], the major risks associated with being overweight tend to be experienced by those who drastically gain weight during midlife adulthood. Body weight in women tends to steadily increase from the late 20s to 60 years of age with the greatest increase in weight occurring shortly after menopause or during the 5th decade [18]. The increase in weight during the menopause stage and beyond is most harmful for women [19]. Therefore, many overweight sedentary postmenopausal women experience negative effects such as high blood pressure and the aforementioned conditions, which can elicit other serious health problems [20].
Engaging in regular moderate physical activity is strongly associated with better physical and psychological health outcomes and has been shown to reduce negative effects associated with overweight and obesity [21, 22]. For example, physical activity was found to reduce abdominal fat and total percentage of body fat even without changes in body weight [23]. A study by McCullough et al. [24] found that mild or intense physical activity may reduce the risk of breast cancer. Furthermore, a review by Paluska and Schwenk [25] reported that physical activity was associated with reduced depressive and acute anxiety symptoms.
Wen et al. [26] found that even small changes or adjustments in health behaviors can have an impact on overall health. Based on their cohort study, individuals in the low activity group who exercised for an average of 92 minutes per week (95% CI (71.0, 112.0)) or 15 minutes a day (SD = 1.8) had a 14% reduced risk of all-cause mortality (hazard ratio 0.86, 95% CI (0.81–0.91)) and a 3-year longer life expectancy compared to the inactive group. The benefits were found for all age groups (20–39, 40–59, and ≥60) and for both men and women. A meta-analysis conducted at the Harvard School of Public Health [27] found that as little as 150 minutes (2.5 hours) of physical activity a week can significantly reduce the risk of heart disease by approximately 14% among adult men and women. About 300 minutes (5 hours) a week reduced the risk of heart disease including heart attacks, angina, and bypass surgeries by 20% compared to adults who did not engage in physical activity. The study also found that physical activity had a significantly stronger effect in reducing the risk of heart disease in adult women (33%) compared to adult men (22%). The benefits associated with minimal behavior change in terms of physical activity are abundant, and such changes are deemed crucial in the prevention and treatment of obesity.
Sustained physical activity is necessary to achieve health benefits. According to Peterson and Ward-Smith [18], short-term benefits of physical activity among overweight and obese women are limited to less fatigue and increased cardiovascular fitness as opposed to weight loss, whereas the long-term effects of physical activity are weight loss and improved physical fitness to help overweight and obese women achieve an ideal weight and standard of living [18]. Some studies have also documented that long-term physical activity significantly improves psychological functioning [28]. A review by Folkins and Sime [29] found that long-term physical activity improved self-confidence and self-esteem in male and female children and adults. Adult men who were subjected to a long-term intervention demonstrated reduced mental stress [30] and reduced Type A behaviors (i.e., competitive and aggressive behaviors) [31]. However, consensus for the particular effects of long-term physical activity on postmenopausal populations is less clear because a synthesis of the research is yet to be provided in the literature. Evaluating the efficacy of long-term (≥6 months) physical activity interventions among both overweight and obese postmenopausal women is warranted.
The current systematic review will evaluate the efficacy of physical activity interventions on adiposity indicators, physical capacity measures, and mental health outcomes among sedentary overweight/obese postmenopausal women. Another goal of the review is to identify the various behavioral change techniques that were employed in the interventions to help inform future research and interventions that target this growing population.
2. Methods
2.1. Data Sources and Search Strategies
Five electronic databases, MEDLINE, Cochrane CENTRAL, PubMed, PsycINFO, and Web of Science, were searched for relevant studies from the past 10 years. Reference lists of all included studies were searched for further relevant studies. The search terms included obesity terms and physical activity terms as well as filters for randomized controlled trials (RCTs), human subjects, English articles, adult females, and being published between January 2005 and June 2015.
2.2. Inclusion Criteria
Articles were selected based on several inclusion criteria.
2.2.1. Types of Studies
Published RCTs providing ≥6 months of follow-up data after randomization were included. Interventions that were less than 6 months were excluded because previous researches have used a 6-month cut-off when evaluating metabolic, biochemical, haematological, and muscular change from physical activity interventions [32, 33].
2.2.2. Types of Participants
Studies were included if the sample is comprised of postmenopausal women living in Canada or the United States because the current levels of physical activity are very much alike. Based on Canadian statistics, it was revealed that fewer than 20% of Canadians do enough exercise [34]. Based on the Centers for Disease Control and Prevention [35], less than 20% of Americans meet the aerobic and muscular activity recommendations. Furthermore, participants had to be overweight or obese (BMI ≥ 25.0), sedentary, healthy, and capable of completing the physical activity program. Studies were included if the sample was comprised of postmenopausal women and men, provided that the findings were reported separately for women. Studies were excluded if the participants had a major medical disorder or condition such as cardiovascular disease, diabetes, or recovering from a stroke.
2.2.3. Types of Interventions
All studies had to contain a physical activity intervention component. Studies that included several groups, diet-only, diet and physical activity, physical activity-only, and the control study arm, were only included if the results of physical activity-only versus the control group were provided. Diet-only interventions were excluded. All types of physical activity interventions such as walking, bicycling, aerobics, stretching, yoga, and resistance training were included while studies with rehabilitation physical activity were excluded.
2.2.4. Types of Outcome Measures
The outcomes included various adiposity, physical capacity, and mental health measures. The adiposity indicators include body weight, total and percentage of fat mass, lean body mass, intra-abdominal and subcutaneous fat, and waist and hip circumference. The physical capacity measures include physical performance, maximal fitness, and pedometer reading. Finally, the mental health outcomes include anxiety, depression, stress, and quality of life. Biochemical outcomes such as level of oxidative stress, C-reactive protein, low- or high-density lipoprotein, and levels of vitamin D were excluded because the literature vastly covers this domain with meta-analyses [36, 37].
2.3. Study Selection
Initially, titles were reviewed to ascertain the potential fit to the inclusion criteria. If the relevance was doubted during the title review, a subsequent assessment was conducted. The list of potential articles was further shortened by reviewing abstracts and performing detailed evaluations of Sections 2 and 3 of each remaining article (see Figure 1 for the progressive flow of the study exclusion process). Decisions for inclusion were made and verified by one reviewer (AB). If multiple articles were published from the same sample, the article with the most detailed report for each type of physical activity was included and the other reports were only included if they provided new analyses for different outcome variables.
Figure 1.
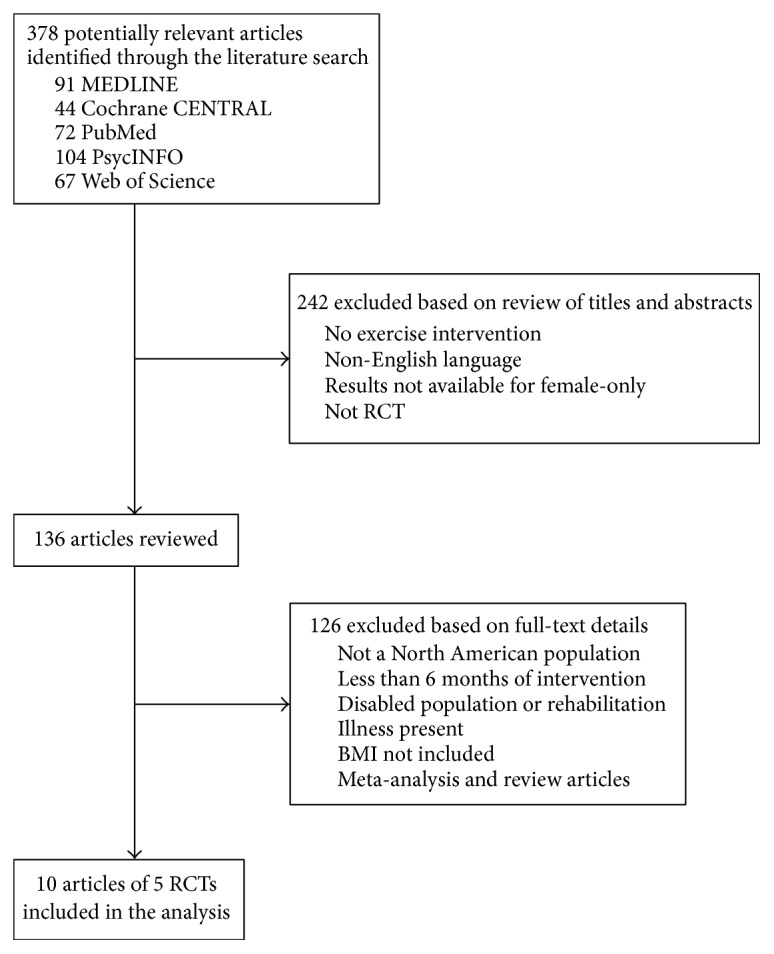
The progressive flow of the study exclusion process.
2.4. Data Extraction
2.4.1. Risk of Bias
The Cochrane Collaboration tool from the Cochrane Handbook for Systematic Reviews of Interventions [38] was employed to assess the risk of bias for each study. The items in the Cochrane risk of bias assessment include randomization, allocation concealment, blinding of participants and personnel, blinding of outcome assessors, incomplete data, and selective reporting. In addition, the risk of bias for the time of year in which the training took place, trainer qualifications for administration of the intervention, and the suitability of recruitment was assessed using the Cochrane Criteria.
2.4.2. Outcome Data
One researcher (AB) extracted the data for all outcome measures on adiposity, physical capacity, and mental health. Outcome variables were assessed by a wide variety of measures. The adiposity indicators were relatively homogeneous and measured the variable distinctly (i.e., weight, BMI, and circumference, each measuring body size or mass). Similarly, the physical capacity measures distinctly evaluated capability (i.e., maximal fitness, speed, and performance). The mental health outcomes, however, covered an assortment of variables (i.e., stress, anxiety, depression, and quality of life).
2.4.3. Technique Taxonomy
Interventions that are designed to change behavior, such as increasing physical activity among postmenopausal women, are often versatile and incorporate a number of interacting techniques [39]. When strategies are not clearly described or labelled, challenges for replication and application arise [40, 41]. Indeed, current reporting of techniques in published articles is generally poor and frequently omits details making it difficult to analyze and synthesize [42]. According to Michie et al. [43], the lack of such information reduces the reliability and usefulness of the research. To deal with the difficulty, Michie et al. [41, 43, 44] established a comprehensive list of technique classifications based on past behavior change interventions and psychology. The taxonomy is useful for identifying and coding the various methods and techniques applied in any intervention. It provides a system for researchers and clinicians to report interventions in a reliable and universal style. The international behavior change technique taxonomy was applied to the RCTs to identify and summarize the common and/or unique techniques involved. The use of the taxonomy will help describe weight loss program interventions and has the potential to expand weight control study methodologies to improve results, as well as permitting better analyses of multiple studies. Applying the taxonomy to obesity intervention programs among postmenopausal women, according to our knowledge, has not been undertaken. It is an essential segment in the current review paper because experts in intervention design and training are pushing for standardized reports to ease the practices necessary for synthesis in research [45]. To reduce coding biases, two researchers (AB and HSL) extracted the data and coded each intervention technique separately based on Michie's taxonomy system [41]. Any discrepancy in coding was discussed and reviewed until consensus was reached.
2.5. Data Analysis
First, the findings from the RCTs were summarized in Table 1. The results for the adiposity indicators, physical capacity measures, and mental health outcomes that were reported in two or more of the trials were subjected to a more thorough observational analysis described in the next section. Finally, the technique taxonomy was applied to each RCT in order to effectively analyze the intervention methods.
Table 1.
Study descriptions and summary of results: randomized controlled trials in North American populations.
| Study acronym and source | Recruitment | Population | Duration, months | Number of subjects | Intervention and control description | Intervention details | Outcome variables | Results |
|---|---|---|---|---|---|---|---|---|
| PATH | ||||||||
| Bowen et al., 2006 [49] | Mass mailings and media placements (American) | 50–75 years, otherwise healthy, sedentary, BMI ≥ 25, women after menopause | 12 | 173 | PA intervention: 45 min of moderate-intensity aerobic exercise 5 days/week (incl. walking, bicycling, and aerobics). Participants attended at least three mandatory training sessions held at the facility supervised by an exercise psychologist for months 1–3. The remaining two sessions were to be done at home. In months 4–12, participants had to attend at least one session/week at the facility and exercise at home for the remaining days. Some resistance training was recommended. Control: 45 min stretching session once/week for the year. |
Daily activity log to record type of exercise, duration, peak heart rate, and rating of perceived exertion for all sport and recreational activities. Questionnaires at baseline and 12 months, and Polar HR monitors. |
Anxiety and depression: subscales from the Brief Symptom Inventory (BSI). Perceived stress scale: measures stress response to events from the last month. |
No significant difference in mental health at 12 months between groups. No significant difference was found for anxiety and depression between groups at 12 months. Perceived stress did not differ significantly between groups at 12 months. Yet, perceived stress improved significantly among the control group between baseline and 12 months. |
| Campbell et al., 2010 [50] | Maximal O2 uptake (cardiorespiratory fitness) measured with treadmill test. Anthropometry: weight, waist and hip circumference, total body fat and percentage of body fat, and lean body mass. Intra-abdominal and subcutaneous fat measured by medical scan |
Exercisers significantly increased in maximal fitness compared to control group (p = 0.0001). At the end of 12 months, exercisers decreased body weight (p = 0.007), body fat percentage (p = 0.001), intra-abdominal fat (p = 0.045), and subcutaneous fat in exercisers (p = 0.003) compared to the control group. Waist circumference significantly decreased among exercisers compared to the control group (p < 0.05). No significant difference between exercisers and the control group in change in lean body mass after 12 months. |
||||||
|
| ||||||||
| NEW | ||||||||
| Foster-Schubert et al., 2012 [51] | Mass mailing campaigns, media publicity, or community outreach prompted calls (American) | 50–75 years, otherwise healthy, sedentary, BMI ≥ 25, women after menopause | 12 | 204 (PA-only and control group) | PA intervention: 45 min of moderate-intensity aerobic exercise 5 days/week (walking/hiking, bicycling, and aerobics). Participants attended at least three mandatory training sessions held at the facility and supervised by an exercise psychologist. These sessions included use of treadmill, stationary bike, and other aerobic machines. The remaining two sessions were to be done at home. Some resistance training was encouraged to prevent injury. Within the first 7 weeks, PA sessions were 15 minutes at 60–70% observed maximal heart rate and gradually worked up to 70–85% where they continued for the duration of the study. Control: no change to habits or lifestyle. |
Activity log to record type of exercise, duration, peak heart rate, and rating of perceived exertion. Use of Polar HR monitors and pedometer. |
Anthropometry: body weight waist circumference Body composition: percentage body fat and lean body mass. Maximal fitness measured with treadmill test. Pedometer reading measured steps walked/week. |
Among exercisers, body weight decreased significantly (p = 0.034) compared to the control group. Waist circumference and percentage of body fat decreased significantly among exercisers compared to the control group (p = 0.001 and p < 0.0001, resp.). Lean body mass did not differ significantly across the two groups. Exercisers were classified in 1 of 3 categories for further analysis: highly active (≥196 min/week physical activity), intermediate active (154–196 min/week), and low active (<154 min/week). Women in the highly active group lost the most weight (p < 0.0001) relative to the other groups and the controls. The same trend was found for BMI, waist circumference, percentage of body fat, maximal fitness, and change in pedometer steps/week. Hence, highly active exercisers demonstrated the largest change compared to all other exercise groups. |
| Imayama et al., 2011 [52] | Mass mailings and media placements (American) | Maximal fitness measured with treadmill test. Depression and anxiety: Brief Symptom Inventory-18. Stress: Perceived Stress Scale. |
Maximal fitness increased significantly in exercisers compared to controls after the 12 months (p < 0.001). Perceived stress, anxiety, and depression scores did not significantly change among exercisers compared to controls. Social support was nonsignificant between groups after the 12 months. |
|||||
|
| ||||||||
| DREW | ||||||||
| Church et al., 2007 [88] | Ads in newspaper, radio, television, community events, and mass mail (American) | 45–75 years, otherwise healthy, sedentary, BMI 25–43, women after menopause | 6 | 464 | PA intervention group 1: participants attended 4 training sessions/week which included cycling and treadmill expending 4 kilocalories per kilogram of body weight per week. Energy expenditure level is about 50%. PA intervention group 2: participants attended 4 training sessions/week which included cycling and treadmill expending 8 kcal per kg/week. Energy expenditure level is about 100% PA intervention group 3: participants attended 4 training sessions/week which included cycling and treadmill expending 12 kcal per kg/week. Energy expenditure level is about 150% All intervention groups experienced moderate-to-vigorous intensity activity. Groups differed by amount of time spent exercising. Control group: asked to maintain current lifestyle |
Trainers documented progress. HR monitors and pedometers were used. |
Pedometer measures steps/day. Fitness measures: peak maximal fitness, peak relative fitness per min, and maximal power output, measured with treadmill test. Weight, body fat percentage, and waist circumference |
After the 6 months, there were no significant differences on steps per day across all the groups. For all 3 fitness measures, each exercise dose had a significantly higher impact compared to the control group (p < 0.001 for each group). There was no significant difference in weight or body fat percentage. Waist circumference was significantly smaller in all 3 exercise groups compared to the control group (p < 0.05 for each). The dose of exercise has an incremental effect on the results. |
| Martin et al., 2009 [47] | Ads in local community and team recruitment in minorities communities (American) | 430 | Quality of life (QOL): Medical Outcomes Study Short Form Health Survey (SF-36) that measures physical (4 subscales) and mental (4 subscales) QOL body weight. Maximal O2 uptake (cardiorespiratory fitness) measured with cycling test. |
A significant dose-response effect of exercise on QOL was found for 3 of 4 subscales of physical health (i.e., physical functioning, role limitations due to physical problems, and general health perception) and 4 of 4 scales of mental health (role limitations due to emotional problems, social functioning, vitality, and mental health). Post hoc analysis demonstrated that the 12 kcal per kg/week group significantly improved QOL compared to the controls. The 4 kcal per kg/week group significantly improved general health, vitality, and mental health. Body weight and maximal fitness had no effect on QoL outcomes. |
||||
| Sisson et al., 2009 [48] | Ads in local community and team recruitment in community (American) | 464 | Maximal O2 uptake (cardiorespiratory fitness) measured with cycling test. | A significant difference in maximal aerobic fitness was found for all pairwise treatment group comparisons except 4 kcal per kg/week versus 8 kcal per kg/week. | ||||
|
| ||||||||
| WOMAN | ||||||||
| Gabriel et al., 2011 [53] | Direct mailing from selected ZIP codes (American) | 52–62 years, otherwise healthy, sedentary, BMI 25–39.9, women after menopause | 48 | 508 | Intervention: 150 minutes per week of moderate-intensity activity similar to brisk walking. Participant contact was extensive and included 40 group visits in first year, 12 monthly visits in years 2 and 3, and no visits in year 4. Visits included a 400-meter walk as fast as possible and physical activity follow-up questionnaire Control: health education group received 6 lectures in year 1 and then quarterly thereafter but was not instructed to change lifestyle. |
Evaluated at 6 months and then annually using 400-meter walk test and MAQ interview-administered questionnaire by specialists. Daily diary was used to log PA every day and monitor adherence. |
400-meter walk: 10 laps along a hallway with cones set 20 m apart at a pace that could be maintained the whole duration. Leisure time physical activity (LTPA): measured with subscale of Modifiable Activity Questionnaire (MAQ) which assessed leisure activity over the year Body composition: measure with weight, BMI, waist circumference, and body fat mass. |
The exercise group had significantly lower 400-meter walk times compared to the control group (p < 0.04). While the exercisers walk time decreased, the control group had no significant change in walk times after the 48 months. Exercisers also had significantly decreased body weight, BMI, waist circumference, and trunk fat mass compared to the control group (p < 0.04). For the exercise group, increased LTPA and decreased body weight, BMI, waist circumference, and whole body fat mass were significantly associated with reductions in 400 m walk time from baseline to 48 months (all p < 0.01). |
|
| ||||||||
| ALPHA | ||||||||
| Friedenreich et al., 2011 [54] | Targeted mailings, posters, brochures, and media campaigns (Canadian) | 50–74 years, otherwise healthy, sedentary, BMI 22–40, women after menopause | 12 | 320 | Intervention: participants were instructed to complete 45 min of moderate-to-vigorous intensity aerobic exercise 5 days/week. Within the first 3 months, subjects gradually worked up to 70–80% of their heart rate reserve and then remained at 70–80%. Three mandatory sessions/week were held at the facility with specialized trainers. The remaining 2 sessions were home-based. A warm-up and cool-down of 5–10 minutes were encouraged and carried out at the facility training sessions. Control: asked to maintain current lifestyle. |
Daily exercise log and Polar HR monitors. | Maximal fitness was measured with a treadmill test. Energy intake and adiposity measured with intra-abdominal and subcutaneous fat via medical scan. Weight, BMI, waist and hip circumference, body fat, percentage of body fat, and lean body mass were measured using X-ray scans. |
Maximal fitness increased significantly more in exercisers compared to controls (p < 0.001). Mean energy intake decreased among controls relative to exercisers (p = 0.01). The mean decrease in adiposity between baseline and 12 months was significantly greater in exercisers compared to controls (p < 0.001). Weight, BMI, waist circumference, hip circumference, percentage of body fat, and abdominal fat area all significantly decreased among exercisers compared to the control group. Lean body mass was not significantly different among exercisers and the control group (p = 0.564). Lean body mass did not change for exercisers and decreased slightly for the control group. |
3. Results
The search identified 378 potential articles and, following a review of the titles and abstracts, only 136 met the inclusion criteria. Examination of Sections 2 and 3 prompted the exclusion of 127 articles. As a result, 9 articles from five RCTs remained that met the inclusion criteria. Three articles were from the Dose Response to Exercise (DREW) study [46–48], two articles were from the Physical Activity for Total Health (PATH) study [49, 50], two articles were from the Nutrition and Exercise for Women (NEW) study [51, 52], one article was from the Women on the Move through Activity and Nutrition (WOMAN) study [53], and one article was from the Alberta Physical Activity and Breast Cancer Prevention (ALPHA) study [54] (see Table 1 for a summary).
3.1. Overall Description of Studies
3.1.1. Participants
The studies evaluated a total of 1,669 participants from five different samples. The mean age across all samples was 58.8 (range from 57 to 61 years). The five studies included only female participants. The mean BMI across all studies was 30.5 (range 29.2 to 31.8). Across all five studies, the samples consisted mostly of non-Hispanic white women. In four studies, the majority of the samples were highly educated with at least some college education. In terms of employment, 29%, 50%, and 69.5% of women reported working full time in three of the studies, while in two studies they did not report statistics on employment.
3.1.2. Intervention Location
Most RCTs were conducted in the United States (n = 4) and one was conducted in Canada. All studies were carried out in metropolitan centers.
3.1.3. Study Design
All studies were parallel-group RCTs (i.e., each participant was randomly assigned to a study arm, and all the participants in each study arm either received or did not receive the intervention) allowing for comparison of physical activity-only intervention against a control or waitlist group. One intervention [51, 52] had comparisons between several groups including physical activity-only, diet-only, diet and physical activity, and a control group; the methods and results pertaining to diet-only and diet and physical activity groups were excluded in the analysis to focus solely on the efficacy of physical activity-only groups versus the control.
3.1.4. Intervention Duration and Intensity
The modal duration of intervention was 12 months (n = 3), ranging from 6 to 48 months. Intervention effects are summarized for end-of-trial comparisons only. Any follow-up prior to the end of the study is not part of the evaluation since the long-term effects are of interest.
Intensity of contact with interventionists varied across intervention groups and ranged from 1 to 4 times a week for the duration of the intervention. One study stopped contact after 24 months due to lack of funding [53]. The participants associated with the program that ceased training were expected to continue to follow the physical activity guide on their own for the remaining 24 months of the program. High-intensity contact interventions were primarily exercise classes or training groups with a specialized trainer such as an exercise psychologist or physiologist.
3.1.5. Description of Intervention Techniques
All of the trials (n = 5) had comparable physical activity programs as they all applied some form of aerobics exercise at a moderate-to-vigorous intensity (refer to Table 1 for details). Three studies required physical activity that persisted for 45 minutes for 5 days per week, one study required physical activity 4 days a week with varying durations, and one study did not indicate how many days per week but rather indicated a minimum of 150 minutes per week (see Table 2 for a summary of the means). Each RCT measured moderate-to-vigorous intensity physical activity equivalent to a 3.0 or greater Metabolic Equivalent of Task (MET) level, based on the Compendium of Physical Activities [55]. Less than 3.0 MET refers to light physical activity (such as standing, using a computer, and light walking), 3.0–6.0 MET is moderate physical activity (including heavy cleaning, brisk walking, or light sport), and >6.0 MET aligns with vigorous physical activity (such as hiking, jogging, or shovelling). Each study encouraged the participants to use an assortment of equipment to activate different muscle groups and prevent injury.
Table 2.
Physical activity descriptions and means.
| Study | Aerobics activity | Average minutes of physical activity per week | Average heart rate |
|---|---|---|---|
| PATH | Cycling, walking, aerobics, and some resistance training | 171.3 | 60–70 |
| NEW | Cycling, walking, and aerobics | 225 | 80 |
| ALPHA | Cycling, walking, and aerobics | 178.5 | 62.2 |
| DREW | |||
| Low dose | Cycling and walking | 72.2 | 55.1 |
| Moderate dose | Cycling and walking | 135.8 | 76.2 |
| High dose | Cycling and walking | 191.7 | 80.7 |
| WOMAN | Fast walking | 150 | — |
3.2. Observational Study Results
3.2.1. Risk of Bias
The trials did not show a high risk of bias on any of the items of the Cochrane Collaboration tool nor for the additional biases considered (the season in which the training took place, trainer qualifications for administration of the intervention, and the suitability of recruitment), which suggests that the interpretation of the results should not be affected by the study design and implementation methods.
3.2.2. Effects of Interventions
Please refer to Table 3 for the details of each analysis and reported results.
Table 3.
Details of the analyses and results per RCT.
| Intervention | Authors | Type of analysis | Outcome variables | Results |
|---|---|---|---|---|
| PATH | Bowen et al., 2006 [49] | Between-group analyses | Perceived stress | No significant difference |
| Anxiety | No significant difference | |||
| Depression | No significant difference | |||
| General mental health | No significant difference | |||
| Physical functioning | Significantly improved among intervention group compared to control group | |||
| Social support: emotional | No significant difference | |||
| Social support: affection | Significantly higher for the control group compared to the exercisers | |||
| Social support: tangible | No significant difference | |||
| Social support: overall | No significant difference | |||
| Within-group analyses | Perceived stress | No significant difference | ||
| Anxiety | No significant difference | |||
| Depression | (i) No significant difference between baseline and 12-month follow-up for intervention group (ii) Control group of stretchers significantly improved on depression after 12 months |
|||
| General mental health | (i) Significantly improved between baseline and 12-month follow-up for intervention group (ii) No significant difference for participants in the control group |
|||
| Physical functioning | (i) No significant difference between baseline and 12-month follow-up for intervention group (ii) Control group of stretchers significantly improved on physical functioning after 12 months |
|||
| Social support: emotional | No significant difference | |||
| Social support: affection | (i) No significant difference between baseline and 12-month follow-up for intervention group (ii) Control group of stretchers significantly improved on affection subscale after 12 months |
|||
| Social support: tangible | No significant difference | |||
| Social support: overall | No significant difference | |||
| Campbell et al., 2010 [50] | Between-group analyses | VO2 max | Significantly increased by 13.6% compared to the 0.2% increase in the control group | |
| Body weight | Significantly decreased by 1.3 kg compared to the 0.3 kg decrease in the control group | |||
| Percent of body fat | Significantly decreased by 1.4% compared to the 0.1% decrease in the control group | |||
| Intra-abdominal fat | Significantly decreased compared to the control group | |||
| Subcutaneous fat | Significantly decreased compared to the control group | |||
| Waist circumference | Significantly decreased compared to the control group | |||
| Lean body mass | No significant difference | |||
|
| ||||
| NEW | Foster-Schubert et al., 2012 [51] | Between-group analyses | Pedometer steps | Significantly increased by 42% compared to the control group |
| VO2 max | Significantly increased by 9% compared to the control group | |||
| Body weight | Significantly decreased by 2.0 kg compared to the 0.7 kg decrease in the control group | |||
| Waist circumference | Significantly decreased by 2.0 cm compared to the 0.9 cm decrease in the control group | |||
| Percent of body fat | Significantly decreased by 1.6% compared to the control group | |||
| Lean mass | No significant difference | |||
| Within-group analyses stratified by dose of physical activity: <154 min/wk, 154–196 min/wk, and ≥196 min/wk | Body weight | Significantly decreased for only those who did ≥196 min/wk of physical activity | ||
| BMI | Significantly decreased for only those who did ≥196 min/wk of physical activity Marginally significant decreased for those who did 154–196 min/wk of physical activity |
|||
| Waist circumference | Significantly decreased for those who did 154–196 and ≥196 min/wk of physical activity | |||
| Percent of body fat | Significantly decreased for those who did 154–196 and ≥196 min/wk of physical activity | |||
| Imayama et al., 2011 [52] | Between-group analyses | Quality of life: physical functioning | No significant difference | |
| Quality of life: role physical | No significant difference | |||
| Quality of life: vitality | No significant difference | |||
| Quality of life: mental health | No significant difference | |||
| Perceived stress | No significant difference | |||
| Anxiety | No significant difference | |||
| Depression | No significant difference | |||
| Social support | No significant difference | |||
| Within-group analyses | Perceived stress | No significant difference | ||
| Anxiety | No significant difference | |||
| Depression | No significant difference | |||
| Social support | No significant difference | |||
|
| ||||
| DREW | Church et al., 2007 [88] | Between-group analyses | Body weight | No significant difference |
| Percent of body fat | No significant difference | |||
| Waist circumference | Significantly decreased in all intervention groups compared to the control group | |||
| Peak power output | Significantly increased in all intervention groups (7.6%, 10.7%, and 12.9%, resp.) | |||
| Peak maximal fitness | Significantly increased in all intervention groups (4.2%, 6.0%, and 8.2%, resp.) | |||
| Peak relative fitness | Significantly increased in all intervention groups (4.7%, 7.0%, and 8.5%, resp.) | |||
| Martin et al., 2009 [47] | Between-group analyses | Physical quality of life: physical functioning | Moderate and high doses of physical activity significantly improved compared to control group | |
| Physical quality of life: role limitations | Moderate and high doses of physical activity significantly improved compared to control group | |||
| Physical quality of life: bodily pain | No significant difference | |||
| Physical quality of life: general health perceptions | All doses of intervention groups significantly improved compared to the control group | |||
| Social quality of life: social functioning | Moderate and high doses of physical activity significantly improved compared to control group | |||
| Social quality of life: role limitation | Moderate and high doses of physical activity significantly improved compared to control group | |||
| Social quality of life: vitality | All doses of intervention groups significantly improved compared to the control group | |||
| Social quality of life: mental health | All doses of intervention groups significantly improved compared to the control group | |||
| Sisson et al., 2009 [48] | Between-group analysis | VO2 max | Significantly increased per pairwise comparison except the low dose versus moderate dose of physical activity | |
|
| ||||
| WOMAN | Gabriel et al., 2011 [53] | Between-group analyses | Body weight | Significantly decreased compared to the control group |
| BMI | Significantly decreased compared to the control group | |||
| Waist circumference | Significantly decreased compared to the control group | |||
| Fat mass | Significantly decreased compared to the control group | |||
| 400-meter walk time | Significantly decreased compared to the control group | |||
| Within-group analyses | Body weight | Significantly decreased between baseline and 12-month follow-up | ||
| BMI | Significantly decreased between baseline and 12-month follow-up | |||
| Waist circumference | Significantly decreased between baseline and 12-month follow-up | |||
| Body fat mass | Significantly decreased between baseline and 12-month follow-up | |||
| 400-meter walk time | (i) Marginally significant decrease for intervention participants between baseline and 48-month follow-up | |||
| (ii) No change for control group participants between baseline and 48 months | ||||
|
| ||||
| ALPHA | Friedenreich et al., 2011 [54] | Between-group analyses | Body weight | Significantly decreased by 2.3 kg compared to the 0.5 kg decrease in the control group |
| Body fat mass | Significantly decreased by 2.4 kg compared to the 0.4 kg decrease in the control group | |||
| Abdominal fat | Significantly decreased by 16.5 cm2 compared to the 9.6 cm2 decrease in the control group | |||
| Waist circumference | Significantly decreased by 2.2 cm compared to the 0.1 cm decrease in the control group | |||
| Lean body mass | No significant difference | |||
| VO2 max | Significantly increased by 14.2% compared to the 2.6% increase in the control group | |||
Adiposity Outcomes. Adiposity was measured with various indicators including body weight, BMI, percentage of fat mass, lean body mass, intra-abdominal and subcutaneous fat, and waist circumference. Based on the 9 articles reviewed, participants who were part of a long-term intervention program lasting 6 months or more showed a significant decrease in body weight, total percentage of body fat, BMI, intra-abdominal fat, subcutaneous fat, waist circumference, and hip circumference compared to the control group. There was no significant change in lean body mass. The DREW study [46–48] was the only RCT with various physical activity intervention groups. The 3 physical activity intervention groups differed by exercise dose per week. The study found that, regardless of the dose, a decrease in waist circumference was found compared to the control group and the dose of exercise had an incremental effect on the result. However, there was no significant difference in weight or body fat percentage across the three physical activity intervention groups. Each physical activity dosage group significantly differed in weight from the control group. The NEW study [51] ran secondary analyses to further explore how different doses of exercise impacted adiposity measures. They found that women in the highly active group (≥196 min/week) lost most of the weight by the end of the trial relative to the intermediate active group (154–196 min/week), low active group (<154 min/week), and the control group. The same incremental effects were found for BMI, waist circumference, and percentage of body fat. Even minimal doses of exercise showed a benefit on adiposity indicators compared to no physical activity and weight loss is likely to be greater for those who were engaged in larger doses of exercise.
Physical Capacity Outcomes. Physical capacity was measured with parameters such as physical performance, maximal fitness (or VO2 max, a measure of endurance) and pedometer reading. All of the RCTs demonstrated improved physical capacity by the end of the trials. Specifically, participants in the physical activity intervention showed improved maximal fitness, lower walk times to complete the 400 meter, and increased pedometer readings compared to the control group. According to the DREW study [46], there was a significant difference in mean maximal fitness response (treadmill testing) for all pairwise comparisons (i.e., the process of comparing groups in pairs to judge which of the two demonstrated greater improvement) per treatment groups (low, moderate, and high dose groups) except the low versus moderate dose groups. This demonstrates that the dose of exercise incrementally improved maximal fitness compared to the control group, and, as expected, the highest dosage produced the largest effect while the low and moderately active groups did not differ from one another. Measures of physical capacity significantly improved with long-term interventions ≥6 months.
Mental Health Outcomes. Depression, anxiety, and stress were included in two studies [49, 52] as the mental health outcomes; these constructs were assessed with validated surveys. The Brief Symptom Inventory [56] was used to measure anxiety and depression, and the Perceived Stress Scale [57] was used to measure stress. Overall, the various RCTs showed no significant difference between the physical activity group and the control group on anxiety, depression, and stress. In addition, quality of life was included in three studies [47, 49, 52] and also represented a dimension of mental health. Quality of life was measured with the Short Form Health Survey (SF-36) which includes measures of physical and mental health [58]. Bowen et al. [49] and Imayama et al. [52] both reported nonsignificant results in quality of life at the end of the intervention for the physical activity group and the control group. However, Martin et al. [47] found that treatment groups, specifically the moderate and high dose physical activity groups, indeed showed significant improvements on all subscales of quality of life, with the exception of physical quality of life subscale measuring bodily pain, compared to the control group. This finding suggests that moderate and high doses of physical activity may be required for improving quality of life outcomes among postmenopausal women.
3.2.3. Behavior Change Technique Taxonomy
The results from the behavior change technique taxonomy are displayed in Table 4. To summarize, several techniques were identified and labelled with the corresponding taxonomy in brackets. For instance, interventionists demonstrated how to use the equipment in the training facility (instructions on how to perform a behavior/modelling of behavior) so that the participants could carry out the physical activity tasks. Daily activity logs were documented by the participants to self-monitor (self-monitoring of behavior). The activity logs were submitted weekly for review and follow-up with staff (others monitoring with awareness). The trainer evaluated the number of calories to be expended each week and provided the information to the participant during training, or general feedback regarding progress was provided at meetings (feedback on behavior/social support practical). The heart rate monitor and/or pedometer was used at each training session to ensure that the intensity of the workout was ideal (biofeedback/self-monitoring of behavior/others monitoring with awareness). The facility training was always supervised (others monitoring with awareness). In terms of rewards, triannual intervention group activities such as hikes were used to drive motivation (social reward) and incentives such as water bottles or monetary compensation were guaranteed when milestones were reached (material reward/incentive). Regular individual or group meetings were held to discuss goals (goal setting behavior/goal setting outcome). Interventionists also provided feedback on progress toward goals (feedback on behavior/review behavior goals) or discussed how to conquer barriers when needed (problem solving coping planning). Also individualized phone calls or meetings were conducted to examine, ensure, and promote adherence to the program (social support general/discrepancy between current behavior and goal standard). Finally, participants were asked to devote time and effort to the intervention in order to make sure that the controlled conditions were met (commitment).
Table 4.
The behavior change technique taxonomy applied to the selected randomized controlled trials.
| Taxonomy | Behavioral change technique applied in intervention | RCT |
|---|---|---|
| Instructions on how to perform a behavior | Demonstrate equipment | PATH, NEW, and ALPHA |
|
| ||
| Modelling of behavior | Demonstrate equipment | PATH, NEW, and ALPHA |
|
| ||
| Others monitoring the behavior with awareness | Review activity logs | PATH, NEW, and ALPHA |
| Heart rate monitor | PATH, NEW, DREW, and ALPHA | |
| Pedometer reading | DREW and WOMAN | |
| Supervised training | PATH, NEW, DREW, and ALPHA | |
|
| ||
| Self-monitoring of behavior | Activity log | PATH, NEW, and ALPHA |
| Pedometer reading | DREW and WOMAN | |
| Heart rate monitor | PATH, NEW, DREW, and ALPHA | |
|
| ||
| Feedback on behavior | follow-up on activity logs | PATH, NEW, and ALPHA |
| Provide information about calories to burn | DREW | |
| Information sessions | WOMAN | |
| Feedback on progress | WOMAN | |
|
| ||
| Biofeedback | Heart rate monitor | PATH, NEW, DREW, and ALPHA |
| Pedometer reading | DREW and WOMAN | |
|
| ||
| Social rewards | Triannual activities like hiking | PATH |
|
| ||
| Material rewards | Water bottles | PATH |
| Money | DREW | |
|
| ||
| Other incentives | Not identified | ALPHA |
|
| ||
| Goal setting behavior | Individual meetings to discuss goals | PATH and ALPHA |
| Group meetings to discuss goals | NEW | |
|
| ||
| Goal setting outcome | Individual meetings to discuss goals | PATH and ALPHA |
| Group meetings to discuss goals | NEW | |
| Target to meet dose of physical activity | DREW | |
|
| ||
| Reviewing behavior goals | Feedback on progress toward goals | PATH, NEW, and ALPHA |
|
| ||
| Discrepancy between current behavior and goal standard | Phone meetings to ensure adherence | PATH and ALPHA |
| Individual face-to-face meetings to ensure adherence | PATH and ALPHA | |
| Group meetings to ensure adherence | NEW | |
|
| ||
| Social support practical | Follow-up regarding activity logs | PATH, NEW, and ALPHA |
| Provide information about calories to burn | DREW | |
| General feedback on progress | PATH, NEW, DREW, WOMAN, and ALPHA | |
|
| ||
| Social support general | Phone meetings | PATH and ALPHA |
| Individual face-to-face meetings | PATH and ALPHA | |
| Group meetings | NEW | |
|
| ||
| Problem solving coping planning | Discuss how to conquer barriers | NEW |
|
| ||
| Commitment | Asked to devote time and effort for duration of intervention | PATH, NEW, DREW, WOMAN, and ALPHA |
The RCTs included in this review evidently employed a number of behavioral change techniques. Each trial used a very similar collection of techniques. The RCTs employed 17 of the 85 possible behavioral change techniques from the technique taxonomy [41]. As observed, some of the techniques were labelled with 2 or more of the universal codes because some strategies consist of overlapping and highly interacting techniques. Many techniques coincided greatly and often lead to coding one technique with a cluster of codes (see [41] for details on technique clustering).
4. Discussion
The current systematic review evaluated the impact of physical activity on adiposity indicators, physical capacity measures, and mental health outcomes among sedentary overweight and obese postmenopausal women. Consistent with previous findings in the general population and adult women [59, 60], adiposity outcomes and physical capacity improved significantly with long-term aerobic interventions compared to a control group. Four out of the five RCTs showed a significant decrease in body weight and percentage of fat mass for those in the intervention group compared to the control group. Two of the RCTs examined BMI during follow-up; BMI significantly decreased compared to the control group. In the studies that examined changes in intra-abdominal fat, subcutaneous fat, and waist circumference, the findings also showed a significant decrease in relation to the control group. Three of the studies looked at lean body mass and found that long-term aerobic physical activity did not have a significant effect. This finding was not surprising because resistance training, which was not employed in any of the trials in this review, is ideal for building lean muscle. For example, Willis et al. [61] demonstrated that overweight and obese adults who participated in an 8-month resistance training program significantly increased in lean body mass compared to the aerobics training group. Conversely, the aerobics training group significantly reduced total body mass and fat mass compared to the resistance training group. In terms of the physical capacity measures, fitness level, as measured by treadmill tests for maximal fitness, relative fitness, and power output, significantly improved among the intervention group compared to the control group. Results of this review, therefore, clearly call for physical activity interventions for postmenopausal women to assist in reduced adiposity and improved physical capacity.
In line with a review conducted by Warburton et al. [62], the results also revealed an incremental relationship between dose of physical activity and change in adiposity indicators and physical capacity measures. As physical activity dose increased, adiposity measures including weight, percentage of body fat, and waist circumference significantly decreased (BMI was found marginally significant). Furthermore, only one study found that, at the end of the 6-month intervention, body weight and percent of body fat did not significantly decrease for any of the physical activity dose groups (low, moderate, and high) compared to the control group. Yet, waist circumference significantly decreased for each dose group compared to the control group and an incremental effect was found. This finding might be due to the fact that the intervention was 6 months in duration and, according to previous research, 6 months or less is relatively short term for changes in body mass and other biochemical responses [63].
Two of the RCTs looked at mental health outcomes including depression, anxiety, and stress. According to these studies, the mental health outcomes did not differ significantly by treatment condition at the end of the 12-month intervention period. The finding does not reflect the results from previous studies with alternative populations [64] (e.g., overweight adults with type II diabetes and adults recovering from stroke). Research has shown that physical activity indeed improves self-reported levels of stress, anxiety, and depression in these populations [65–67]. Yet, this is not what we found. Imayama et al. [52] proposed that the participant's preference for type of physical activity could have affected the results because if walking on a treadmill was not their preferred activity, it may have impacted the self-report responses on mental health outcomes. Furthermore, participants in the trials reported relatively low levels of depression and anxiety at baseline which may have caused a “basement effect” (also known as the floor effect). This effect is often established in research when participants report low levels on a measure at baseline and also at follow-up. Consequently, it becomes difficult, if not impossible, to find significant improvement on the measure (in this case depression and anxiety) since the subjects initially reported little to no symptoms. Finally, mental well-being is typically influenced by a number of factors and physical activity may not necessarily improve every aspect of an individual's life to facilitate a change in depression, anxiety, and stress scores. Rather, physical activity may help improve more immediate consequences such as mood or affect, and future work should explore this realm of mental health. Given that there is a limited number of studies that looked at mental health outcomes, future research should continue to investigate the effects of physical activity on stress, anxiety, and depression since there is not enough evidence to reliably infer and draw conclusions.
Interestingly, one study found that the control group of stretchers significantly improved on depression scores [49]. This finding provides evidence for the value of stretching and breathing techniques in physical activity programs. Previous research explored the impact of yoga and stretching on state and trait anxiety [67] and on depression [68]. The literature demonstrates that stretching has a positive impact on various mental health outcomes. Improvement on mental health outcomes may have been significant for the intervention group if this type of activity was incorporated in the training sessions. On the other hand, if the control group did not incorporate an intervention that is typically used to treat symptoms of depression and anxiety, group differences may have been observed on the mental health outcomes.
Quality of life was also examined and considered a dimension of mental health. In line with a recent systematic review and meta-analysis [69], weight loss was not significantly associated with overall quality of life. Specifically, Warkentin et al. [69] found that weight loss might be associated with modest improvements in the physical aspect of quality of life,but not the mental health aspect. Similarly, McCarroll et al. [70] found that adult endometrial cancer survivors, who were assigned to a weight loss intervention to reduce the risk of cardiovascular disease, demonstrated that quality of life had no correlation to weight loss. However, a recent study by Rothberg et al. [71] found that a greater reduction in BMI after the physical activity intervention significantly improved quality of life measures and individual differences appeared to influence the strength of the association. Participants with a lower baseline BMI, greater decrease in BMI from baseline to follow-up, and poorer baseline quality of life score demonstrated greater improvements in quality of life at follow-up.
The current review tends to share the contradictory nature of the findings from previous work. Two of the studies [49, 52] reported nonsignificant results on quality of life by treatment condition and one study [47] found remarkable results. Namely, Martin et al. [47] found that the dose of physical activity had an effect on self-reported quality of life. More explicitly, the social quality of life subscales (social functioning and role limitation) demonstrated significant improvement among moderate and high physical activity dose groups compared to the control group. The remaining two subscales for social quality of life (vitality and mental health) demonstrated a significant improvement for all physical activity groups (low, moderate, and high) compared to the control group. In terms of the physical quality of life subscales, both physical functioning and role limitations improved significantly among moderate and high physical activity dose groups compared to the control group. The physical quality of life subscale measuring general health perceptions significantly improved for all doses of physical activity groups compared to the control group. Lastly, the physical quality of life subscale measuring bodily pain did not show significant results for any groups. These findings may suggest that higher doses of physical activity are necessary for improving quality of life outcomes. Future research is required to understand such inconsistencies.
The Canadian Physical Activity Guidelines for Adults suggest that 150 minutes of physical activity per week is the minimum requirement [72]. All five RCTs met this criterion. The results demonstrate that the requirement of 150 minutes per week of physical activity is a suitable guideline for the samples of postmenopausal women included in this review. In general, the findings indicate plausible efficacy of long-term physical activity interventions. To further strengthen the evidence base, future research should include a meta-analysis of the effectiveness of physical activity on various outcomes, focusing particularly on those that have implications for mental health. Such prospective research will help develop a better understanding of physical activity interventions among sedentary overweight and obese postmenopausal women.
4.1. Classification of Behavior Change Techniques
The classification of strategies from the behavior change technique taxonomy [41] was applied to standardize the intervention content across the RCTs and identify the different assortment and levels of intervention techniques. The findings revealed that the techniques were largely focused on two levels: the individual (intrapersonal) and the social aspect (interpersonal) of behavior change. The techniques used to change the subject's behavior included intrapersonal strategies to help educate and increase knowledge, teach new skills, and develop competence, whereas the interpersonal techniques were employed to help promote social support and encourage adherence to the program. Indeed, the two levels of techniques are crucial in improving physical activity behavior among postmenopausal women as they evidently helped produce positive effects on adiposity and physical capacity.
Other techniques may have been applied in the interventions, but the content was either not transparent or the description was too brief. Michie et al. [43] have emphasized the importance of reporting details and the taxonomy is simply a system to help accurately document the intervention content. Nevertheless, similarities and differences across the interventions were uncovered based on the taxonomy analysis. The interventions centered their techniques on instruction, education, modelling, feedback, and rewards. Techniques such as manipulating or restructuring the environment (physical or social) or targeting emotions were not used in any of the interventions.
The Social Ecological Model of Health Behavior developed by McLeroy et al. [73] is a behavior change framework which emphasizes that a variety of sources influence specific health behaviors and they do so by interacting with one another. The framework has been used to understand and identify the relevant sources for behavior-specific interventions such as smoking cessation [74, 75] and healthy eating [76]. The model includes five main sources or levels of influence on health behaviors: the intrapersonal (characteristics of the individual including skills, attitudes, and developmental history), interpersonal (social networks and support systems), organizational (institutional and organizational cultures, rules, and regulations for operation), community (relationships among organizations, institutions, and other networks), and public policy (local, provincial, and national laws). Ample research proposes that multilevel interventions that incorporate various levels from the Social Ecological Model are ideal for improving large-scale or population-wide health problems such as obesity [77].
Multilevel models lead to more substantial and sustained changes in health behaviors compared to single-level or dual-level interventions because they provide opportunity for maximal behavior change [78, 79]. According to the World Health Organization [1], health behaviors improve when environments and policies support healthy choices and individuals are motivated and educated to make those choices. Educating people to make healthy choices when environments are not supportive may not be effective in making behavioral change because the environment provides norms, rules, and resources to behave in a particular way [73, 80].
The environmental approach seems to be growing in physical activity intervention research. For example, a study by Carlson et al. [81] found that environmental features and psychosocial measures of self-efficacy and social support are associated with moderate-to-vigorous physical activity among older adults. Specifically, those who reported a high level of support to exercise from family and friends had on average 56 minutes of more physical activity per week compared to those who reported low social support. As well, environments that were reported as having pleasing aesthetics were associated with increased physical activity by roughly 30 minutes per week compared to areas reported as having undesirable aesthetics. Negative perceptions of safety, traffic, and distances from exercise facilities were found to reduce physical activity by about 18 minutes per week [82]. Chaudhury et al. [82] found that environmental aesthetics such as smooth walking surfaces (trails and parks around the community), plenty of benches for comfort and breaks, safety and security, and peer support (partners for activities) were found to be associated with increased physical activity regardless of population density in the neighbourhood. Evidently, social and environmental aspects should be considered by interventionists. In order to truly drive physical activity intervention research forward, environmental levels should be integrated in research.
Several countries have reported major health improvements from implementing a multilevel approach focusing on people, policy, and environment such as Brazil [83] and Costa Rica [84]. Supporting a person-environment approach seems to be the gold standard in intervention research. To advance physical activity intervention research and build from the current systematic review, these multilevel approaches could serve as models for testing the effectiveness of physical activity interventions in North American postmenopausal populations.
4.2. Strengths and Limitations
The main strength of this review is the comprehensive and meticulous search of five databases and the synthesis of available evidence from RCTs of physical activity interventions among sedentary postmenopausal women in Canada and the United States. The findings, however, may only generalize to the contexts in which the studies have been conducted. Researches in different countries, cultural settings, and postmenopausal women with serious health conditions require a separate investigation. Different clinical populations tend to have specific characteristics that require tailored interventions especially if the subjects are unable to walk themselves to a facility for training. Some clinical populations may suffer from fatigue or have priority treatment groups like patients battling cancer. A systematic review by Knols et al. [85] examined the benefits of physical activity in cancer patients. The review found statistically significant results favouring even small doses of walking and strengthening exercises (free weights and isokinetic machines) on body fat, lean body mass, bone mineral density, muscle strength, walking distance, and self-reported outcomes including fatigue, psychological well-being, mood, and quality of life. The findings revealed that low levels of physical activity (whether carried out in a rehabilitation program or at home) are effective in improving the physical and psychosocial functioning of patients with breast cancer both during medical treatment and after it. Zanuso et al. [86] also suggested that intervention research among some clinical populations should focus on not only the effect of aerobic exercise itself, but also the effect of exercise intensity. Prospective research should therefore investigate postmenopausal women with health conditions as they may require different interventions and evaluations.
A second strength is that the adiposity indicators and physical capacity tests were objectively measured and recorded with sophisticated instruments such as a scale to measure body weight, ultrasounds to measure fat mass, intra-abdominal fat, and subcutaneous fat, a treadmill test to measure fitness, and a pedometer to measure steps.
A limitation is that the mental health outcomes were measured with self-report methods. Issues and restrictions with self-reported outcomes have been flagged in the literature [87] and may have had an impact on the results. Additionally, very few trials (n = 2) examined the impact of physical activity on diverse mental health outcomes among postmenopausal women and future research should explore this avenue to understand the implications of physical activity on mental well-being.
Sisson et al. [48] noted that, after running individual-level analyses, a fair amount of individual variability in response to maximal fitness became apparent. They found that the volume of training and age played a role on maximal fitness results. Stratified sampling by BMI, age, or ethnic group was also not carried out for any of the outcome measures. Individual variability such as differences in cultural or ethnic groups may exist, but this information was not included in the original RCTs. Sublevel analyses ought to be carried out in future work.
The methodological quality of some of the studies demonstrated room for improvement as judged by the Cochrane Collaboration tool for assessing risk of bias [38]. Many of the RCTs did not report methods for blinding of participants, personnel, and outcome assessors. Half of the studies failed to report the process for concealing the allocation of participants and how the allocation was masked throughout the trial period. The missing content was not judged to be a high risk; however, future reports should improve the coverage of this content. Likewise, the particular behavioral change techniques employed in the interventions to support and increase physical activity were described with little details. The consistent lack of information tends to hinder the reliability and usefulness of intervention studies because such details are required for replication and application elsewhere [43]. The missing information also creates a challenge for reliably translating and interpreting the various techniques in secondary research such as systematic reviews [41]. Though the potentially omitted information is a limitation, this expected circumstance provides a learning opportunity for future intervention reports where all relevant details should be provided.
Lastly, the inclusion criterion to select and investigate RCTs presents another restraint. Although the review of RCTs is a reliable means to establish efficacy, the effectiveness of physical activity interventions among postmenopausal women was not examined. Consequently, it was not possible to study the effects of the environment since the environments were highly controlled during training. Based on the notion that environment and policy are key in maximal behavior change and maintenance, prospective work should focus on investigating the effectiveness of such multilevel intervention models.
5. Conclusion
The current systematic review evaluated the efficacy of physical activity interventions on adiposity indicators, physical capacity measures, and the mental health outcomes of stress, anxiety, and depression among sedentary overweight/obese postmenopausal women. The other goal of the review was to identify the various levels of behavioral change techniques that were employed in the interventions to determine the common techniques and guide prospective research and application in alternative settings.
The findings showed that addressing the intrapersonal and interpersonal levels of behavior change improved physical activity levels which led to a number of positive outcomes on adiposity indicators and physical capacity measures. Future research should explore physical activity interventions among postmenopausal women in terms of a multilevel model going beyond the combination of intrapersonal and interpersonal sources. Although the literature does not comprise many studies on physical activity interventions among postmenopausal women and certainly no studies that follow a multilevel approach, this is recommended as the direction for future work. Given that multilevel models take a combination of both individual- and environmental-level intervention techniques to maximize change in health behaviors among populations, this framework would seemingly work well for physical activity programs geared toward postmenopausal populations. In turn, the issue of overweight and obesity among postmenopausal women may, in due course, subside.
Competing Interests
The authors declare that they have no competing interests.
References
- 1.World Health Organization. Controlling the Global Obesity Epidemic. Geneva, Switzerland: World Health Organization; 2015. http://www.who.int/nutrition/topics/obesity/en/ [Google Scholar]
- 2.Lau D. C. W., Douketis J. D., Morrison K. M., Hramiak I. M., Sharma A. M., Ur E. 2006 Canadian clinical practice guidelines on the management and prevention of obesity in adults and children [summary] Canadian Medical Association Journal. 2007;176(8):1–13. doi: 10.1503/cmaj.061409. [DOI] [PMC free article] [PubMed] [Google Scholar]
- 3. Adult obesity facts . Centers for Disease Control and Prevention, 2015, http://www.cdc.gov/obesity/data/adult.html.
- 4. Obesity is a public health concern . Dieticians of Canada, 2014, http://www.dietitians.ca/Media/News-eleases/2014/ObesityPublicHealth.aspx.
- 5.Ogden C. L., Carroll M. D., Kit B. K., Flegal K. M. Prevalence of childhood and adult obesity in the United States, 2011-2012. Journal of the American Medical Association. 2014;311(8):806–814. doi: 10.1001/jama.2014.732. [DOI] [PMC free article] [PubMed] [Google Scholar]
- 6.Shifren J. L., Gass M. L. S. The North American menopause society recommendations for clinical care of midlife women. Journal of The North American Menopause Society. 2014;21(10):1–25. doi: 10.1097/GME.0000000000000319. [DOI] [PubMed] [Google Scholar]
- 7.Holliday K. L., McWilliams D. F., Maciewicz R. A., Muir K. R., Zhang W., Doherty M. Lifetime body mass index, other anthropometric measures of obesity and risk of knee or hip osteoarthritis in the GOAL case-control study. Osteoarthritis and Cartilage. 2011;19(1):37–43. doi: 10.1016/j.joca.2010.10.014. [DOI] [PubMed] [Google Scholar]
- 8.Veronelli A., Mauri C., Zecchini B., et al. Sexual dysfunction is frequent in premenopausal women with diabetes, obesity, and hypothyroidism, and correlates with markers of increased cardiovascular risk. A preliminary report. Journal of Sexual Medicine. 2009;6(6):1561–1568. doi: 10.1111/j.1743-6109.2009.01242.x. [DOI] [PubMed] [Google Scholar]
- 9.Poulain M., Doucet M., Major G. C., et al. The effect of obesity on chronic respiratory diseases: pathophysiology and therapeutic strategies. Canadian Medical Association Journal. 2006;174(9):1293–1299. doi: 10.1503/cmaj.051299. [DOI] [PMC free article] [PubMed] [Google Scholar]
- 10.Simon G. E., von Korff M., Saunders K., et al. Association between obesity and psychiatric disorders in the US adult population. Archives of General Psychiatry. 2006;63(7):824–830. doi: 10.1001/archpsyc.63.7.824. [DOI] [PMC free article] [PubMed] [Google Scholar]
- 11.Cohen-Cole E., Fletcher J. M. Is obesity contagious? Social networks vs. environmental factors in the obesity epidemic. Journal of Health Economics. 2008;27(5):1382–1387. doi: 10.1016/j.jhealeco.2008.04.005. [DOI] [PubMed] [Google Scholar]
- 12.Yatsuya H., Folsom A. R., Yamagishi K., North K. E., Brancati F. L., Stevens J. Race-and sex-specific associations of obesity measures with ischemic stroke incidence in the atherosclerosis risk in communities (ARIC) study. Stroke. 2010;41(3):417–425. doi: 10.1161/STROKEAHA.109.566299. [DOI] [PMC free article] [PubMed] [Google Scholar]
- 13.Abdullah A., Peeters A., de Courten M., Stoelwinder J. The magnitude of association between overweight and obesity and the risk of diabetes: a meta-analysis of prospective cohort studies. Diabetes Research and Clinical Practice. 2010;89(3):309–319. doi: 10.1016/j.diabres.2010.04.012. [DOI] [PubMed] [Google Scholar]
- 14.van den Brandt P. A., Spiegelman D., Yaun S.-S., et al. Pooled analysis of prospective cohort studies on height, weight, and breast cancer risk. American Journal of Epidemiology. 2000;152(6):514–527. doi: 10.1093/aje/152.6.514. [DOI] [PubMed] [Google Scholar]
- 15.Li T. Y., Rana J. S., Manson J. E., et al. Obesity as compared with physical activity in predicting risk of coronary heart disease in women. Circulation. 2006;113(4):499–506. doi: 10.1161/circulationaha.105.574087. [DOI] [PMC free article] [PubMed] [Google Scholar]
- 16.Luppino F. S., de Wit L. M., Bouvy P. F., et al. Overweight, obesity, and depression: a systematic review and meta-analysis of longitudinal studies. Archives of General Psychiatry. 2010;67(3):220–229. doi: 10.1001/archgenpsychiatry.2010.2. [DOI] [PubMed] [Google Scholar]
- 17.Rosano G. M. C., Vitale C., Marazzi G., Volterrani M. Menopause and cardiovascular disease: the evidence. Climacteric. 2007;10(1):19–24. doi: 10.1080/13697130601114917. [DOI] [PubMed] [Google Scholar]
- 18.Peterson J. A., Ward-Smith P. Choose to move for positive living: physical activity program for obese women. Holistic Nursing Practice. 2012;26(3):120–128. doi: 10.1097/hnp.0b013e31824ef4ca. [DOI] [PubMed] [Google Scholar]
- 19.Dennis K. E. Postmenopausal women and the health consequences of obesity. Journal of Obstetric, Gynaecologic & Neonatal Nursing. 2007;36(5):511–519. doi: 10.1111/j.1552-6909.2007.00180.x. [DOI] [PubMed] [Google Scholar]
- 20.Kopelman P. Health risks associated with overweight and obesity. Obesity Reviews. 2007;8(1):13–17. doi: 10.1111/j.1467-789x.2007.00311.x. [DOI] [PubMed] [Google Scholar]
- 21.Beitz R., Dören M. Physical activity and postmenopausal health. The Journal of the British Menopause Society. 2004;10(2):70–74. doi: 10.1258/136218004774202382. [DOI] [PubMed] [Google Scholar]
- 22.Bouchard C., Blair S. N., Haskell W. Physical Activity and Health. Champaign, Ill, USA: Human Kinetics; 2006. [Google Scholar]
- 23.Janiszewski P. M., Ross P. R. Physical activity in the treatment of obesity: beyond body weight reduction. Applied Physiology, Nutrition, and Metabolism. 2007;32(3):512–522. doi: 10.1139/h07-018. [DOI] [PubMed] [Google Scholar]
- 24.McCullough L. E., Eng S. M., Bradshaw P. T., et al. Fat or fit: the joint effects of physical activity, weight gain, and body size on breast cancer risk. Cancer. 2012;118(19):4860–4868. doi: 10.1002/cncr.27433. [DOI] [PMC free article] [PubMed] [Google Scholar]
- 25.Paluska S. A., Schwenk T. L. Physical activity and mental health: current concepts. Sports Medicine. 2000;29(3):167–180. doi: 10.2165/00007256-200029030-00003. [DOI] [PubMed] [Google Scholar]
- 26.Wen C. P., Wai J. P. M., Tsai M. K., et al. Minimum amount of physical activity for reduced mortality and extended life expectancy: a prospective cohort study. The Lancet. 2011;378(9798):1244–1253. doi: 10.1016/s0140-6736(11)60749-6. [DOI] [PubMed] [Google Scholar]
- 27.Sattelmair J., Pertman J., Ding E. L., Kohl H. W., Haskell W., Lee I.-M. Dose response between physical activity and risk of coronary heart disease: a meta-analysis. Circulation. 2011;124(7):789–795. doi: 10.1161/circulationaha.110.010710. [DOI] [PMC free article] [PubMed] [Google Scholar]
- 28.Spirduso W. W. Physical fitness, aging, and psychomotor speed: a review. Journals of Gerontology. 1980;35(6):850–865. doi: 10.1093/geronj/35.6.850. [DOI] [PubMed] [Google Scholar]
- 29.Folkins C. H., Sime W. E. Physical fitness training and mental health. American Psychologist. 1981;36(4):373–389. doi: 10.1037/0003-066x.36.4.373. [DOI] [PubMed] [Google Scholar]
- 30.Blumenthal J. A., Fredrikson M., Kuhn C. M., Ulmer R. L., Walsh-Riddle M., Appelbaum M. Aerobic exercise reduces levels of cardiovascular and sympathoadrenal responses to mental stress in subjects without prior evidence of myocardial ischemia. The American Journal of Cardiology. 1990;65(1):93–98. doi: 10.1016/0002-9149(90)90032-V. [DOI] [PubMed] [Google Scholar]
- 31.Blumenthal J. A., Emery C. F., Walsh M. A., et al. Exercise training in healthy Type A middle-aged men: effects on behavioral and cardiovascular responses. Psychosomatic Medicine. 1988;50(4):418–422. doi: 10.1097/00006842-198807000-00009. [DOI] [PubMed] [Google Scholar]
- 32.Kirk A., Mutrie N., MacIntyre P., Fisher M. Increasing physical activity in people with type 2 diabetes. Diabetes Care. 2003;26(4):1186–1192. doi: 10.2337/diacare.26.4.1186. [DOI] [PubMed] [Google Scholar]
- 33.Kraus W. E., Houmard J. A., Duscha B. D., et al. Effects of the amount and intensity of exercise on plasma lipoproteins. The New England Journal of Medicine. 2002;347(19):1483–1492. doi: 10.1056/nejmoa020194. [DOI] [PubMed] [Google Scholar]
- 34.Statistics Canada. Directly Measured Physical Activity of Canadian Adults 2007 to 2011. Statistics Canada; 2011. http://www.statcan.gc.ca/ [Google Scholar]
- 35. Overweight and Obesity . Centers for Disease Control and Prevention, 2016, http://www.cdc.gov/nchs/fastats/obesity-overweight.htm.
- 36.Boulé N. G., Haddad E., Kenny G. P., Wells G. A., Sigal R. J. Effects of exercise on glycemic control and body mass in type 2 diabetes mellitus: a meta-analysis of controlled clinical trials. The Journal of the American Medical Association. 2001;286(10):1218–1227. doi: 10.1001/jama.286.10.1218. [DOI] [PubMed] [Google Scholar]
- 37.Kasapis C., Thompson P. D. The effects of physical activity on serum C-reactive protein and inflammatory markers: a systematic review. Journal of the American College of Cardiology. 2005;45(10):1563–1569. doi: 10.1016/j.jacc.2004.12.077. [DOI] [PubMed] [Google Scholar]
- 38.Higgins J., Green S. Cochrane Handbook for Systematic Reviews of Interventions Version 5.1.0. The Cochrane Collaboration; 2011. [Google Scholar]
- 39.Craig P., Dieppe P., Macintyre S., Mitchie S., Nazareth I., Petticrew M. Developing and evaluating complex interventions: the New Medical Research Council guidance. The British Medical Journal. 2008;337(7676):979–983. doi: 10.1136/bmj.a1655. [DOI] [PMC free article] [PubMed] [Google Scholar]
- 40.Abraham C., Michie S. A taxonomy of behavior change techniques used in interventions. Health Psychology. 2008;27(3):379–387. doi: 10.1037/0278-6133.27.3.379. [DOI] [PubMed] [Google Scholar]
- 41.Michie S., Richardson M., Johnston M., et al. The behaviour change technique taxonomy of 93 hierarchically clustered techniques: building an international consensus for the reporting of behaviour change interventions. Annual Behavioural Medicine. 2013;46:81–95. doi: 10.1007/s12160-013-9486-6. [DOI] [PubMed] [Google Scholar]
- 42.Michie S., Ashford S., Sniehotta F. F., Dombrowski S. U., Bishop A., French D. P. A refined taxonomy of behaviour change techniques to help people change their physical activity and healthy eating behaviours: the CALO-RE taxonomy. Psychology and Health. 2011;26(11):1479–1498. doi: 10.1080/08870446.2010.540664. [DOI] [PubMed] [Google Scholar]
- 43.Michie S., Fixsen D., Grimshaw J. M., Eccles M. P. Specifying and reporting complex behaviour change interventions: the need for a scientific method. Implementation Science. 2009;4(1, article 40):1–6. doi: 10.1186/1748-5908-4-40. [DOI] [PMC free article] [PubMed] [Google Scholar]
- 44.Michie S., Johnston M., Francis J., Hardeman W., Eccles M. From theory to intervention: mapping theoretically derived behavioural determinants to behaviour change techniques. Applied Psychology. 2008;57(4):660–680. doi: 10.1111/j.1464-0597.2008.00341.x. [DOI] [Google Scholar]
- 45.Prestwich A., Sniehotta F. F., Whittington C., Dombrowski S. U., Rogers L., Michie S. Does theory influence the effectiveness of health behavior interventions? Meta-analysis. Health Psychology. 2014;33(5):465–474. doi: 10.1037/a0032853. [DOI] [PubMed] [Google Scholar]
- 46.Church T. S., Martin C. K., Thompson A. M., Earnest C. P., Mikus C. R., Blair S. N. Changes in weight, waist circumference and compensatory responses with different doses of exercise among sedentary, overweight postmenopausal women. PLoS ONE. 2009;4(2) doi: 10.1371/journal.pone.0004515.e4515 [DOI] [PMC free article] [PubMed] [Google Scholar]
- 47.Martin C. K., Church T. S., Thompson A. M., Earnest C. P., Blair S. N. Exercise dose and quality of life: a randomized controlled trial. Archives of Internal Medicine. 2009;169(3):269–278. doi: 10.1001/archinternmed.2008.545. [DOI] [PMC free article] [PubMed] [Google Scholar]
- 48.Sisson S. B., Katzmarzyk P. T., Earnest C. P., Bouchard C., Blair S. N., Church T. S. Volume of exercise and fitness nonresponse in sedentary, postmenopausal women. Medicine and Science in Sports and Exercise. 2009;41(3):539–545. doi: 10.1249/MSS.0b013e3181896c4e. [DOI] [PMC free article] [PubMed] [Google Scholar]
- 49.Bowen D. J., Fesinmeyer M. D., Yasui Y., et al. Randomized trial of exercise in sedentary middle aged women: effects on quality of life. International Journal of Behavioral Nutrition and Physical Activity. 2006;3, article 34 doi: 10.1186/1479-5868-3-34. [DOI] [PMC free article] [PubMed] [Google Scholar]
- 50.Campbell P. T., Gross M. D., Potter J. D., et al. Effect of exercise on oxidative stress: a 12-month randomized, controlled trial. Medicine and Science in Sports and Exercise. 2010;42(8):1448–1453. doi: 10.1249/mss.0b013e3181cfc908. [DOI] [PMC free article] [PubMed] [Google Scholar]
- 51.Foster-Schubert K. E., Alfano C. M., Duggan C. R., et al. Effect of diet and exercise, alone or combined, on weight and body composition in overweight-to-obese postmenopausal women. Obesity. 2012;20(8):1628–1638. doi: 10.1038/oby.2011.76. [DOI] [PMC free article] [PubMed] [Google Scholar]
- 52.Imayama I., Alfano C. M., Kong A., et al. Dietary weight loss and exercise interventions effects on quality of life in overweight/obese postmenopausal women: a randomized controlled trial. International Journal of Behavioral Nutrition and Physical Activity. 2011;8, article 118:1–12. doi: 10.1186/1479-5868-8-118. [DOI] [PMC free article] [PubMed] [Google Scholar]
- 53.Gabriel K. K. P., Conroy M. B., Schmid K. K., et al. The impact of weight and fat mass loss and increased physical activity on physical function in overweight, postmenopausal women: results from the Women on the Move Through Activity and Nutrition study. Menopause. 2011;18(7):759–765. doi: 10.1097/gme.0b013e31820acdcc. [DOI] [PMC free article] [PubMed] [Google Scholar]
- 54.Friedenreich C. M., Woolcott C. G., McTiernan A., et al. Adiposity changes after a 1-year aerobic exercise intervention among postmenopausal women: a randomized controlled trial. International Journal of Obesity. 2011;35(3):427–435. doi: 10.1038/ijo.2010.147. [DOI] [PMC free article] [PubMed] [Google Scholar]
- 55.Ainsworth B. E., Haskell W. L., Whitt M. C., et al. Compendium of physical activities: an update of activity codes and MET intensities. Medicine and Science in Sports and Exercise. 2000;32(9):S498–S504. doi: 10.1097/00005768-200009001-00009. [DOI] [PubMed] [Google Scholar]
- 56.Derogatis L. R., Melisaratos N. The brief symptom inventory: an introductory report. Psychological Medicine. 1983;13(3):595–605. doi: 10.1017/s0033291700048017. [DOI] [PubMed] [Google Scholar]
- 57.Cohen S., Kamarck T., Mermelstein R. A global measure of perceived stress. Journal of Health and Social Behavior. 1983;24(4):385–396. doi: 10.2307/2136404. [DOI] [PubMed] [Google Scholar]
- 58.Ware J. E., Sherbourne C. D. The MOS 36-item short-form health survey (Sf-36): I. conceptual framework and item selection. Medical Care. 1992;30(6):473–483. doi: 10.1097/00005650-199206000-00002. [DOI] [PubMed] [Google Scholar]
- 59.Donnelly J. E., Blair S. N., Jakicic J. M., Manore M. M., Rankin J. W., Smith B. K. Appropriate physical activity intervention strategies for weight loss and prevention of weight regain for adults. Medicine and Science in Sports and Exercise. 2009;41(2):459–471. doi: 10.1249/mss.0b013e3181949333. [DOI] [PubMed] [Google Scholar]
- 60.Jakicic J. M., Marcus B. H., Gallagher K. I., Napolitano M., Lang W. Effect of exercise duration and intensity on weight loss in overweight, sedentary women: a randomized trial. Journal of the American Medical Association. 2003;290(10):1323–1330. doi: 10.1001/jama.290.10.1323. [DOI] [PubMed] [Google Scholar]
- 61.Willis L. H., Slentz C. A., Bateman L. A., et al. Effects of aerobic and/or resistance training on body mass and fat mass in overweight or obese adults. Journal of Applied Physiology. 2012;113(12):1831–1837. doi: 10.1152/japplphysiol.01370.2011. [DOI] [PMC free article] [PubMed] [Google Scholar]
- 62.Warburton D. E. R., Nicol C. W., Bredin S. S. D. Health benefits of physical activity: the evidence. Canadian Medical Association Journal. 2006;174(6):801–809. doi: 10.1503/cmaj.051351. [DOI] [PMC free article] [PubMed] [Google Scholar]
- 63.Avery L., Flynn D., van Wersch A., Sniehotta F. F., Trenell M. I. Changing physical activity behavior in type 2 diabetes: a systematic review and meta-analysis of behavioral interventions. Diabetes Care. 2012;35(12):2681–2689. doi: 10.2337/dc11-2452. [DOI] [PMC free article] [PubMed] [Google Scholar]
- 64.Williamson D. A., Rejeski J., Lang W., Van Dorsten B., Fabricatore A. N., Toledo K. Impact of a weight management program on health-related quality of life in overweight adults with type 2 diabetes. Archives of Internal Medicine. 2009;169(2):163–171. doi: 10.1001/archinternmed.2008.544. [DOI] [PMC free article] [PubMed] [Google Scholar]
- 65.Tudor-Locke C., Bell R. C., Myers A. M., et al. Controlled outcome evaluation of the First Step Program: a daily physical activity intervention for individuals with type II diabetes. International Journal of Obesity. 2004;28(1):113–119. doi: 10.1038/sj.ijo.0802485. [DOI] [PubMed] [Google Scholar]
- 66.Askim T., Langhammer B., Ihle-Hansen H., Magnussen J., Engstad T., Indredavik B. A long-term follow-up programme for maintenance of motor function after stroke: protocol of the life after stroke—the LAST study. Stroke Research and Treatment. 2012;2012:7. doi: 10.1155/2012/392101.392101 [DOI] [PMC free article] [PubMed] [Google Scholar]
- 67.Javnbakht M., Hejazi Kenari R., Ghasemi M. Effects of yoga on depression and anxiety of women. Complementary Therapies in Clinical Practice. 2009;15(2):102–104. doi: 10.1016/j.ctcp.2009.01.003. [DOI] [PubMed] [Google Scholar]
- 68.Cramer H., Lauche R., Langhorst J., Dobos G. Yoga for depression: a systematic review and meta-analysis. Depression and Anxiety. 2013;30(11):1068–1083. doi: 10.1002/da.22166. [DOI] [PubMed] [Google Scholar]
- 69.Warkentin L. M., Das D., Majumdar S. R., Johnson J. A., Padwal R. S. The effect of weight loss on health-related quality of life: systematic review and meta-analysis of randomized trials. Obesity Reviews. 2014;15(3):169–182. doi: 10.1111/obr.12113. [DOI] [PubMed] [Google Scholar]
- 70.McCarroll M. L., Armbruster S., Frasure H. E., et al. Self-efficacy, quality of life, and weight loss in overweight/obese endometrial cancer survivors (SUCCEED): a randomized controlled trial. Gynecologic Oncology. 2014;132(2):397–402. doi: 10.1016/j.ygyno.2013.12.023. [DOI] [PubMed] [Google Scholar]
- 71.Rothberg A. E., McEwen L. N., Kraftson A. T., et al. The impact of weight loss on health-related quality-of-life: implications for cost-effectiveness analyses. Quality of Life Research. 2014;23(4):1371–1376. doi: 10.1007/s11136-013-0557-8. [DOI] [PMC free article] [PubMed] [Google Scholar]
- 72.CSEP. Canadian Physical Activity Guidelines and Canadian Sedentary Behaviour Guidelines. Canadian Society for Exercise Physiology; 2015. http://www.csep.ca/ [Google Scholar]
- 73.McLeroy K. R., Bibeau D., Steckler A., Glanz K. An ecological perspective on health promotion programs. Health Education Quarterly. 1988;15(4):351–377. doi: 10.1177/109019818801500401. [DOI] [PubMed] [Google Scholar]
- 74.Hyland A., Barnoya J., Corral J. E. Smoke-free air policies: past, present and future. Tobacco Control. 2012;21(2):154–161. doi: 10.1136/tobaccocontrol-2011-050389. [DOI] [PubMed] [Google Scholar]
- 75.Sorensen G., Barbeau E., Hunt M. K., Emmons K. Reducing social disparities in tobacco use: a social-contextual model for reducing tobacco use among blue-collar workers. American Journal of Public Health. 2004;94(2):230–239. doi: 10.2105/ajph.94.2.230. [DOI] [PMC free article] [PubMed] [Google Scholar]
- 76.Townsend N., Foster C. Developing and applying a socio-ecological model to the promotion of healthy eating in the school. Public Health Nutrition. 2013;16(6):1101–1108. doi: 10.1017/S1368980011002655. [DOI] [PMC free article] [PubMed] [Google Scholar]
- 77.Langille J.-L. D., Rodgers W. M. Exploring the influence of a social ecological model on school-based physical activity. Health Education and Behavior. 2010;37(6):879–894. doi: 10.1177/1090198110367877. [DOI] [PubMed] [Google Scholar]
- 78.Hawe P., Potvin L. What is population health intervention research? Canadian Journal of Public Health. 2009;100(1):I8–I14. doi: 10.1007/BF03405503. [DOI] [PMC free article] [PubMed] [Google Scholar]
- 79.Golden S. D., McLeroy K. R., Green L. W., Earp J. A. L., Lieberman L. D. Upending the social ecological model to guide health promotion efforts toward policy and environmental change. Health Education and Behavior. 2015;42:8S–14S. doi: 10.1177/1090198115575098. [DOI] [PubMed] [Google Scholar]
- 80.Sallis J. F., Owen N., Fisher E. B. Ecological models of health behavior. Health Behavior and Health Education: Theory, Research, and Practice. 2008;4:465–486. [Google Scholar]
- 81.Carlson J. A., Sallis J. F., Conway T. L., et al. Interactions between psychosocial and built environment factors in explaining older adults' physical activity. Preventive Medicine. 2012;54(1):68–73. doi: 10.1016/j.ypmed.2011.10.004. [DOI] [PMC free article] [PubMed] [Google Scholar]
- 82.Chaudhury H., Mahmood A., Michael Y. L., Campo M., Hay K. The influence of neighborhood residential density, physical and social environments on older adults' physical activity: an exploratory study in two metropolitan areas. Journal of Aging Studies. 2012;26(1):35–43. doi: 10.1016/j.jaging.2011.07.001. [DOI] [PMC free article] [PubMed] [Google Scholar]
- 83.Victora C. G., Barreto M. L., Do Carmo Leal M., et al. Health conditions and health-policy innovations in Brazil: the way forward. The Lancet. 2011;377(9782):2042–2053. doi: 10.1016/s0140-6736(11)60055-x. [DOI] [PubMed] [Google Scholar]
- 84.Unger J.-P., de Paepe P., Buitrón R., Soors W. Costa Rica: achievements of a heterodox health policy. American Journal of Public Health. 2008;98(4):636–643. doi: 10.2105/ajph.2006.099598. [DOI] [PMC free article] [PubMed] [Google Scholar]
- 85.Knols R., Aaronson N. K., Uebelhart D., Fransen J., Aufdemkampe G. Physical exercise in cancer patients during and after medical treatment: a systematic review of randomized and controlled clinical trials. Journal of Clinical Oncology. 2005;23(16):3830–3842. doi: 10.1200/jco.2005.02.148. [DOI] [PubMed] [Google Scholar]
- 86.Zanuso S., Jimenez A., Pugliese G., Corigliano G., Balducci S. Exercise for the management of type 2 diabetes: a review of the evidence. Acta Diabetologica. 2010;47(1):15–22. doi: 10.1007/s00592-009-0126-3. [DOI] [PubMed] [Google Scholar]
- 87.Baranowski T., Klesges L. M., Cullen K. W., Himes J. H. Measurement of outcomes, mediators, and moderators in behavioral obesity prevention research. Preventive Medicine. 2004;38:S1–S13. doi: 10.1016/j.ypmed.2003.12.029. [DOI] [PubMed] [Google Scholar]
- 88.Church T. S., Earnest C. P., Skinner J. S., Blair S. N. Effects of different doses of physical activity on cardiorespiratory fitness among sedentary, overweight or obese postmenopausal women with elevated blood pressure. Journal of the American Medical Association. 2007;297(19):2081–2091. doi: 10.1001/jama.297.19.2081. [DOI] [PubMed] [Google Scholar]