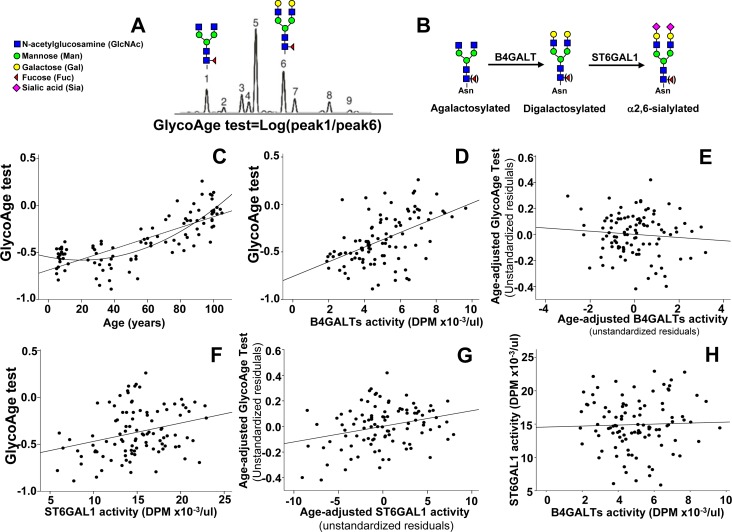
Figure 2. GlycoAge test and plasmatic glycosyltransferases.
A. example of DSA-FACE analysis of glycans released by a plasma sample. The Log of the ratio of the relative abundance of peaks 1 and 6, whose structure is reported above, is the GlycoAge test. Peak 1 is the agalactosylated glycan also referred to as NGA2F present in IgG-G0. Peak 6 is its bigalactosylated counterpart also referred to as NA2F. B. Role of B4GALTs and of ST6GAL1 in the biosynthesis of N-glycans. Core-linked fucose is in parenthesis to indicate that its presence is not necessary for the activity of the two glycosyltransferases. C. correlation between the GlycoAge test and age in individuals from infancy to centenarians. Both the linear and quadratic relationships were significant (linear: R2 = 0.608; p <= 0.00001; quadratic: R2 = 0.689, p < 0.00001), but the latter fit better. D. the highly significant relationship between the GlycoAge test and B4GALTs activity (R2 = 0.263; p = 0.00001), was lost after age-adjustment E.. F. the significant relationship between the GlycoAge test and plasmatic ST6GAL1 activity (R2 = 0.085; p = 0.0032) was maintained after age adjustment (R2 = 0.083; p = 0.0036) G. H. no significant relationship existed between plasmatic ST6GAL1 and B4GALTs activities (R2 = 0.003; p 0.561).

