

Abstract
Two sensitive and selective analytical methods were developed for simultaneous determination of aminoacridine hydrochloride and lidocaine hydrochloride in bulk powder and pharmaceutical formulation. Method A was based on HPLC separation of the cited drugs with determination of the toxic lidocaine-related impurity 2,6-dimethylaniline. The separation was achieved using reversed-phase column C18, 250 × 4.6 mm, 5 µm particle size and mobile phase consisting of 0.05 M disodium hydrogen phosphate dihydrate (pH 6.0 ± 0.2 adjusted with phosphoric acid) and acetonitrile (55 : 45, v/v). Quantitation was achieved with UV detection at 240 nm. Linear calibration curve was in the range of 1.00–10.00, 13.20–132.00 and 1.32–13.20 µg mL−1 for aminoacridine hydrochloride, lidocaine hydrochloride and 2,6-dimethylaniline, respectively. Method B was based on TLC separation of the cited drugs followed by densitometric measurement at 365 nm on the fluorescent mode for aminoacridine hydrochloride and 220 nm on the absorption mode for lidocaine hydrochloride. The separation was carried out using ethyl acetate–methanol–acetic acid (65 : 30 : 5 by volume) as a developing system. The calibration curve was in the range of 25.00–250.00 ng spot−1 and 0.99–9.90 µg spot−1 for aminoacridine hydrochloride and lidocaine hydrochloride, respectively. The results obtained were statistically analyzed and compared with those obtained by applying the manufacturer's method.
Introduction
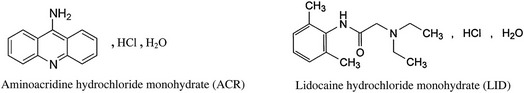
Aminoacridine (aminacrine) hydrochloride monohydrate (ACR) is chemically known as 9-aminoacridine (1). It is a mild antiseptic that kills a variety of bacteria that might infect sore or broken skin in the mouth (2). 9-Aminoacridines are the most active and stronger bases than other aminoacridines (3).
Lidocaine (lignocaine) hydrochloride monohydrate (LID) is chemically known as 2-(diethylamino)-N-(2,6-dimethylphenyl)acetamide. It belongs to a group of medicines known as local anesthetics (4). When applied locally, it works by stopping the sodium entering the nerve ending at the site of the pain. This prevents an electrical signal building up and passing along the nerve fibers to the brain. In this way, lidocaine causes numbness and relieved pain at the area it was applied to. For the anesthetic activity, the existence of a balance between the lipophilic and hydrophilic parts of the molecule is essential (3).
The combination of ACR and LID is found in pharmaceutical formulation Medijel® oral gel. The antiseptic ACR prevents the irritated areas from getting infected, and LID is used to relieve pain caused by mouth ulcers, sore gums and denture irritation. There were no reported methods for their simultaneous determination. Few spectrophotometric, fluorimetric and TLC methods (5–7) were reported for determination of ACR. A lot of methods were reported for determination of LID, for example, some of the latest methods include spectrophotometry (8–10), electrochemical (11–13), HPLC (14–20) and capillary electrophoresis (21–24).
The novelty of this research was to develop HPLC and TLC-densitometric methods for simultaneous determination of ACR and LID in their binary mixture as there were no reported methods for their simultaneous determination. There was also a need for the detection and determination of the toxic lidocaine-related impurity if present with the cited mixture.
2,6-Dimethylaniline (DMA) is a yellowish liquid stated in British Pharmacopoeia (25) as major impurity of lidocaine in bulk powder and dosage forms. It is also used in the synthesis of LID (26) and considered to be its major degradation product (27), which is a pharmacologically inactive metabolite (28). It is absorbed through the skin and mucosa causing damage to the following organs: blood, kidneys, liver and heart, causing arrhythmias, tachycardia and heart block. It is mutagenic causing methemoglobinemia including hypoxia, apnea and cyanosis (a bluish discoloration of the skin due to deficient oxygenation) (29). It may cause nasal olfactory mucosa cancer and classified as Class 2B (possible for human) (30). Its chemical cancer potency is 0.0063 mg/(kg body weight-day)−1 estimated from dose–response data for nasal cavity tumors in male and female rats (31, 32).
Experimental
Instruments
HPLC Agilent model 1200 was equipped with a quaternary pump, Rheodyne injector with a 20-µL loop and UV detector (Germany). Separation and quantitation were made on ACE C18-AR, 250 × 4.6 mm, 5 µm particle size column. The detector was set at 240 nm. The instrument was connected to an IBM compatible PC and HP disk jet printer.
Reversed-phase TLC 20 × 20 cm aluminum sheets precoated with silica gel F254, 0.25 mm thickness, Merck (Germany), were used. The samples were applied to the plate using 25 µL Hamilton Analytical Syringe.
CAMAG dual wavelength flying spot densitometer was used with video display and high-speed, high-quality, parallel-head printer plotter (Switzerland). The instrument was connected to an IBM compatible PC and HP disk jet printer. The following requirements were taken into consideration—the measuring mode: fluorescent for the determination of ACR and absorbance for the determination of LID; slit dimensions: 4 × 0.3 mm; scanning speed: 20 mm s−1; data resolution: 100 µm per step; optimize optical system for maximum: light; band width: 20 mm and result output: chromatogram and area under the peak.
pH meter HANAA 8417 (Portugal) was used.
Materials and chemicals
Pure standard
ACR was kindly supplied by Sigma-Aldrich; its purity was 99.30% according to the manufacturer's HPLC method.
LID was kindly supplied by Al Deibeiky Pharma, Egypt; its purity was 99.97% according to the USP (33) method.
Lidocaine-related impurity (DMA) was kindly supplied by Sigma-Aldrich, and its purity was 99.97%.
Pharmaceutical dosage form
Medijel® oral gel was labeled to contain ACR 0.05% (w/w) and LID 0.66% (w/w). The inactive ingredients were ethyl vanillin, saccharin sodium, sucrose, ethanol 96%, glycerol, carbomer, diisopropanolamine 90% aqueous, hydroxypolyethoxydodecane, peppermint oil and deionized water. It was manufactured by DDD Ltd, Watford, UK (batch no. BNFEB11).
Chemicals
All chemicals used were of analytical grade, and the solvents were of HPLC and spectroscopic grade. Phosphoric acid, acetone, methanol, ethyl acetate, glacial acetic acid, sodium carbonate (Adwic), disodium hydrogen phosphate dihydrate and acetonitrile of HPLC grade (SDFCL) were used. The water for HPLC was prepared by double glass distillation and filtration through a 0.45-µm membrane filter.
Chromatographic conditions
HPLC method
The chromatographic separation was carried out at ambient temperature using column ACE C18, 250 × 4.6 mm, 5 µm particle size and a mobile phase consisting of 0.05 M disodium hydrogen phosphate dihydrate (pH 6.0 ± 0.2 adjusted with phosphoric acid) and acetonitrile (55 : 45, v/v). The mobile phase was filtered using 0.45 µm Millipore membrane filter and degassed by ultrasonic vibrations prior to use. The flow rate of the mobile phase was 1 mL min−1. A volume of 20 µL of each solution was injected and the detector was adjusted at 240 nm.
TLC-densitometric method
The analysis was performed on 20 × 20 cm TLC aluminum sheets precoated with silica gel F254, 0.25 mm thickness. A volume of 5 µL of different concentrations of standard solutions of ACR and LID was applied as spots to the plate using 25 µL Hamilton Analytical Syringe. The spots were spaced 20 mm apart and 20 mm from the bottom of the plate. The chromatographic chamber was presaturated with the developing system for 15 min, and the plate was developed by ascending chromatography using ethyl acetate–methanol–acetic acid (65 : 30 : 5 by volume) as a developing system to the distance of 14 cm. The plate was air-dried at room temperature, detected under UV lamp and scanned at 365 and 220 nm for ACR and LID, respectively.
Standard solutions
HPLC method
Stock and working standard solutions of ACR (1.0 mg mL−1 and 20.0 µg mL−1, respectively) in a degassed solvent mixture of water–acetonitrile (55 : 45%, v/v) were prepared. Stock standard solution of LID (264.0 µg mL−1) was prepared in the solvent mixture. Stock and working standard solutions of DMA (264.0 and 26.4 µg mL−1, respectively) were prepared in the solvent mixture.
TLC-densitometric method
Stock standard solutions of ACR (100.0 µg mL−1) and LID (3.96 mg mL−1) were prepared in methanol.
Laboratory prepared mixtures
HPLC method
Different aliquots of ACR containing 20.0, 90.0, 50.0, 100.0, 30.0 and 10.0 µg from its working standard solution (20.0 µg mL−1) were transferred into a series of 10-mL volumetric flasks. Aliquots of LID containing 264.0, 1,056, 660.0, 132.0, 396.0 and 1,320.0 µg from its stock standard solution (264.0 µg mL−1) were added, and then aliquots of DMA containing 13.2, 39.6, 52.8, 79.2, 105.6 and 118.8 µg from its working solution (26.4 µg mL−1) were transferred. Then the volume was completed to the mark with the solvent to prepare mixtures of different ratios of ACR, LID and DMA.
TLC-densitometric methods
Different aliquots of ACR containing 300.0, 250.0, 300.0, 450.0, 50.0 and 500.0 µg from its stock standard solution (100.0 µg mL−1) were transferred into a series of 10-mL volumetric flasks, and then aliquots of LID containing 3.96, 9.90, 13.86, 9.90, 19.80 and 1.98 mg from its stock standard solution (3.96 mg mL−1) were added. The volume was completed to the mark with methanol to prepare mixtures of different ratios of ACR and LID.
Methods
Construction of calibration curve for HPLC method
Aliquots equivalent to 10.0–100.0 μg of ACR, 132.0–1,320.0 μg of LID and 13.2–132.0 µg of DMA were separately transferred from their standard solutions (20.0, 264.0 and 26.4 µg mL−1) into a series of 10-mL volumetric flasks. The volume was completed to the mark with the solvent mixture. Triplicate 20 μL injections were made for each concentration and chromatographed under the conditions described above. The peak area of each concentration was plotted against the corresponding concentration to obtain the calibration curves, then the regression equations of ACR, LID and DMA were computed.
Construction of calibration curve for TLC-densitometric method
Aliquots equivalent to 50.0–500.0 µg of ACR and 1.98–19.80 mg of LID were separately transferred from their stock standard solutions (100.0 µg mL−1 and 3.96 mg mL−1) into a series of 10-mL volumetric flasks and completed to the mark with methanol. From each standard solution, 5 μL was applied to the TLC plate to get the range of 25.0–250.0 ng spot−1 and 0.99–9.90 µg spot−1 for ACR and LID, respectively. Triplicate applications were made for each solution, the plates were chromatographed as mentioned above and the peak areas were measured. The calibration curves of ACR and LID were constructed, and the regression equations were computed.
Preparation of pharmaceutical formulation
HPLC method
An accurately weighed 4 g of the gel (equivalent to 2.0 mg of ACR and 26.4 mg of LID) was transferred into a 100-mL volumetric flask; 70 mL of the solvent was added and dissolved by the aid of magnetic stirrer for 20 min. The volume was completed to the mark with the solvent mixture and filtered to obtain stock solution of final concentration 20.0 µg mL−1 of ACR and 264.0 µg mL−1 of LID.
TLC-densitometric method
An accurately weighed 6 g of the gel (equivalent to 3.0 mg of ACR and 39.60 mg of LID) was transferred into a 100-mL volumetric flask, and ∼70 mL of methanol was added. The procedure was followed as under construction of calibration curve to obtain stock solution of final concentration 30.0 µg mL−1 of ACR and 396.0 µg mL−1 of LID.
The sample solutions were then filtered using 0.45 µm filters. The general procedures for HPLC and TLC-densitometric methods described under construction of calibration curves were followed, and the concentrations of ACR and LID were calculated.
Pharmaceutical formulation stability under mild acid and alkali conditions
An accurately weighed 4 g of the gel was transferred into a 100-mL volumetric flask; 70 mL of 0.1 M acetic acid was added and dissolved by the aid of magnetic stirrer for 20 min. The volume was completed to the mark with the same solvent and filtered. The solution was left for 3 h at 20°C. The general procedure for the proposed HPLC method described under construction of calibration curves was followed. Another solution was prepared with the same manner using 0.01 M sodium carbonate instead of acetic acid.
Results
The best resolution with sharp and symmetric peaks for the HPLC method was obtained using mobile phase of 0.05 M disodium hydrogen phosphate dihydrate (pH 6.0 ± 0.2 adjusted with phosphoric acid) and acetonitrile (55 : 45, v/v, Figure 1A). Good separation of ACR, LID and DMA from the inactive ingredients of the pharmaceutical formulation was done. The retention times of ACR, LID and DMA were found to be 2.97, 4.71 and 8.85 ± 0.2 min, respectively, as shown in Figure 1B. System suitability parameters of the proposed HPLC method were calculated according to the USP (33) showing good resolution, selectivity and symmetrical peaks (Table I).
Figure 1.

High-performance liquid chromatogram of (A) mixture of aminoacridine HCl (1.0 μg mL−1), lidocaine HCl (132.0 μg mL−1) and 2,6-dimethyl aniline (11.88 μg mL−1). (B) The test Medijel® showing aminoacridine HCl (2.0 μg mL−1), lidocaine HCl (26.4 μg mL−1) and other inactive substances. Using column ACE C18 (250 × 4.6 mm, 5 µm particle size), mobile phase consisting of mixture of 0.05 M disodium hydrogen phosphate dihydrate (pH 6.0 ± 0.2 adjusted with phosphoric acid)–acetonitrile (55 : 45, v/v), flow rate was 1 mL min−1 and detection at 240 nm.
Table I.
System Suitability Parameters of the Proposed HPLC Method
| Parameter | Obtained value |
Reference value | ||
|---|---|---|---|---|
| ACR | LID | DMA | ||
| Resolution (Rs) | 11.22 | 19.21 | R > 1.5 | |
| Selectivity (α) | 4.70 | 2.86 | >1 | |
| Tailing factor (T) | 0.82 | 1.13 | 0.88 | ∼1 |
| Capacity factor (K′) | 1.12 | 2.36 | 5.32 | 1–10 |
| Number of theoretical plates (N) | 7,914 | 8,824 | 20,095 | Increase with efficiency of separation |
| Height equivalent to theoretical plate (HETP) cm plate−1 | 3.2 × 10⁻³ | 2.8 × 10⁻³ | 1.2 × 10⁻³ | The smaller the value the higher the column efficiency |
| Retention time, min ± 0.2 | 2.97 | 4.71 | 8.85 | |
For the TLC-densitometric method, good separation was obtained using ethyl acetate–methanol–acetic acid (65 : 30 : 5 by volume) as a developing system. The retardation factors (Rf) of ACR and LID were found to be 0.40 ± 0.03 and 0.18 ± 0.03, respectively, as shown in Figures 2 and 3.
Figure 2.

Densitogram of (A) aminoacridine hydrochloride (150.0 ng spot−1) at 365 nm fluorescent mode and (B) lidocaine hydrochloride (1.98 µg spot−1) at 220 nm absorption mode using ethyl acetate–methanol–acetic acid (65 : 30 : 5 by volume) as a developing system.
Figure 3.

Scanning profile of thin layer chromatogram of (A) aminoacridine hydrochloride (25.0–250.0 ng spot−1) at 365 nm fluorescent mode and (B) lidocaine hydrochloride (0.99–9.90 µg spot−1) at 220 nm absorption mode using ethyl acetate–methanol–acetic acid (65 : 30 : 5 by volume) as a developing system.
Method validation was performed according to ICH guidelines (34) for the proposed HPLC and TLC-densitometric methods. The results of the proposed methods validation are shown in Table II, indicating good accuracy, repeatability and intermediate precision. Characteristic parameters for the regression equations of the proposed methods and the correlation coefficients, obtained by least squares treatment of the results, are also given in Table II. The proposed methods could be used for routine analysis of ACR and LID in laboratory prepared mixtures (Table III). Table IV shows that the proposed methods were also applied for determination of the cited drugs in their pharmaceutical formulation Medijel® oral gel in quality control laboratories without interference from the excipients.
Table II.
Results of the Validation Parameters of the Proposed Methods for the Determination of Aminoacridine Hydrochloride, Lidocaine Hydrochloride and DMA
| Characteristic parameter | HPLC method |
TLC-densitometric method |
|||
|---|---|---|---|---|---|
| ACR | LID | DMA | ACR | LID | |
| Range | 1.00–10.00 μg mL−1 | 13.20–132.00 μg mL−1 | 1.32–13.20 μg mL−1 | 25.00–250.00 ng spot−1 | 0.99–9.90 µg spot−1 |
| Linearity | |||||
| Slope | 76.3890 | 6.0314 | 69.2730 | 340.0284 | 1113.5762 |
| Intercept | 6.1721 | 11.3770 | − 4.9631 | −2815.3075 | 256.2940 |
| Correlation coefficient (r) | 0.9997 | 0.9999 | 0.9998 | 0.9997 | 0.9997 |
| SE of the slopea | 0.85843 | 0.0284 | 0.6236 | 3.9237 | 11.7774 |
| CL of the slopeb | 74.1827–78.5960 | 5.9585–6.1045 | 67.6702–70.8762 | 329.9424–350.1145 | 68.7914–443.7993 |
| SE of the intercept | 5.3902 | 2.3563 | 5.1687 | 617.7646 | 72.9422 |
| CL of the intercept | −7.6839–20.0282 | 5.3201–17.4340 | −18.24497–8.3235 | −4403.3219 to −1227.2931 | 1083.3015–1143.8510 |
| Accuracy (mean ± RSD) | 99.68 ± 1.19 | 99.47 ± 0.41 | 100.82 ± 0.99 | 100.38 ± 0.73 | 99.46 ± 1.14 |
| Precision (% RSD) | |||||
| Repeatabilityc | 0.27 | 0.43 | 0.50 | 0.97 | 0.86 |
| Intermediate precisiond | 0.46 | 0.60 | 0.75 | 1.03 | 1.90 |
| Specificity and selectivity | 98.73 ± 0.54 | 99.51 ± 1.08 | 100.74 ± 1.01 | 98.73 ± 0.54 | 99.51 ± 1.08 |
| Robustnesse | 99.95 ± 0.99 | 99.98 ± 1.09 | 100.60 ± 0.59 | – | – |
| LODf | 0.28 μg mL−1 | 1.56 μg mL−1 | 0.22 μg mL−1 | 7.23 ng spot−1 | 0.27 µg spot−1 |
| LOQf | 0.85 μg mL−1 | 4.74 μg mL−1 | 0.67 μg mL−1 | 21.90 ng spot−1 | 0.82 µg spot−1 |
aStandard error.
bConfidence limit.
cThe intraday (n = 3), average of three different concentrations repeated three times within day.
dThe interday (n = 3), average of three different concentrations repeated three times in three successive days.
eAverage of the change of pH (±0.2), flow rate (±0.1 min) and ratio of mobile phase (±2%).
fLimit of detection and limit of quantitation are calculated by LOD = (SD of the response/slope) × 3.3 and LOQ = (SD of the response/slope) × 10.
Table III.
Determination of Aminoacridine Hydrochloride, Lidocaine Hydrochloride and DMA in Laboratory Prepared Mixtures by the Proposed Methods
| HPLC method |
TLC method |
|||||||||
|---|---|---|---|---|---|---|---|---|---|---|
| Concentration (μg mL−1) |
% Added of DMA | Recovery %a |
Concentration |
Recovery %a |
||||||
| ACR | LID | DMA | ||||||||
| ACR | LID | DMA | ACR (ng spot−1) | LID (µg spot−1) | ACR | LID | ||||
| 2.0 | 26.4b | 1.32 | 4.76 | 98.00 | 98.25 | 101.11 | 150.00 | 1.98b | 98.00 | 98.25 |
| 9.0 | 105.6 | 3.96 | 3.61 | 99.28 | 100.41 | 101.48 | 125.00 | 4.95 | 99.28 | 100.41 |
| 5.0 | 66.0b | 5.28 | 7.41 | 98.68 | 99.51 | 99.44 | 150.00 | 6.93 | 98.68 | 99.51 |
| 10.0 | 13.2 | 7.92 | 37.50 | 99.36 | 101.11 | 99.43 | 225.00 | 4.95 | 99.36 | 101.11 |
| 3.0 | 39.6 | 10.56 | 21.05 | 98.70 | 98.80 | 101.49 | 25.00 | 9.90 | 98.70 | 98.80 |
| 1.0 | 132.0 | 11.88 | 8.26 | 98.33 | 99.00 | 101.48 | 250.00 | 0.99 | 98.33 | 99.00 |
| Mean ± RSD | 98.73 ± 0.54 | 99.51 ± 1.08 | 100.74 ± 1.01 | Mean ± RSD | 98.73 ± 0.54 | 99.51 ± 1.08 | ||||
aAverage of three determinations.
bThe ratio of ACR and LID similar to pharmaceutical formulation.
Table IV.
Determination of Aminoacridine Hydrochloride and Lidocaine Hydrochloride in Pharmaceutical Formulation by the Proposed Methods and Application of Standard Addition Technique
| Parameter | Aminoacridine hydrochloride |
Lidocaine hydrochloride |
||||
|---|---|---|---|---|---|---|
| HPLC method | TLC method | Manufacturer methoda | HPLC method | TLC method | Manufacturer methoda | |
| Mean ± RSDb of Medijel®c | 99.22 ± 0.84 | 99.55 ± 0.88 | 100.23 ± 0.75 | 100.56 ± 1.21 | 100.13 ± 1.04 | 99.15 ± 0.93 |
| SD | 0.83 | 0.88 | 0.75 | 1.22 | 1.04 | 0.92 |
| Variance | 0.69 | 0.77 | 0.56 | 1.49 | 1.08 | 0.85 |
| n | 5 | 5 | 5 | 5 | 5 | 5 |
| Student's t-test (2.306)d | 2.020 | 1.320 | 2.061 | 1.578 | ||
| F-value (6.39)d | 1.23 | 1.38 | 1.75 | 1.27 | ||
| Recoverye of standard addition technique | 98.90 ± 0.67 | 100.92 ± 0.62 | 99.13 ± 1.00 | 99.04 ± 0.60 | ||
aManufacturer HPLC method (was kindly supplied by personal communication) using ODS 250 × 4.6 mm, 5 μm column, mobile phase mixture of 265 mL acetonitrile and 235 mL potassium dihydrogen phosphate (6.8 g and 30 mL 1 N NaOH in 1 L water) and detection at 254 nm.
bPercentage relative standard deviation for five determinations.
cLabeled to contain 0.05% aminoacridine HCl and 0.66% lidocaine HCl.
dTheoretical value for t and F at P = 0.05.
eFor standard addition of different concentrations of aminoacridine HCl and lidocaine HCl.
The pharmaceutical formulation was subjected to 0.1 M acetic acid and 0.01 M sodium carbonate left for 3 h at 20°C and analyzed by the proposed HPLC method. ACR and LID were found to be 97.98 and 95.00%, respectively. The impurity DMA was detected to be 0.24 μg mL−1 as shown in Figure 4.
Figure 4.

The HPLC chromatogram (zoomed in) of the test Medijel® containing aminoacridine HCl (2.0 μg mL−1) and lidocaine HCl (26.4 μg mL−1) subjected to (A) 0.1 M acetic acid for 3 h at 20°C showing the impurity DMA (∼0.24 μg mL−1) and other inactive substances. (B) 0.01 M sodium carbonate for 3 h at 20°C showing the impurity DMA (∼0.24 μg mL−1) and other inactive substances.
Statistical comparison of the results of ACR and LID analysis obtained by the proposed methods and the manufacturer one was also done using Student's t-test and the F-ratio at 95% confidence level (Tables IV and V). It was clear that there was no significant difference between the proposed methods with regard to accuracy and precision.
Table V.
Statistical Comparison Between the Proposed and Manufacturer Method
| Parameter | Aminoacridine hydrochloride |
Lidocaine hydrochloride |
||||
|---|---|---|---|---|---|---|
| HPLC method | TLC method | Manufacturer methoda | HPLC method | TLC method | Manufacturer methoda | |
| Mean ± RSDb | 99.68 ± 1.19 | 100.38 ± 0.73 | 99.30 ± 0.84 | 99.47 ± 0.41 | 99.46 ± 1.14 | 99.97 ± 1.00 |
| SD | 1.19 | 0.73 | 0.83 | 0.41 | 1.13 | 1.00 |
| Variance | 1.42 | 0.53 | 0.69 | 0.17 | 1.28 | 1.00 |
| n | 5 | 5 | 5 | 5 | 5 | 5 |
| Student's t-test (2.306)c | 0.586 | 2.188 | 1.035 | 0.756 | ||
| F-value (6.39)c | 2.06 | 1.30 | 5.88 | 1.28 | ||
aManufacturer HPLC method (was kindly supplied by personal communication) using ODS 250 × 4.6 mm, 5 μm column, mobile phase mixture of 265 mL acetonitrile and 235 mL potassium dihydrogen phosphate (6.8 g and 30 mL 1 N NaOH in 1 L water) and detection at 254 nm.
bAverage of five determinations.
cTabulated values for t and F at P = 0.05.
Discussion
The proposed HPLC and TLC-densitometric methods were used for simultaneous determination of ACR and LID in their pharmaceutical formulation without either pretreatment or preliminary separation. Besides, the HPLC method was used for determination of lidocaine-related impurity, DMA, which is a pharmacologically inactive metabolite (28). It is absorbed through the skin and mucosa causing damage to the following organs: blood, kidneys, liver and heart, causing arrhythmias, tachycardia and heart block. The British Pharmacopoeia (25) stated that the limit of LID impurity was 0.01%, so it is important to be determined in LID pharmaceutical formulations. Lidocaine hydrochloride has an amide linkage, which is susceptible to hydrolysis and thermal degradation to this impurity (DMA) (35). The impurity will increase by time because lidocaine degradation is first-order kinetics (36).
HPLC method
Several trials were carried out to obtain a good resolution between the cited components. These trials involved the use of different mobile phases with different ratios, different pH and flow rates.
The pH of the mobile phase was very critical, affecting the retention time of ACR, LID and DMA. At pH 3.0, ACR was not well separated, and LID and DMA were separated at retention times 5.80 and 7.00 min, respectively. By increasing the pH to 8.0, ACR was separated at 3.80 min, and the retention time of LID and DMA was delayed to be 16.70 and 10.00 min, respectively. Therefore, the optimum pH was 6.0 ± 0.2 to ensure best separation of the three cited components from each other and from the inactive ingredients in the pharmaceutical formulation.
Several wavelengths were tested (210, 220, 230, 240, 250 and 260 nm). The most suitable wavelength was 240 nm to detect the three components, especially DMA. The mobile phase was delivered at different rates (0.8, 1.0 and 1.5 mL min−1), and the optimum one was 1.0 mL min−1, which provides maximum separation with minimum run time. Robustness was done by changing the pH (±0.2), flow rate (±0.1 min) and ratio of the mobile phase (±2%) as shown in Table II.
The proposed HPLC could determine ACR and LID in their pharmaceutical formulation without interference from the inactive ingredients. It was capable for the detection and determination of the lidocaine-related impurity (DMA) as it is very toxic. The separation of the cited compounds by the proposed method was done in short time before 10 min.
The impurity if present in pharmaceutical formulation due to bad storage condition, the proposed HPLC will detect it with minimum detection level of 0.22 µg mL−1. When the pharmaceutical formulation was subjected to acetic acid and sodium carbonate as an example of mild conditions of acid and alkali, this impurity was formed besides ACR and LID were in the range of 90–110% of their labeled claim.
The advantages of the proposed HPLC method over the manufacturer one were the higher sensitivity of ACR and the capability of the determination of DMA. The proposed HPLC method had advantage over the reported one (19) of separating ACR from the inactive ingredients in the pharmaceutical formulation. Also, the proposed HPLC method separated LID faster than the British Pharmacopoeia method (25).
TLC-densitometric method
Different parameters that affect the efficiency of the chromatographic separation were tested and optimized to obtain maximum separation of the cited components. The TLC-densitometric method was optimized to be capable of separating ACR and LID.
Many trials were done to choose a developing system that can affect the separation. By using different ratios of ethyl acetate and methanol (90 : 10, 80 : 20, 65 : 30 and 30 : 70, v/v), ACR and LID showed bad separation, and ACR was developed at lower Rf than LID. It was concluded that by decreasing the ratio of ethyl acetate and increasing the ratio of methanol, the two components started to develop away from the baseline with poor resolution.
When 5% of acetic acid was added to the ratios of ethyl acetate and methanol, the separation was changed and ACR was developed at higher Rf than LID due to the change in polarity of the developing system. The optimum developing system was ethyl acetate–methanol–acetic acid in the ratio of 65 : 30 : 5 by volume.
Several wavelengths were tested for the determination of both ACR and LID (210, 220 and 254 nm), but ACR could not be well detected as it is highly fluorescent compound. The optimum way of detection was to measure ACR at 365 nm by adjusting the instrument at the fluorescent mode and measure LID at 220 nm by adjusting the instrument at the absorption mode.
Conclusion
The proposed work provided simple, sensitive, selective and accurate HPLC and TLC-densitometric methods for determination of ACR and LID in bulk powder and pharmaceutical formulation without interference from the excipients. The proposed methods were validated according to ICH guidelines and could be used for routine analysis of ACR and LID in quality control laboratories, where economy and time were essential. The proposed HPLC method could determine the related impurity of LID, which was very toxic. The proposed TLC-densitometric method had the advantages of short run time, large sample capacity and the use of minimal value of solvent.
References
- 1.O'Neil J.; The Merck index: an encyclopedia of chemicals, drugs and biologicals, 14th ed Merck, Whitehouse Station, NJ, USA: (2006). [Google Scholar]
- 2.Wainright M.; Acridine—a neglected antibacterial chromophore; Journal of Antimicrobial Chemotherapy, (2001); 47: 1–13. [DOI] [PubMed] [Google Scholar]
- 3.Korolkovas A.; Essentials of medicinal chemistry, 2nd ed., Wiley-Interscience, USA: (1988). [Google Scholar]
- 4.Sweetman S.; Martindale: the extra pharmacopoeia, The Complete Drug Reference, 37th ed., The Pharmaceutical Press, London, UK: (2011). [Google Scholar]
- 5.Bunch E.; Spectrophotometric determination of aminacrine hydrochloride in creams, jellies, and suppositories: interlaboratory study; Journal of the Association of Official Analytical Chemists, (1987); 70: 560–565. [PubMed] [Google Scholar]
- 6.Martinez Calatayud J., Sanchez Sampedro A., Villar Civera P., Gomez Benito C.; Spectrophotometric and fluorimetric determination of 9-amino acridine by flow injection analysis; Analytical Letters, (1990); 23: 2315–2325. [Google Scholar]
- 7.Dittamo M., Kraus L., Lee A., Sherma J.; Determination of aminacrine hydrochloride in drug preparations by TLC with fluorescence densitometry; Journal of Liquid Chromatography, (1985); 8: 1247–1254. [Google Scholar]
- 8.Ivanov V., Adamova E., Figurovskaya V.; Sorption-spectrophotometry and chromaticity determination of some organic bases used in local anesthesia using Alizarin Red C; Journal of Analytical Chemistry, (2012); 67: 429–436. [Google Scholar]
- 9.Abdukirem K., Turghun M., Mamtimin M.; Spectrophotometric determination of lidocaine in injections by charge-transfer reaction; Fenxi Shiyanshi, (2011); 30: 19–22. Through Analytical Abstract. [Google Scholar]
- 10.Donmez O., Bozdogan A., Kunt G., Div Y.; Spectrophotometric multicomponent analysis of a mixture of chlorhexidine hydrochloride and lidocaine hydrochloride in pharmaceutical formulation using derivative spectrophotometry and partial least-squares multivariate calibration; Journal of Analytical Chemistry, (2010); 65: 30–35. [Google Scholar]
- 11.Giahi M., Pournaghdy M., Rakhshaee R.; A new lidocaine-selective membrane electrode based on its sulfathiazole ion-pair; Journal of Analytical Chemistry, (2009); 64: 195–200. [Google Scholar]
- 12.Oliveira R., Salazar Banda G., Ferreira V., Oliveira S., Avaca L.; Electroanalytical determination of lidocaine in pharmaceutical preparations using boron-doped diamond electrodes; Electroanalysis, (2007); 19: 1189–1194. [Google Scholar]
- 13.Norouzi P., Ganjali M., Daneshgar P., Dinarvand R., Moosavi Movahedi A., Saboury A.; Development of fast Fourier transform continuous cyclic voltammetry at Au microelectrode in flowing solutions as a novel method for sub-nanomolar monitoring of lidocaine in injection and biological fluids; Analytica Chimica Acta, (2007); 590: 74–80. [DOI] [PubMed] [Google Scholar]
- 14.Belal T., Haggag R.; Gradient HPLC-DAD stability indicating determination of miconazole nitrate and lidocaine hydrochloride in their combined oral gel dosage form; Journal of Chromatographic Science, (2012); 50: 401–409. [DOI] [PubMed] [Google Scholar]
- 15.Shaalan R., Belal T.; HPLC-DAD stability indicating determination of nitrofurazone and lidocaine hydrochloride in their combined topical dosage form; Journal of Chromatographic Science, (2010); 48: 647–653. [DOI] [PubMed] [Google Scholar]
- 16.Qin W., Jiao Z., Zhong M., Shi X., Zhang J., Li Z. et al. ; Simultaneous determination of procaine, lidocaine, ropivacaine, tetracaine and bupivacaine in human plasma by high-performance liquid chromatography; Journal of Chromatography B: Analytical Technologies in the Biomedical and Life Sciences, (2010); 878: 1185–1189. [DOI] [PubMed] [Google Scholar]
- 17.Ma D., Xu X., Lian W., Chen Y., Wu Y.; Investigation of tryptophan in gastric juice by high performance liquid chromatography coupling with ultraviolet, fluorescence detection and mass spectrometric identification; Fenxi Huaxue, (2009); 37: 1617–1621. Through Analytical Abstract. [Google Scholar]
- 18.de Orsi D., Pellegrini M., Marchei E., Nebuloni P., Gallinella B., Scaravelli G. et al. ; High performance liquid chromatography-diode array and electrospray-mass spectrometry analysis of vardenafil, sildenafil, tadalafil, testosterone and local anesthetics in cosmetic creams sold on the Internet web sites; Journal of Pharmaceutical and Biomedical Analysis, (2009); 50: 362–369. [DOI] [PubMed] [Google Scholar]
- 19.Mohammad M.; LC determination of lidocaine and prilocaine containing potential risky impurities and application to pharmaceuticals; Chromatographia, (2009); 70: 563–568. [Google Scholar]
- 20.Salas S., Talero B., Rabasco A., Gonzalez Rodriguez M.; Development and validation of a reverse-phase liquid chromatographic method for the assay of lidocaine hydrochloride in alginate-Gantrez(R) microspheres; Journal of Pharmaceutical and Biomedical Analysis, (2008); 47: 501–507. [DOI] [PubMed] [Google Scholar]
- 21.Li Y., Cai Z., Wang C., Chen Z.; Determination of lidocaine hydrochloride in lidocaine hydrochloride injection with microfluidic chip; Fenxi Ceshi Xuebao, (2010); 29: 864–866. Through Analytical Abstract. [Google Scholar]
- 22.Lombardo Aguia M., Cruses Blanco C., Garcia Campana A.; Capillary zone electrophoresis with diode-array detection for analysis of local anesthetics and opium alkaloids in urine samples; Journal of Chromatography B: Analytical Technologies in the Biomedical and Life Sciences, (2009); 877: 833–836. [DOI] [PubMed] [Google Scholar]
- 23.Sun H., Li L., Su M.; Simultaneous determination of lidocaine, proline and lomefloxacin in human urine by CE with electrochemiluminescence detection; Chromatographia, (2008); 67: 399–405. [Google Scholar]
- 24.Chik Z., Johnston A., Tucker A., Burn R., Perrett D.; Validation and application of capillary electrophoresis for the analysis of lidocaine in a skin tape stripping study; Biomedical Chromatography, (2007); 21: 775–779. [DOI] [PubMed] [Google Scholar]
- 25.British Pharmacopoeia, Her Majesty's Stationery Office, London, (2014). [Google Scholar]
- 26.Reilly T.; The preparation of lidocaine; Journal of Chemical Education, (1999); 76: 1557. [Google Scholar]
- 27.Waraszkiewicz S., Milano E., DiRubio R.; Stability-indicating high-performance liquid chromatographic analysis of lidocaine hydrochloride and lidocaine hydrochloride with epinephrine injectable solutions; Journal of Pharmaceutical Sciences, (1981); 70: 1215–1218. [DOI] [PubMed] [Google Scholar]
- 28.Parker R., Collins J., Strong J.; Identification of 2,6-xylidine as a major lidocaine metabolite in human liver slices; Drug Metabolism and Disposition, (1996); 24: 1167–1173. [PubMed] [Google Scholar]
- 29.Onji Y., Tyuma I.; Methemoglobin formation by a local anesthetic and some related compounds; Acta Anaesthesiologica Scandinavica, (1965); 9: 151–159. [DOI] [PubMed] [Google Scholar]
- 30.Tydén E., Tjalve H., Larsson P.; Metabolic activation of 2,6-xylidine in the nasal olfactory mucosa and the mucosa of the upper alimentary and respiratory tracts in rats; The Journal of Toxicological Sciences, (2004); 81: 263–272. [DOI] [PubMed] [Google Scholar]
- 31.Reproductive and Cancer Hazard Assessment Section. Office of Environmental Health Hazard Assessment (OEHHA), California Environmental Protection Agency; (2002), http://oehha.ca.gov/prop65/CRNR_notices/pdf_zip/26XylidineNSRL_Aug2002.pdf. [Google Scholar]
- 32.Yasuhara K., Kobayashi H., Shimamura Y., Koujitani T., Onodera H., Takagi H. et al. ; Toxicity and blood concentrations of xylazine and its metabolite, 2,6-dimethylaniline, in rats after single or continuous oral administrations; The Journal of Toxicological Sciences, (2000); 25: 105–113. [DOI] [PubMed] [Google Scholar]
- 33.The United States Pharmacopeia and National Formulary. USP 37-NF 32, U.S. Pharmacopeial Convention, Rockville, MD: (2014). [Google Scholar]
- 34.ICH, Q2 (R1). Validation of analytical procedures: text and methodology. International Conference on Harmonization, IFPMA, Geneva, Switzerland, (2005). [Google Scholar]
- 35.Powell Michael F.; Stability of lidocaine in aqueous solution: effect of temperature, pH, buffer, and metal ions on amide hydrolysis; Pharmaceutical Research, (1987); 4: 42–45. [DOI] [PubMed] [Google Scholar]
- 36.Rúa-Gómez P.C., Püttmann W.; Degradation of lidocaine, tramadol, venlafaxine and the metabolites O-desmethyltramadol and O-desmethylvenlafaxine in surface waters; Chemosphere, (2013); 90: 1952–1959. [DOI] [PubMed] [Google Scholar]