Gadolinium(III)-based contrast probes have been widely used in clinical MRI. So far, there are at least nine formulations of Gd-containing contrast agents approved for human use in the states, and they are assisting more than 10 million magnetic resonance imaging (MRI) scans per year.[1] Free Gd is known to have a high toxicity profile, hence clinically used Gadolinium agents are all in the form of Gd-chelator complexes. Despite the complexation, however, these contrast agents are found to cause severe nephrogenic systemic fibrosis (NSF), especially for patients with renal diseases or poor renal functions.[2] For this reason, the FDA has issued warnings on the use of several Gd-based contrast agents in patients with kidney dysfunction.[3] This status underscores the significance of developing alternative contrast agents with more favorable safety profiles. One approach that has been intensively investigated is to load or imbed Gd(III) into a nanoparticle capsule/carrier that can suppress the Gd release while maintaining the T1-shortening capacity. Examples along this line include Gd2O3 nanoparticles,[4] Gd-loaded silica nanoparticles[5], and Gd-doped Fe3O4 nanoparticles.[6] Due to their relatively large sizes, however, these nanoparticles are heavily accumulated in the reticuloendothelial (RES) organs after systemic injection, most prominently the liver. Subsequent particle degradation may cause release of free Gd(III) cations to the surroundings, and the long-term impact to the host is largely unknown.
Here we report Gd encapsulated carbon dots (hereafter referred to as Gd@C-dots) that may solve the dilemma. Gd@C-dots are prepared by simple calcination of gadopentetic acid (Gd-DTPA) in the air. Stemming from the inert carbon coating, Gd@C-dots remain stable even in harsh biological environments with minimal Gd leakage.[7] Gd@C-dots afford not only a high r1 relaxivity (5.88 mM−1s−1), but also strong and photostable fluorescence, enabling them to act as dually functional imaging probes that can assist both real-time MR imaging and immunofluorescence histology. More excitingly, despite having dimensions (~12 nm) exceeding the commonly recognized threshold for renal clearance,[8] systematically injected Gd@C-dots were found to be efficiently excreted via urine, a feature that further minimizes toxicity risks and may permit the use of the particles for repeated scans. All these qualities suggest the great potential of Gd@C-dots in clinical translation as MRI/fluorescence dually functional imaging probes. In the present study, we coupled c(RGDyK) as a model targeting ligand onto Gd@C-dots and examined, both in vitro and in vivo, the conjugates’ colloidal stability, toxicity, tumor targeting, and imaging quality.
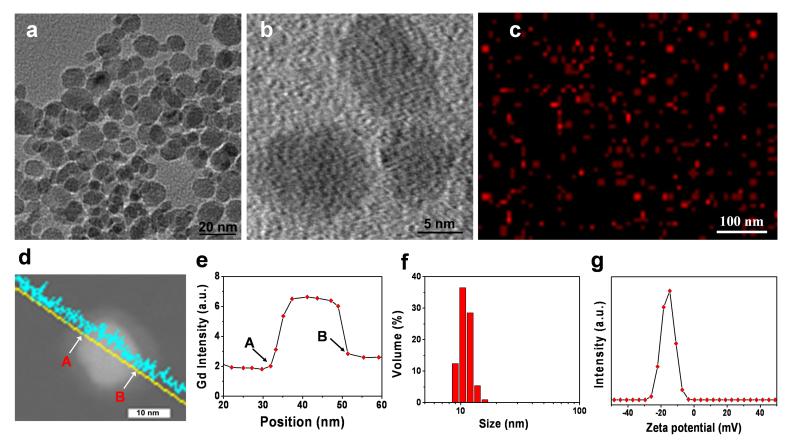
For Gd@C-dot synthesis, Gd-DTPA was first dried on a crucible and then calcined at 300 °C for 2 h in air. The raw products were dispersed in water and purified using centrifugal filter units (MWCO = 100K and 3K, which removed aggregations of nanoparticles and unreacted precursors, respectively). The yielded Gd@C-dots were spherical, with an average size of ~12 nm and relatively narrow size distribution (Figure 1a). High-resolution TEM (Figure 1b) found low diffraction contrast and no obvious lattice fringes with the particles, indicating that the carbon was amorphous. This correlates with previous observations that calcination at low pressure typically yields amorphous structures.[9] Elemental mapping revealed that Gd was distributed evenly within the carbon particles with no signs of crystallization (Figure 1c, S1). This was also confirmed by scanning transmission electron microscopy (STEM) on individual C-dot particles (Figure 1d), revealing that Gd was well encased within the carbon shell (Figure 1e). X-ray photoelectron spectroscopy (XPS) analysis found peaks corresponding to both Gd4d (143 and 148 eV) and Gd3d (1187 eV),[10] suggesting that the oxidation state of Gd remains +3 in Gd@C-dots (Figure S2).
Figure 1.
Characterizations of Gd@C-dots. (a) TEM and (b) HRTEM images of Gd@C-dots. (c) Elemental mapping (Gd) of Gd@C-dots. (d) STEM image of a single Gd@C-dot. (e) EDX line profile across the nanoparticle in d. Points “A” and “B” corresponded to those labeled respectively in d. (f) DLS analysis result of Gd@C-dots. (g) Zeta potential of Gd@C-dots.
The as-synthesized Gd@C-dots were highly dispersible in aqueous solutions, maintaining colloidal stability for months without visible precipitation in PBS and at least 24 hours in 1 M NaCl (Figure S3a and Figure S3b). Dynamic light scattering (DLS) analysis showed a single narrow peak at ~ 12 nm, which is well correlated with the TEM result (Figure 1f, S4). The surface of Gd@C-dots was slightly negatively charged (−16.4 ± 0.6 mV, Figure 1g, S5), attributed to carboxyl groups that were either inherited from the DTPA precursors and/or generated during the calcination. This is supported by FT-IR analysis, finding peaks at 3300 and 1600 cm−1 that are characteristic absorptions of OH and C=O, respectively (Figure S6).[11] Despite the charged surface, however, there was little size increase when the nanoparticles were incubated in the bovine serum (Figure S4b), indicating a minimal level of opsonization.
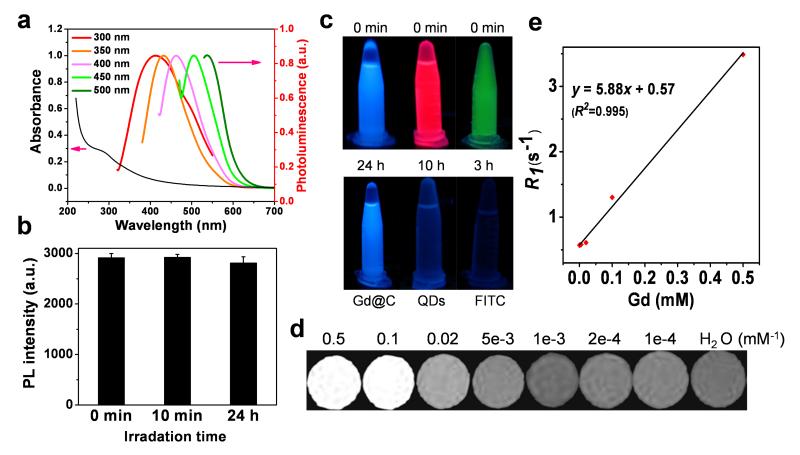
Gd@C-dots showed a broad absorption band between 200 to 500 nm, with a shoulder appearing at ~ 280 nm (Figure 2a). The spectrum resembles those published previously of pure C-dots.[9b, 11b, 12] The Gd@C-dots are also highly fluorescent, and can be excited by light of a wide range of wavelengths to emit strong photoluminescence (Figure 2a). Such wavelength-dependent fluorescence is also similar to conventional C-dots.[9a, 11a] Impressively, there was almost no drop of photoluminescence intensity of Gd@C-dots even after 24 hours of continuous UV illumination (Figure 2b). This photostability is vastly superior to organic dye molecules, and even better than CdSe/ZnS quantum dots,[13] both of which were completely bleached within hours of UV exposure (Figure 2c). The T1 contrast ability was investigated on a 7T magnet with agarose samples of Gd@C-dots. Gd@C-dots showed an r1 of 5.88 mM−1s−1 on a Gd basis (Figure 2d,e), which is significantly higher than Gd-DTPA (3.10 mM−1s−1).[14] The enhanced r1 was mainly attributed to the increase in the rotational correlation time (τR) as a result of binding Gd to a nanoparticle[15].
Figure 2.
Optical and magnetic properties of Gd@C-dots. (a) Absorption and photoluminescence spectra of Gd@C-dots. (b) Photostability study. Gd@C-dots were under continuous irradiation by UV light (30 W, 254 nm) and the photoluminescence (ex/em 360/425 nm) intensity was monitored over time. (c) Comparison of photostability among FITC, CdSe/ZnS QDs, and Gd@C-dots. The three solutions were under continuous irradiation by UV light (30 W, 254 nm) for different amounts of time. (d) T1-weight MR images of Gd@C-dot agarose samples of different Gd concentrations. (e) Linear correlation between R1 (T1−1) and Gd concentration, based on readings from d. The r1 relaxivity, which is the slope of the curve, was determined to be 5.88 mM−1s−1.
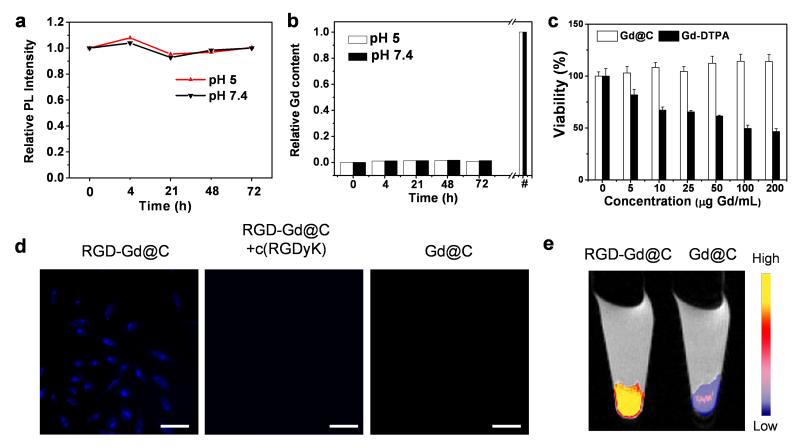
The inert carbon coating was anticipated to effectively block the leakage of Gd into the surroundings. To investigate, we incubated Gd@C-dots in phosphate buffered saline of pH 5 or 7.4 at 37 °C for 72 h. At both pH values, we observed no drop of luminescence intensity and negligible Gd leakage from the nanoparticles over time (Figure 3a, b). We also studied the cytotoxicity of Gd@C-dots, and for better assessment, we added 2.5 mM Ca(II) into the cell incubation medium. This was to test the particles’ stability against transmetallation, which is the major cause of toxicity for conventional Gd contrast agents.[16] Despite the presence of calcium, there was no significant drop of cell viability even at high nanoparticle concentrations (0–100 μg Gd/mL, Figure 3c). This is in stark contrast to Gd-DTPA, whose toxicity is dramatically increased when incubated with calcium, showing an IC50 of 33.1 μg/mL (Figure 3c).[17]
Figure 3.
Cytotoxicity and cell targeting. (a) Photoluminescence intensity (ex/em 360/425 nm) change when Gd@C-dots were incubated in buffers of different pH values. (b) Gd release from Gd@C-dots over time. The nanoparticles were incubated in solutions with pH 5 or 7.4. #: The overall Gd concentrations in the solutions. (c) Cell viability, evaluated by MTT assays with U87MG cells. 2.5 mM Ca(II) was added in the incubation medium. (d) Cell targeting study. RGD-Gd@C-dots were incubated with U87MG cells for 30 min and the cells were then imaged under a fluorescence microscope (scale bar, 10 μm). For controls, cells were incubated with Gd@C-dots at the same Gd concentration or with RGD-Gd@C-dots in the presence of free c(RGDyK) (30×). (e) T1-weighted MR images of cell pellets, where cells had been incubated with either RGD-Gd@C-dots or Gd@C-dots.
The carboxyl groups on the particle surface offer a facile means to tether functional bio-species. In the present study, we coupled c(RGDyK), a tumor targeting peptide, onto the Gd@C-dots. A cyclic RGD derivative, c(RGDyK) holds strong binding affinity toward integrin αvβ3, a biomarker that is seen overexpressed on neoplastic blood vessels and many types of cancer cells.[18] After the coupling, the nanoparticles’ zeta potential increased slightly to −12.0 ± 0.4 mV, and the size to ~16.0 nm (Figure S4c). The targeting specificity of the resulting c(RGDyK) conjugated Gd@C-dots (hereafter referred to as RGD-Gd@C-dots) was investigated with U87MG cells, which are integrin αvβ3 positive. After 30 min incubation, there was a high level of nanoparticle uptake (ex/em: 360/460 nm), with many signals concentrated in the cell endosomes/lysomes (Figure 3d). The cell uptake was dramatically suppressed when Gd@C-dots were co-incubated with free c(RGDyK) (30×), indicating that the uptake was mostly mediated by RGD-integrin interaction. Such difference in cell uptake can also be discerned by MRI. Figure 3e shows a T1-weighted MR image of 105 U87 cells that had been incubated with either RGD-Gd@C-dots or Gd@C-dots. Compared to the control, significantly enhanced signals were observed in the cells incubated with RGD@C-dots (Figure 3e).
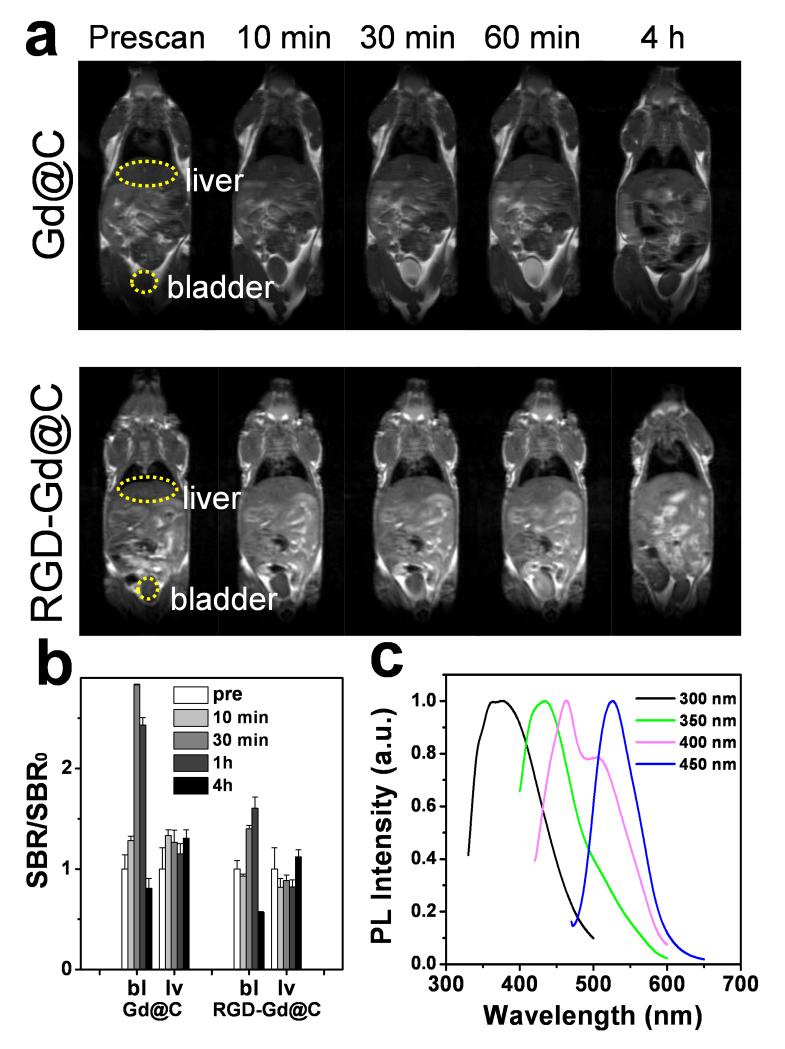
In vivo MRI was first investigated with Gd@C-dots in normal nude mice. The particles were intravenously (i.v.) injected (0.8 mg Gd/kg) into the animals, and T1-weighted images were acquired before and 10, 30, 60 min and 4 h post the particle injection (p.i.). There was an initial signal increase throughout the body, followed by a signal decay starting from 60 min. After 4 h, signals in most of the organs had subsided to the pre-injection levels, indicating excretion of the particles from the circulation (Figure 4a). Interestingly, the signal change in the liver was found to be small throughout the course of the experiment (Figure 4a,b). Instead, there was a dramatic increase of signals in the bladder, a sign of renal clearance of the injected nanoparticles. Similar pharmacokinetics was also observed with RGD-Gd@C-dots at the same dose (Figure 4a,b).
Figure 4.
(a) T1-weighted MR images, acquired at different time points after injection of Gd@C-dots or RGD-Gd@C-dots. (b) Signal change in the bladder (bl) and liver (lv), based on region of interest (ROI) analysis on images from a). (c) Photoluminescence analysis on urine samples, taken 60 min after the injection of RGD-Gd@C-dots.
To further investigate, we collected urine samples from the animals ~60 min after the injection, and by centrifuging, harvested nanoparticles (Figure S7a). Analysis on the fragment found a large amount of Gd (by inductively coupled plasma mass spectroscopy, or ICP-MS), along with strong photoluminescence that is characteristic of C-dots (Figure 4c, Figure S7b). On the other hand, no Gd was detected in the supernatant. This result confirmed that the Gd was still well encapsulated within the carbon shell at the time of excretion.
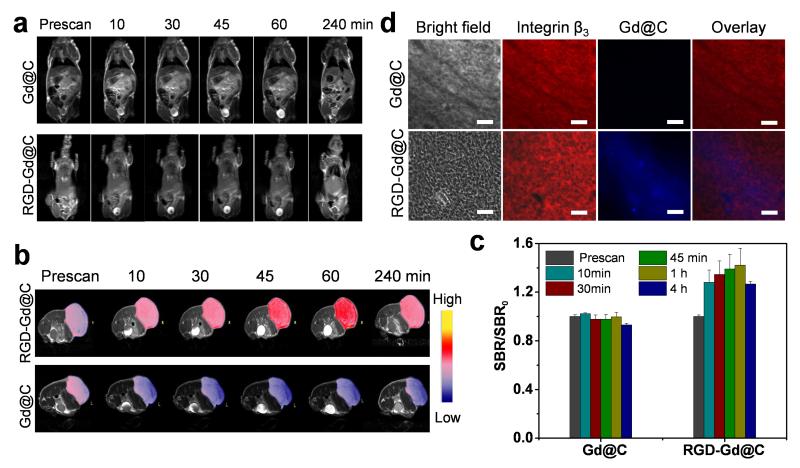
We next evaluated RGD-Gd@C-dots as tumor imaging probes in U87MG tumor-bearing mice. Briefly, RGD-Gd@C-dots at 3.2 mg Gd/kg were intravenously injected into the animals (n = 3). Images were acquired before and 10, 30, and 60 min after the nanoparticle injection. In a control group, Gd@C-dots at the same Gd dose were injected. Similarly, there was efficient renal clearance of RGD-Gd@C-dots, evidenced by strongly enhanced intensities in the bladder (Figure 5a). After 4 h, signals in the normal tissues had receded to the normal level for both RGD-Gd@C-dots and Gd@C-dots injected animals. Meanwhile, there was a signal enhancement of 42.6 ± 0.08% in tumors of in animals injected with RGD-Gd@C-dots compared to those injected with Gd@C-dots (Figure 5b,c). Harnessing the strong fluorescence of Gd@C-dots, we conducted immunofluorescent studies with the tumor tissues. Indeed, there was a good correlation between RGD-Gd@C-dots and positive integrin β3 staining (Figure 5d), confirming that the tumor retention was mainly mediated by RGD-integrin interaction.
Figure 5.
(a) T1-weighted transverse MR images. Gd@C-dots or RGD@C-dots (3.2 mg/kg) were intravenously injected into U87MG tumor bearing mice. Images were acquired at 0, 10, 30, 45, 60 and 240 min. For both types of nanoparticles, strong signals in the bladder were observed soon after the particle injection, indicating fast renal clearance. (b) T1-weighted coronal MR images. Significant signal enhancement was observed in tumors of animals injected with RGD@Gd-dots. (c) Relative signal change at different time points, based imaging results from b). (d) Immunofluorescence histology study with tumor samples. Good overlap was observed between RGD-Gd@C-dots and positive integrin β3 staining. As a comparison, Gd@C-dots showed minimal tumor uptake. Red, integrin β3 (Cy5); blue, fluorescence from C-dots. Scale bars, 50 μm.
An ideal imaging probe can home efficiently to the diseased area (e.g. a tumor) after systemic injection, with the unbound rapidly excreted from the host. This, however, has proven to be challenging for nanoparticles, most of which have a relatively large size, a high tendency of opsonization, and as a result, a high level of liver accumulation.[19] Previous studies by the Frangioni group showed that when the overall size was controlled below 5.5 nm, nanoparticles could be excreted by renal clearance, thereby avoiding extended durations in the host.[20] This size criterion, however, is difficult to meet for nanomaterials, including most Gd-containing nanoparticles under investigation. It is in this sense that the current observation is intriguing. Despite a size well above the recognized threshold for renal clearance, both RGD-Gd@C-dots and Gd@C-dots are able to be efficiently excreted via urine. Though the exact mechanism is unknown, it is believed that the unique surface of Gd@C-dots may have played a role. With a shell made of amorphous carbon but decorated with carboxyl groups, the surface of Gd@C-dots lies between hydrophobic and hydrophilic. This affords the particles with good colloidal stability and meanwhile, may give them the capacity to cross certain types of biological barriers.
When Gd@C-dots were conjugated with ethylenediamine, the resulting conjugates, after i.v. injection into normal mice, showed no renal clearance (Figure S7b). Notably, the conjugation did not significantly increase the nanoparticle size but rendered the surface charge almost neutral. This observation, while confirming the significance of surface properties on renal clearance, indicate that the parameters required for clearance can be very delicate. Recently, there was a study by Gao et al. showing that 11.8 nm QDs had efficient renal clearance,[21] which the authors also attributed to the unique surface coating (a dendron polymer). Also, Liu et al. discussed nanoparticle renal clearance in a recent review article and concludes that, in addition to particle size and shape, the surface may sometimes facilitate renal clearance, though the mechanism is unknown.[22] It is certainly important in future investigations to systematically study the topic and employ the knowledge for better design of nanoparticle-based imaging and drug delivery reagents.[22]
Gd@C-dots show a quantum yield (QY) of 19.7% (Supporting Information), which is comparable to some of the highest reported QYs of C-dots.[11b] Notably, such strong luminescence was obtained through an one-step synthesis, in contrast to conventional approaches that often require a post-synthesis surface passivation step to illuminate C-dots.[12a, 23] According to Sun et al., surface passivation is critical to the luminescence of C-dots and can be imparted not only through deliberate conjugation, but also by physical adsorption during synthesis.[7] Indeed, thermogravimetric analysis (TGA) on Gd@C-dots suggests that there is a trace amount of DTPA left on the surface of Gd@C-dots (Figure S8), even after multiple rounds of washing. It is believed that the surface-bound DTPA contributes, at least in part, to the surface passivation and thereby the high luminescence of Gd@C-dots.
Interestingly, when calcining DTPA, 11 nm C-dots can be obtained but their QY was “only” ~12.0%. This difference in QY suggests that the encased Gd(III) could have played a role in the luminescence of the nanosystem. Meanwhile, since DTPA can form complexes with a wide range of transition metals, the current synthetic method can be easily extended to prepare other metal-containing C-dots, including those encapsulated with Mn2+, Nd3+, Y3+, and Eu3+. The yielded nanoparticles are all highly fluorescent in the visible range, but the positions of their peak luminescence are varied to a certain degree (Figure S9). This again indicates a dopant impact on the luminescence. It is postulated that the metallic center affects the electron distribution on the carbon shell and in turn enhances or shifts the luminescence. It is possible that leveraging the dopant effect could achieve C-dot derivatives possessing more favorable optical and/or magnetic properties, and the related investigation is underway.
Overall, we have developed a novel and straightforward methodology to prepare Gd@C-dots. Stemming from the inert carbon coating, Gd@C-dots are immune to the issue of Gd leakage that is often observed with complex-based Gd agents. Gd@C-dots afford good r1 relatixivity and strong photoluminescence, making them appealing MRI/fluorescence dually functional imaging probes. This potential is strengthened by the fact that Gd@C-dots and their conjugates can be efficiently excreted through renal clearance after systematic injection. Our observations suggest great potential of Gd@C-dots in clinical translation as safe and efficient imaging probes.
Supplementary Material
Acknowledgements
The study was supported by an NCI/NIH R00 grant (5R00CA153772), a UGA startup grant, an Elsa U. Pardee foundation grant. It was also supported by the National Natural Science Foundation of China (81130028, 31210103913), the key Grant Project of Heilongjiang Province (GA12C302), and the Key Laboratory of Molecular Imaging Foundation.
Footnotes
Supporting Information is available from the Wiley Online Library or from the author.
Contributor Information
Dr. Hongmin Chen, Department of Chemistry, The University of Georgia, Athens, Georgia 30602, USA; Department of Radiology and Molecular Imaging Center, The Fourth Hospital of Harbin Medical University, Harbin, Heilongjiang 150001, P. R. China
Geoffrey D. Wang, Department of Chemistry, The University of Georgia, Athens, Georgia 30602, USA
Wei Tang, Department of Chemistry, The University of Georgia, Athens, Georgia 30602, USA.
Trever Todd, Department of Chemistry, The University of Georgia, Athens, Georgia 30602, USA.
Dr. Zipeng Zhen, Department of Chemistry, The University of Georgia, Athens, Georgia 30602, USA
Chu Tsang, Department of Chemistry, The University of Georgia, Athens, Georgia 30602, USA.
Dr. Khan Hekmatyar, Bio-Imaging Research Center, The University of Georgia, Athens, Georgia 30602, USA
Taku Cowger, Department of Chemistry, The University of Georgia, Athens, Georgia 30602, USA.
Dr. Richard Hubbard, Department of Chemistry, The University of Georgia, Athens, Georgia 30602, USA
Weizhong Zhang, Department of Chemistry, The University of Georgia, Athens, Georgia 30602, USA.
Dr. John Stickney, Department of Chemistry, The University of Georgia, Athens, Georgia 30602, USA
Dr. Baozhong Shen, Department of Radiology and Molecular Imaging Center, The Fourth Hospital of Harbin Medical University, Harbin, Heilongjiang 150001, P. R. China.
Dr. Jin Xie, Department of Chemistry, The University of Georgia, Athens, Georgia 30602, USA; Bio-Imaging Research Center, The University of Georgia, Athens, Georgia 30602, USA.
References
- [1].Webb A, Smith NB. Introduction to Medical Imaging: Physics, Engineering and Clinical Applications: 5 Magnetic resonance imaging MRI. Cambridge University Press; 2010. p. 204. [Google Scholar]
- [2].a) Perazella MA. Curr. Drug Safety. 2008;3:67–75. doi: 10.2174/157488608783333989. [DOI] [PubMed] [Google Scholar]; b) Chrysochou C, Power A, Shurrab AE, Husain S, Moser S, Lay J, Salama AD, Kalra PA. Clin J. Am. Soc. Nephrology. 2010;5:484–489. doi: 10.2215/CJN.06580909. [DOI] [PMC free article] [PubMed] [Google Scholar]; c) Perazella MA. Clin J. Am. Soc. Nephrology. 2007;2:200–202. doi: 10.2215/CJN.00030107. [DOI] [PubMed] [Google Scholar]
- [3].a) Thomsen HS, Morcos SK, Dawson P. Clin. Radiology. 2006;61:905–906. doi: 10.1016/j.crad.2006.09.003. [DOI] [PubMed] [Google Scholar]; b Thomsen HS. Eur. Radiology. 2006;16:2619–2621. doi: 10.1007/s00330-006-0495-8. [DOI] [PMC free article] [PubMed] [Google Scholar]; c) Hellman RN. Sem. Nephrology. 2011;31:310–316. doi: 10.1016/j.semnephrol.2011.05.010. [DOI] [PubMed] [Google Scholar]
- [4].Bridot JL, Faure AC, Laurent S, Riviere C, Billotey C, Hiba B, Janier M, Josserand V, Coll JL, Elst LV, Muller R, Roux S, Perriat P, Tillement O. J. Am. Chem. Soc. 2007;129:5076–5084. doi: 10.1021/ja068356j. [DOI] [PubMed] [Google Scholar]
- [5].Vivero-Escoto JL, Rieter WJ, Lau H, Huxford-Phillips RC, Lin WB. Small. 2013;9:3523–3531. doi: 10.1002/smll.201300198. [DOI] [PMC free article] [PubMed] [Google Scholar]
- [6].Zhou Z, Huang D, Bao J, Chen Q, Liu G, Chen Z, Chen X, Gao J. Adv. Mater. 2012;24:6223–6228. doi: 10.1002/adma.201203169. [DOI] [PMC free article] [PubMed] [Google Scholar]
- [7].Cao L, Yang ST, Wang X, Luo PG, Liu JH, Sahu S, Liu Y, Sun YP. Theranostics. 2012;2:295–301. doi: 10.7150/thno.3912. [DOI] [PMC free article] [PubMed] [Google Scholar]
- [8].Choi HS, Liu WH, Liu FB, Nasr K, Misra P, Bawendi MG, Frangioni JV. Nat. Nanotech. 2010;5:42–47. doi: 10.1038/nnano.2009.314. [DOI] [PMC free article] [PubMed] [Google Scholar]
- [9].a) Bourlinos AB, Stassinopoulos A, Anglos D, Zboril R, Karakassides M, Giannelis EP. Small. 2008;4:455–458. doi: 10.1002/smll.200700578. [DOI] [PubMed] [Google Scholar]; b) Chen H, Zhen Z, Tang W, Todd T, Chuang YJ, Wang L, Pan Z, Xie J. Theranostics. 2013;3:650–657. doi: 10.7150/thno.6668. [DOI] [PMC free article] [PubMed] [Google Scholar]
- [10].a) Ren X, Liu L, Li Y, Dai Q, Zhang M, Jing X. J. Mater. Chem. B. 2014 doi: 10.1039/c4tb00709c. In Press (Doi: 10.1039/C4TB00709C) [DOI] [PubMed] [Google Scholar]; b) Bourlinos AB, Bakandritsos A, Kouloumpis A, Gournis D, Krysmann M, Giannelis EP, Polakova K, Safarova K, Hola K, Zboril R. J. Mater. Chem. 2012;22:23327–23330. [Google Scholar]
- [11].a) Li W, Zhang Z, Kong B, Feng S, Wang J, Wang L, Yang J, Zhang F, Wu P, Zhao D. Angew. Chem. Int. Ed. 2013;52:8151–8155. doi: 10.1002/anie.201303927. [DOI] [PubMed] [Google Scholar]; b) Bhunia SK, Saha A, Maity AR, Ray SC, Jana NR. Sci. Rep. 2013;3:1473. doi: 10.1038/srep01473. [DOI] [PMC free article] [PubMed] [Google Scholar]
- [12].a) Sun YP, Zhou B, Lin Y, Wang W, Fernando KA, Pathak P, Meziani MJ, Harruff BA, Wang X, Wang H, Luo PG, Yang H, Kose ME, Chen B, Veca LM, Xie SY. J. Am. Chem. Soc. 2006;128:7756–7757. doi: 10.1021/ja062677d. [DOI] [PubMed] [Google Scholar]; b) Ding C, Zhu A, Tian Y. Acc. Chem. Res. 2014;47:20–30. doi: 10.1021/ar400023s. [DOI] [PubMed] [Google Scholar]
- [13].a) Michalet X, Pinaud FF, Bentolila LA, Tsay JM, Doose S, Li JJ, Sundaresan G, Wu AM, Gambhir SS, Weiss S. Science. 2005;307:538–544. doi: 10.1126/science.1104274. [DOI] [PMC free article] [PubMed] [Google Scholar]; b) Song S, Qin Y, He Y, Huang Q, Fan C, Chen HY. Chem. Soc. Rev. 2010;39:4234–4243. doi: 10.1039/c000682n. [DOI] [PubMed] [Google Scholar]
- [14].a) Kim T, Momin E, Choi J, Yuan K, Zaidi H, Kim J, Park M, Lee N, McMahon MT, Quinones-Hinojosa A, Bulte JW, Hyeon T, Gilad AA. J. Am. Chem. Soc. 2011;133:2955–2961. doi: 10.1021/ja1084095. [DOI] [PMC free article] [PubMed] [Google Scholar]; b) Kalavagunta C, Michaeli S, Metzger GJ. Cont. Media Mol. Imaging. 2014;9:169–176. doi: 10.1002/cmmi.1568. [DOI] [PMC free article] [PubMed] [Google Scholar]
- [15].Huang CH, Tsourkas A. Curr. Top. Med. Chem. 2013;13:411–421. doi: 10.2174/1568026611313040002. [DOI] [PMC free article] [PubMed] [Google Scholar]
- [16].Corot C, Idee JM, Hentsch AM, Santus R, Mallet C, Goulas V, Bonnemain B, Meyer D. J. Magn. Reson. Imaging. 1998;8:695–702. doi: 10.1002/jmri.1880080328. [DOI] [PubMed] [Google Scholar]
- [17].a) Wu X, Zong Y, Ye Z, Lu ZR. Pharma. Res. 2010;27:1390–1397. doi: 10.1007/s11095-010-0131-9. [DOI] [PMC free article] [PubMed] [Google Scholar]; b) Aime S, Caravan P. J. Magn. Reson. Imaging. 2009;30:1259–1267. doi: 10.1002/jmri.21969. [DOI] [PMC free article] [PubMed] [Google Scholar]
- [18].Ye Y, Chen X. Theranostics. 2011;1:102–126. doi: 10.7150/thno/v01p0102. [DOI] [PMC free article] [PubMed] [Google Scholar]
- [19].a) Jokerst JV, Lobovkina T, Zare RN, Gambhir SS. Nanomedicine. 2011;6:715–728. doi: 10.2217/nnm.11.19. [DOI] [PMC free article] [PubMed] [Google Scholar]; b) Liu D, Mori A, Huang L. Biochim. Biophysi. Acta. 1992;1104:95–101. doi: 10.1016/0005-2736(92)90136-a. [DOI] [PubMed] [Google Scholar]
- [20].Choi HS, Liu W, Liu F, Nasr K, Misra P, Bawendi MG, Frangioni JV. Nat. Nanotech. 2010;5:42–47. doi: 10.1038/nnano.2009.314. [DOI] [PMC free article] [PubMed] [Google Scholar]
- [21].Gao J, Chen K, Luong R, Bouley DM, Mao H, Qiao T, Gambhir SS, Cheng Z. Nano Lett. 2012;12:281–286. doi: 10.1021/nl203526f. [DOI] [PMC free article] [PubMed] [Google Scholar]
- [22].Liu JB, Yu MX, Zhou C, Zheng J. Mater. Today. 2013;16:477–486. [Google Scholar]
- [23].a) Wang J, Wang CF, Chen S. Angew. Chem. Int. Ed. 2012;51:9297–9301. doi: 10.1002/anie.201204381. [DOI] [PubMed] [Google Scholar]; b) Liu S, Tian JQ, Wang L, Zhang YW, Qin XY, Luo YL, Asiri AM, Al-Youbi AO, Sun XP. Adv. Mater. 2012;24:2037–2041. doi: 10.1002/adma.201200164. [DOI] [PubMed] [Google Scholar]
Associated Data
This section collects any data citations, data availability statements, or supplementary materials included in this article.


