Abstract
Background
The rise in incidence of esophageal cancer (EC) in the United States (U.S.) over the last four decades has been well documented; however, data on trends in long-term survival and impact on modern therapies associated with survival is lacking.
Methods
The Surveillance, Epidemiology, and End Results (SEER) database was queried to identify patients with confirmed EC. Cox proportional hazard regression was used to determine independent mortality factors.
Results
Of 93,167 patients diagnosed with EC between 1973 and 2009, 49% had a histologic diagnosis of esophageal adenocarcinoma (EAC). There was an increase (almost double) in the proportion of patients with adenocarcinoma from the 1970's to 2000's (n = 2,350; 35% to n = 32,212; 61%, p<0.001). Surgery was performed for localized disease in a majority of EC regardless of type (n = 46,683; 89%). Use of surgical treatment increased significantly over the study period (49% to 64%, p<0.001). There was also an increase in overall median survival (6 months versus 10 months, p<0.001) and 5-year survival rate (9% to 22%, p<0.001). Median survival increased consistently for EAC and squamous cell carcinoma (SCC) until the 1990's. After this period, median survival of EAC continued to increase more rapidly while SCC remained relatively stable.
Conclusion
A significant survival improvement in esophageal cancer was seen from 1973 to 2009, largely due to earlier detection at a curative stage and greater utilization of treatment modalities (especially surgery). Despite the rising prevalence, patients with EAC have better long-term survival outcomes than those SCC.
Keywords: Esophagus, Adenocarcinoma, Squamous, Carcinoma
INTRODUCTION
Esophageal cancer (EC) is one of the most rapidly growing causes of cancer mortality and cancer-related deaths worldwide.1-3 On a global scale, an estimated 482,300 new esophageal cancer cases and 406,800 deaths occurred in 2008.4 Incidence rates vary internationally by nearly 16-fold due to a variety of risk factors; however the United States (U.S.) and other Western countries are considered low-risk areas.5 Despite this designation as “low-risk,” it was estimated in 2012 that in the U.S., approximately 17,460 people were diagnosed with esophageal cancer, and 15,070 people died from the disease.1
Data from the Surveillance, Epidemiology, and End Results (SEER) registry have shown a rising incidence of esophageal adenocarcinoma (EAC) in the U.S. over the past four decades.7-11 However, the incidence of esophageal squamous cell carcinoma (SCC) fell by 4 % per year, presumably secondary to a decrease in male cigarette smoking over the past 20 years.12,13 Recent research suggests improved survivals of all types of EC over the last three decades.9,13-15 If these survival benefits are large enough, there should be detectable difference in a temporal trend analysis of long-term survival.
The primary aim of this study was to analyze long-term survival trends of EC in U.S. adults and identify independent predictors of mortality. As a secondary goal, we also sought to comparatively examine the survival patterns of EAC and SCC.
METHODS
Data Source
A retrospective cohort study was performed using data from the SEER database (available at: www.seer.cancer.gov), based on the November 2011 submission. The SEER database is derived from 18 cancer registries representing approximately 28% of the U.S. population and is maintained by the National Cancer Institute. From 1973 to 2009, the number of SEER registries started from 9 registries to the current 18 registries. The SEER dataset includes information on patient demographics, tumor and disease characteristics, cancer-associated treatments, use of cancer-directed surgery, and survival for individuals with cancer. Surgical interventions are coded in the SEER database as a separate variable and indicate if an operation was performed and if it was recommended or not. A surgical procedure directed at the primary site is coded as a separate variable. No record of chemotherapy appears in this database.
Study Population
The SEER database was queried for all cases of EC using tumor site codes (C15.0–C15.9) and ICD-9 codes diagnosed between 1973 and 2009.16-18 Only histologic codes for adenocarcinoma (8140–8573) and squamous cell cancers (8050–8082) were included in the search. Patients with another malignant primary tumor diagnosed within a 5-year period prior to EC diagnosis were excluded to minimize the chance that metastatic disease to the esophagus was misdiagnosed as EC. To ensure a uniform cancer staging classification across all study years we used the SEER historic stage, which provides consistent definitions over time, as opposed to American Joint Committee on Cancer staging, which is more commonly used in the clinical settings but is not easily available for many of the years analyzed. The SEER historic stages were: localized (confined to primary site), regional (spread to regional lymph nodes), and distant (cancer had metastasized). Patients diagnosed within 1-month prior to death (including patients diagnosed at autopsy or by death certificate) were excluded.
Statistical Analyses
We obtained SEER frequency and survival data using SEER*Stat software, version 8.12. The study population was divided according to decade of diagnosis: 1973-1980, 1981-1990, 1991-2000 and 2001-2009. Mean and median values were used to describe continuous data, with discrete variables displayed as totals and frequencies. Median survival and survival rates were calculated overall and for each decade. Trends in ordinal data were evaluated using the linear-by-linear association test.19 The linear-by-linear test of trend offers a measure of significance for ordinal variables (decade quartiles ordered from lowest to highest). Unless otherwise specified, the p-values reported for trend analysis refer to comparison among all of the four decade quartiles.
Subgroup analyses by histology (EAC versus SSC), treatment modality, and stage at diagnosis were performed. Cumulative survival rates were calculated using the method of Kaplan and Meier, and survival curves were compared using the log-rank test.20 Univariate and multivariate Cox proportional hazard regression was used to determine independent predictors of mortality. Covariates with a p-value < 0.1 on univariate analysis were entered into multivariate analysis. Covariates analyzed included: age, gender, ethnicity (White, Black, American Indian/Alaskan Native and Asian or Pacific Islander), tumor histology, tumor grade, stage of disease, and treatment (surgery, surgery plus adjuvant radiotherapy, or neither). All reported p-values were 2-tailed, and for all tests p < 0.05 was considered statistically significant. All analyses were performed using SEER*stat and IBM SPSS version 20.0.
RESULTS
Patient and tumor characteristics
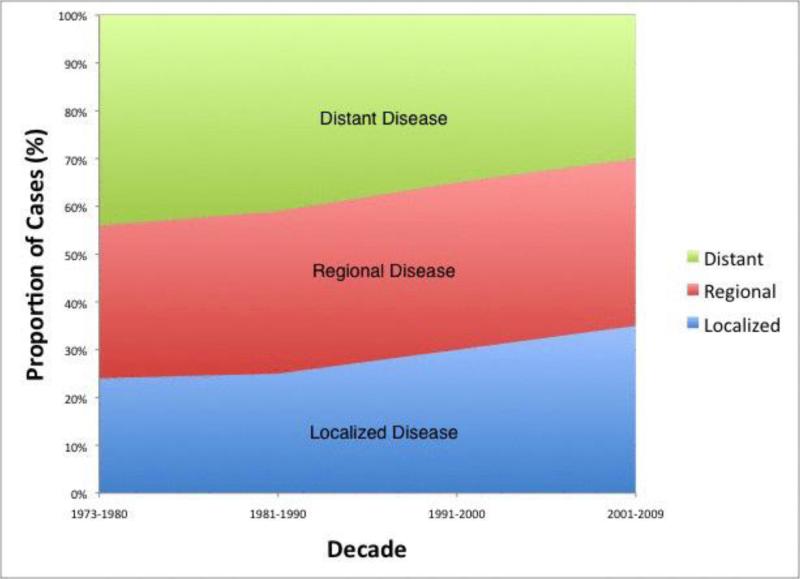
Using the SEER database, 93,167 patients diagnosed with EC between 1973 and 2009 met our inclusion criteria. Demographic and pathologic characteristics of the overall study population are shown in Table 1. The median age of the total cohort was 66 years. Most patients were white males [men (n = 70,807; 76%) and white (n = 74,534; 80%)]. There was a marked increase over time in the number of patients with EC in the database (6,714 for the 1970's versus 52,806 for the 2000's; p < 0.001) though increases were also due to the expansion of the SEER registries. Overall, most patients had distant disease (n = 34,472; 37%) as classified by the SEER historic stage. Diagnosis at a localized stage increased significantly over the study period [n = 1,611; 24% to n = 18,482; 35%, p<0.001 (Figure 1)]. There was a progressive increase (almost double) in the proportion of patients with adenocarcinoma from the 1970's to 2000's (n = 2,350; 35% to n = 32,212; 61%, p<0.001). The proportion of distal cancer remained unchanged around 40% throughout the study period. Overall, 55.6% (n = 51,801) of patients had pathologically proven lymph node invasion. The mean tumor size was 2.8 cm (S.E.M. = 1.2 cm) and solitary tumors (86.6%) were more common than multiple tumors.
Table 1.
Trends in Baseline Demographic and Pathologic Characteristics of the Study Population
| Variable | Total | 1973-1980 | 1981-1990 | 1991-2000 | 2001-2009 |
|---|---|---|---|---|---|
| Number of Patients (n)* | 93,167 | 6,714 | 12,902 | 20,745 | 52,806 |
| Median age (yrs) | 66 | 63 | 65 | 67 | 68 |
| Men (%) | 76 | 75 | 77 | 78 | 75 |
| White (%)* | 80 | 74 | 78 | 81 | 86 |
| Adenocarcinoma (%)* | 49 | 35 | 45 | 53 | 61 |
| Cancer of the distal esophagus (%) | 40 | 40 | 43 | 41 | 37 |
| SEER historic stage, (%)* | |||||
| Localized | 29 | 24 | 25 | 30 | 35 |
| Regional | 34 | 32 | 34 | 35 | 35 |
| Distant | 37 | 44 | 41 | 35 | 30 |
| 5-year Survival (%)* | 15.5 | 9 | 13 | 18 | 22 |
Significant at p < 0.05. The p values reported for trend analysis refers to comparison among all of the 4 decade quartiles.
Figure 1.
Trend graph depicts stage distribution of diagnosed cases with earlier diagnosis at a localized stage increasing over the study period
Trends in Cancer-directed Treatment
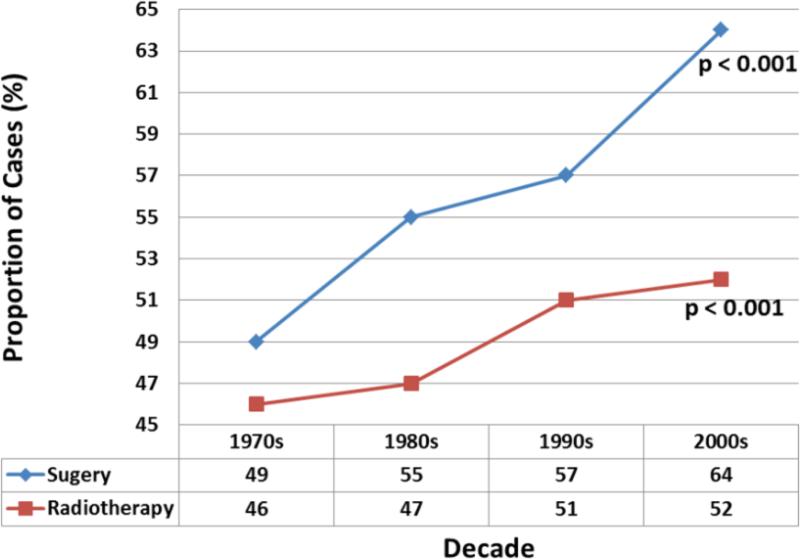
Of the 93,167 patients included, 52,453 (56.3%) underwent cancer-directed surgery and 45,652 (49%) received radiation therapy. In the overwhelming majority of cases (n = 46,683; 89%) surgery was done with early (loco-regional) stage of disease. Use of surgical treatment overall increased significantly over the study period [49% to 64%, p<0.001 (Figure 2)]. The proportion of patients who received adjuvant radiation therapy also increased over time (46% to 52%, p<0.001).
Figure 2.
Trend graph of cancer-directed therapy showing increasing utilization of surgery and radiotherapy over four decades. The p-values reported for trend analysis refers to comparison among all of the four decade quartiles.
Survival Trends
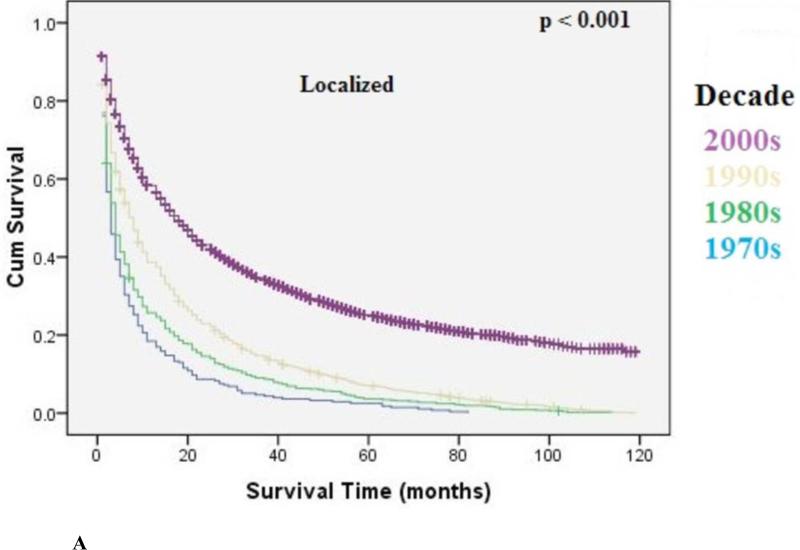
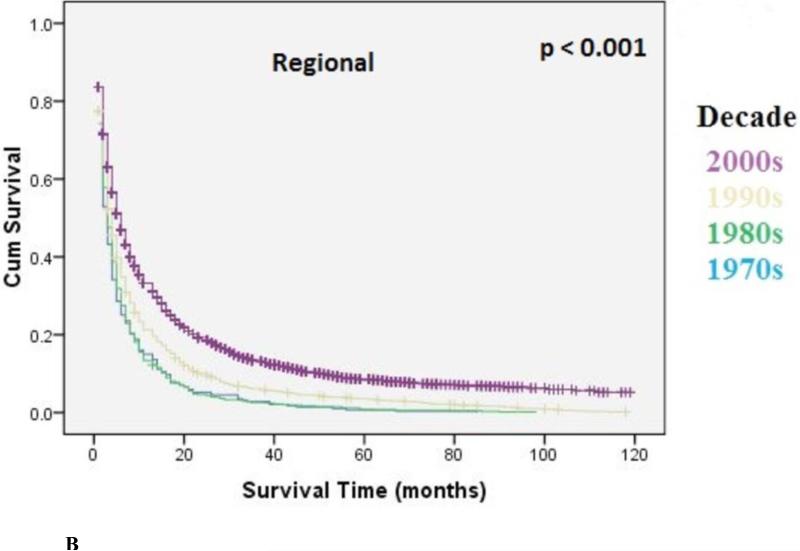
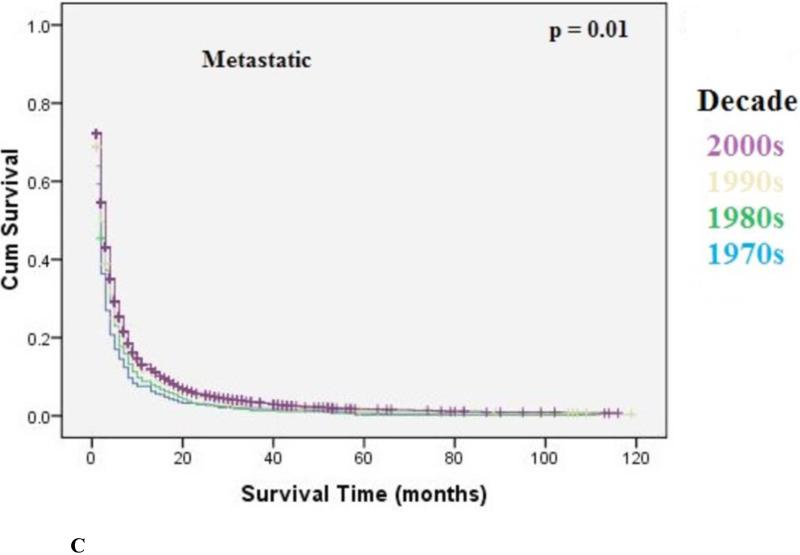
The overall median survival was 9 months (95% CI: 8.9-9.1) with an overall 5-year survival rate of 15.5%. There was a statistically significant increase in overall median survival (6 months versus 10 months, p<0.001) and 5-year survival rate (9% to 22%, p<0.001) from the 1970's to 2000's. Survival improvement was predominantly seen in patients with localized disease (10 months to 30 months, p<0.001), and to a lesser degree in patients with regional disease [6 months to 13 months, p<0.001) Metastatic disease had a small but statistically significant increase in median survival (4 months to 6 months, p=0.01). Kaplan-Meir curves for localized, regional, and metastatic disease are shown in Figure 3A, 3B, 3C, respectively.
Figure 3A.
Kaplan-Meier Analysis: Localized EC. Graph shows increasing survival from 1970's to 2000's with largest improvement in survival seen from the 1990's to 2000's. The p-values reported for trend analysis refers to comparison among all of the four decade quartiles.
Figure 3B.
Kaplan-Meier Analysis: Regional EC. Graph shows increasing survival from 1970's to 2000's with largest improvement in survival seen from the 1990's to 2000's. The p-values reported for trend analysis refers to comparison among all of the four decade quartiles.
Figure 3C.
Kaplan-Meier Analysis: Metastatic EC. Graph shows small but statistically significant increase in survival (4 to 6 months, p=0.01) from 1970's to 2000's. The p-values reported for trend analysis refers to comparison among all of the four decade quartiles.
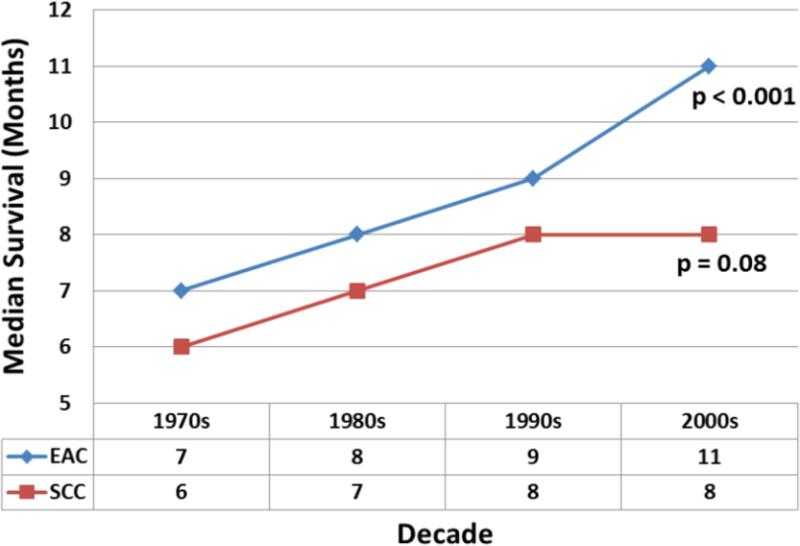
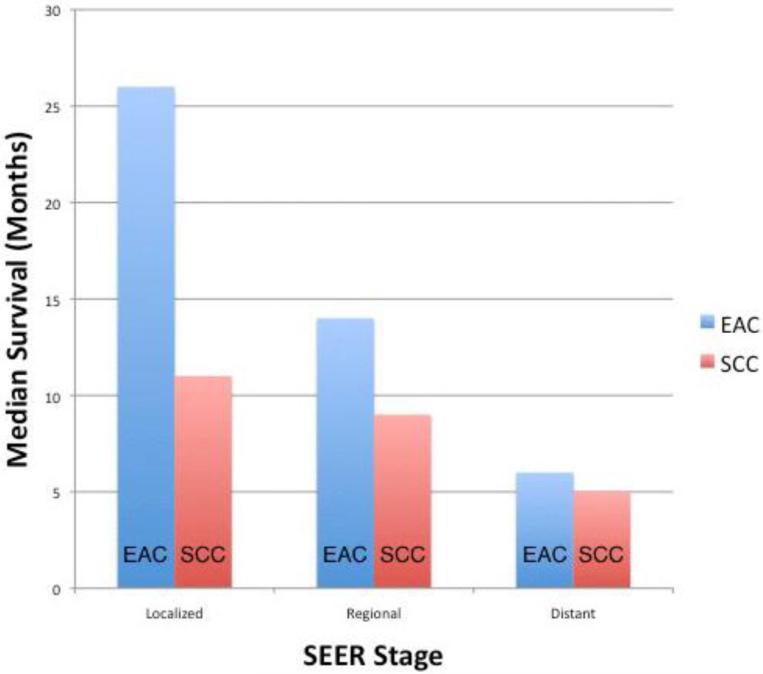
Subgroup analyses by histology type (EAC versus SCC) revealed statistically significant improvement in survival for EC over the last four decades; however, this was limited to EAC only (Figure 4). The main increase in median survival was from the 1990's (7 months; 95% CI: 6.5-7.5) to the 2000's (11 months; 95% CI: 10.3-11.2; p<0.001) for the EAC subgroup. For SCC there was also an increase in median survival from 6 months (95% CI: 5.7-6.3) to 8 months (95% CI: 7.8-8.2), however this was not statistically significant (p=0.08). The median survival increased consistently for both EAC and SCC until the 1990's, but after this period, the median survival of EAC continued to increase while that of SCC remained relatively stable. Upon more detailed analysis, the largest change in median survival for EAC compared to SCC was seen in localized disease [26 months; 95% CI: 24.8-27.2 versus 11 months; 95% CI: 10.6-11.4; p<0.001 (Figure 5)]. Smaller differences in median survival were seen for regional disease (14 months; 95% CI: 13.7-14.3 versus 9 months; 95% CI: 8.7-9.3; p<0.001) and metastatic disease (6 months; 95% CI: 5.9-6.1 versus 5 months; 95% CI: 4.9-5.1; p=0.04) for EAC and SCC respectively.
Figure 4.
shows overall better median survival of EAC compared to SCC over four decades. The median survival increased consistently for both EAC and SCC until the 1990's. After this period, the median survival of EAC continued to increase at a more rapid rate while that of SCC has remained relatively stable. The p-values reported for trend analysis refers to comparison among all of the four decade quartiles.
Figure 5.
EAC had a better median survival than SCC. The most noticeable increase was seen in Localized disease.
Covariates were analyzed using multivariable Cox regression analyses with adjustment for patient clinical demographics, tumor characteristics and treatment. Age (> 45 years), sex (male), tumor histology (SCC), tumor grade (poorly differentiated), stage at diagnosis (metastatic), lymph node invasion, number of primary tumors (> 1), adjuvant radiotherapy, surgery, and decade of diagnosis (2000's) were independently associated with overall survival (Table 2). Specifically, receipt of surgery (HR= 0.52; 95% CI: 0.49–0.79; p < 0.001), adjuvant radiotherapy (HR = 0.70; 95% CI: 0.67–0.73; p < 0.001) and diagnoses of disease in the 2000's (HR = 0.94; 95% CI: 0.90–0.98; p < 0.04) were associated with a decreased risk of death.
Table 2.
Multivariate Cox Proportional Hazards Model Assessing factors Associated with Survival after Diagnosis of Esophageal Cancer
| Risk Factor | Hazard Ratio* | 95% Confidence Interval | Significance (p) | |
|---|---|---|---|---|
| Lower | Upper | |||
| Age (years) | ||||
| <45 | Referent | |||
| 45-65 | 1.24 | 1.12 | 1.37 | <0.001 |
| 65-80 | 1.53 | 1.39 | 1.69 | <0.001 |
| >80 | 2.05 | 1.85 | 2.28 | <0.001 |
| Gender | ||||
| Female | Referent | |||
| Male | 1.08 | 1.03 | 1.12 | 0.01 |
| Race | ||||
| other | Referent | |||
| Asian or Pacific Islander | 0.93 | 0.74 | 1.16 | 0.53 |
| Black | 1.19 | 0.96 | 1.47 | 0.12 |
| White | 1.05 | 0.85 | 1.30 | 0.65 |
| Histology | ||||
| Adenocarcinoma | Referent | |||
| Squamous cell carcinoma | 1.05 | 1.01 | 1.10 | 0.02 |
| Grade | ||||
| Well differentiated; Grade I | Referent | |||
| Moderately differentiated; Grade II | 1.01 | 0.96 | 1.06 | 0.76 |
| Poorly differentiated; Grade III | 1.18 | 1.12 | 1.24 | <0.001 |
| Stage | ||||
| Localized | Referent | 0.28 | ||
| Regional | 1.04 | 0.97 | 1.11 | <0.001 |
| Distant | 1.59 | 1.49 | 1.68 | |
| Adjuvant Radiotherapy Effect | ||||
| No | Referent | <0.001 | ||
| Yes | 0.70 | 0.67 | 0.73 | |
| Surgery Effect | ||||
| No Surgery | Referent | <0.001 | ||
| Surgery | 0.52 | 0.49 | 0.79 | |
| Period | ||||
| Before 2000s | Referent | <0.004 | ||
| 2000s | 0.94 | 0.90 | 0.98 | |
Tumor size and location were not significant predictors of survival on univariate or multivariate analysis
Hazard ratios greater than 1.0 indicate a higher risk of death
DISCUSSION
This study demonstrated gradual but continuing improvement in survival for EC in U.S. adults from 1973 to 2009. This was seen in all stages of the disease. The driving forces behind these changes in survival are most likely multi-factorial. Better access to patient care and advancements in medical, surgical, and adjuvant therapy may all have influenced mortality.
Our study data suggested that access to the advance medical care needed for EC may have improved in the U.S. as utilization rates of surgery and radiation therapy increased from 1970's to the 2000's (49% to 64% and 46% to 52%, respectively). Esophagectomy for esophageal cancer, which resulted in a postoperative 5-year survival rate of 4% in the 1970's, has risen to 28% in the 1990's.15,21,22 Although several studies have shown improved operative mortality rates for esophagectomy over the last 30 years, it is noteworthy that superior 30-day postoperative mortality rates do not necessarily translate to better long-term outcomes.23,24 The average surgical-related mortality rates between the 1950's and 1979 were 26% to 33%, then 7% to 19% between 1980 and 1988, and more recently ranged from approximately 5.2% to 8.9% between 1990 and 2000.18-22
Long-term survival rates based on data from retrospective single center experiences, all with many inherent heterogeneity biases, is difficult to validate-hence the need for database studies. Our database study does in fact validate the long-term survival benefits of surgical therapy as observed in single center studies. The receipt of surgical intervention was associated with a 48% increase in long-term median survival (HR=0.52, 95% CI: 0.49-0.79).
It is encouraging that over the study period, there was a progressive increase in detection at early stages.21,25 These improvements may be influenced by better screening and clinical surveillance of individuals with known risk factors for EC such as Barrett's esophagus.26,27,28 Tumor size is a known risk factor for mortality in other cancers such as colon, hepatocellular, and pancreatic cancer.29,30 Interestingly, in this study, tumor size was not independently associated with increased mortality. However, similar to other cancers, lymph node invasion, poorly differentiated grade and presence of more than one primary tumor were strong predictors of mortality.
Our study showed a rising prevalence of EAC compared to SCC over the last four decades. Before the 1990's, SCC was the most prevalent EC subtype; however, since that time the proportion of cases with EAC has continued to rise while SCC has slightly decreased. These epidemiologic changes may be explained by the changes in the prevalence of the underlying etiology of EAC and SCC.9,15,31,32 The rising prevalence of EAC in the U.S. can be explained by the obesity epidemic, which has increased significantly in the past thirty years from 22% to over 35%.11,31 The decreasing prevalence rates for SCC may be related to long-term reductions in tobacco use and alcohol consumption in the U.S.14,34,35
In our study we found a better overall median survival of EAC compared to SCC, especially for early stage disease, across all decades. This interesting finding is contrary to many small single-center studies that have suggested the reverse.23,36,37 However, one study found no difference in survival between patients with EAC and SCC.36 This difference may be explained by an inherent bias in small single-center retrospective studies in which shorter term follow-up occurs. SCC may initially respond to therapy better but have a poorer long-term prognosis. Additionally, the increase in median survival of EAC compared to SCC may be the result of the increased use of upper endoscopy for Barrett's esophagus screening over the last four decades.26,27,38 This may have increased the number of diagnosed early stage EAC cases, hence better survival. While this conclusion is a logical explanation for the observed trend, additional research is needed to further validate, explore, and explain this keeping in mind lead time bias.
Strengths of this study include the large number of patients reviewed (i.e. power) and availability of sufficient trend data for survival estimates as well as predictors of survival. SEER database sets have been shown to have a low risk of patient selection bias, miscoding, and inaccurate data entry.15,39-43 Interpretation of our results, however, are restricted by the inherent limitations of this study design including limited information on the method of diagnosis, patient co-morbidities, and specific treatment options (including type of adjuvant radiotherapy, and chemotherapy). Additionally, SEER does not report the presence of specific risk factors such as obesity, smoking, and diet that may affect prognosis and potentially influence the histologic type of EC. However, our study looked at all causes of mortality.
In conclusion, a significant survival improvement in EC was seen from 1973 to 2009. This appears to be largely as a result of both earlier detection at a curative stage and greater utilization of treatment modalities (especially surgery). Compared to SCC, the prevalence of EAC is rising. Despite this rising prevalence, patients with EAC have better long-term survival outcomes than those with SCC. We postulate that early diagnosis through better screening measures together with improved patient access on up-to-date treatment protocols are paramount to achieving better outcomes.
Footnotes
Conflict of Interest
The authors declared no financial conflict of interest.
Specific author contributions:
Study concept and design, paper preparation and Statistical analysis -B Njei
Paper preparation and critical revisions - JW Birk and TR McCarty
REFERENCES
- 1.Siegel R, Naishadham D, Jemal A. Cancer statistics, 2012. CA Cancer J Clin. 2012;62:10–29. doi: 10.3322/caac.20138. [DOI] [PubMed] [Google Scholar]
- 2.Simard EP, Ward EM, Siegel R, Jemal A. Cancers with increasing incidence trends in the United States: 1999 through 2008. CA Cancer J Clin. 2012;4:20141. doi: 10.3322/caac.20141. [DOI] [PubMed] [Google Scholar]
- 3.Hansson LE, Sparen P, Nyren O. Increasing incidence of both major histological types of esophageal carcinomas among men in Sweden. Int J Cancer. 1993;54:402–7. doi: 10.1002/ijc.2910540309. [DOI] [PubMed] [Google Scholar]
- 4.Jemal A, Bray F, Center MM, Ferlay J, Ward E, Forman D. Global cancer statistics. CA: a cancer journal for clinicians. 2011;61:69–90. doi: 10.3322/caac.20107. [DOI] [PubMed] [Google Scholar]
- 5.Engel LS, Chow WH, Vaughan TL, et al. Population attributable risks of esophageal and gastric cancers. Journal of the National Cancer Institute. 2003;95:1404–13. doi: 10.1093/jnci/djg047. [DOI] [PubMed] [Google Scholar]
- 6.Siegel RL, Miller KD, Jemal A. Cancer statistics, 2015. CA: a cancer journal for clinicians. 2015;65:5–29. doi: 10.3322/caac.21254. [DOI] [PubMed] [Google Scholar]
- 7.Blot WJ, Devesa SS, Kneller RW, Fraumeni JF., Jr. Rising incidence of adenocarcinoma of the esophagus and gastric cardia. Jama. 1991;265:1287–9. [PubMed] [Google Scholar]
- 8.Bollschweiler E, Wolfgarten E, Gutschow C, Holscher AH. Demographic variations in the rising incidence of esophageal adenocarcinoma in white males. Cancer. 2001;92:549–55. doi: 10.1002/1097-0142(20010801)92:3<549::aid-cncr1354>3.0.co;2-l. [DOI] [PubMed] [Google Scholar]
- 9.Dubecz A, Gall I, Solymosi N, et al. Temporal trends in long-term survival and cure rates in esophageal cancer: a SEER database analysis. J Thorac Oncol. 2012;7:443–7. doi: 10.1097/JTO.0b013e3182397751. [DOI] [PubMed] [Google Scholar]
- 10.Cen P, Banki F, Cheng L, et al. Changes in age, stage distribution, and survival of patients with esophageal adenocarcinoma over three decades in the United States. Ann Surg Oncol. 2012;19:1685–91. doi: 10.1245/s10434-011-2141-1. [DOI] [PubMed] [Google Scholar]
- 11.Hur C, Miller M, Kong CY, et al. Trends in esophageal adenocarcinoma incidence and mortality. Cancer. 2013;119:1149–58. doi: 10.1002/cncr.27834. [DOI] [PMC free article] [PubMed] [Google Scholar]
- 12.Trivers KF, Sabatino SA, Stewart SL. Trends in esophageal cancer incidence by histology, United States, 1998-2003. Int J Cancer. 2008;123:1422–8. doi: 10.1002/ijc.23691. [DOI] [PubMed] [Google Scholar]
- 13.Polednak AP. Trends in survival for both histologic types of esophageal cancer in US surveillance, epidemiology and end results areas. Int J Cancer. 2003;105:98–100. doi: 10.1002/ijc.11029. [DOI] [PubMed] [Google Scholar]
- 14.Nordenstedt H, El-Serag H. The influence of age, sex, and race on the incidence of esophageal cancer in the United States (1992-2006). Scand J Gastroenterol. 2011;46:597–602. doi: 10.3109/00365521.2011.551890. [DOI] [PubMed] [Google Scholar]
- 15.El-Serag HB MA, Key C. Trends in survival of patients with hepatocellular carcinoma between 1977 and 1996 in the United States. HEPATOLOGY. 2001;33:62–5. doi: 10.1053/jhep.2001.21041. [DOI] [PubMed] [Google Scholar]
- 16.Fritz A PC, Jack A, Shanmugaratnam K, Sobin L, Parkin DM, et al. International Classification of Diseases for Oncology. 3rd. World Health Organization; Geneva: 2000. 2000. [Google Scholar]
- 17.Percy CVHV, Muir C, editors. International Classification of Diseases for Oncology. 2nd ed. World Health Organization; Geneva: 1990. [Google Scholar]
- 18.World Health Organization G. International classification of diseases for oncology. (3rd ed.) 2000 [Google Scholar]
- 19.Agresti A. Introduction to categorical data analysis. Wiley; New York: 1996. pp. 182–5.pp. 7–9.pp. 201pp. 17pp. 79 [Google Scholar]
- 20.Kaplan PM EL. Nonparametric estimation from incomplete observations. J Am Stat Assoc. 1958;53:457–81. [Google Scholar]
- 21.Mariette C, Piessen G, Triboulet JP. Therapeutic strategies in oesophageal carcinoma: role of surgery and other modalities. Lancet Oncol. 2007;8:545–53. doi: 10.1016/S1470-2045(07)70172-9. [DOI] [PubMed] [Google Scholar]
- 22.Wang KK, Sampliner RE. Updated guidelines 2008 for the diagnosis, surveillance and therapy of Barrett's esophagus. Am J Gastroenterol. 2008;103:788–97. doi: 10.1111/j.1572-0241.2008.01835.x. [DOI] [PubMed] [Google Scholar]
- 23.Wolf MC, Stahl M, Krause BJ, et al. Curative treatment of oesophageal carcinoma: current options and future developments. Radiat Oncol. 2011;6:6–55. doi: 10.1186/1748-717X-6-55. [DOI] [PMC free article] [PubMed] [Google Scholar]
- 24.Hofstetter W, Swisher SG, Correa AM, et al. Treatment outcomes of resected esophageal cancer. Ann Surg. 2002;236:376–84. doi: 10.1097/00000658-200209000-00014. [DOI] [PMC free article] [PubMed] [Google Scholar]
- 25.Kohn GP, Galanko JA, Meyers MO, Feins RH, Farrell TM. National trends in esophageal surgery--are outcomes as good as we believe? J Gastrointest Surg. 2009;13:1900–10. doi: 10.1007/s11605-009-1008-2. [DOI] [PubMed] [Google Scholar]
- 26.Falk GW, Ours TM, Richter JE. Practice patterns for surveillance of Barrett's esophagus in the united states. Gastrointest Endosc. 2000;52:197–203. doi: 10.1067/mge.2000.107728. [DOI] [PubMed] [Google Scholar]
- 27.Lagergren J. Any role for endoscopy screening or surveillance for esophageal adenocarcinoma among persons with GERD? Gastrointest Endosc. 2008 Nov;68(5):856–8. doi: 10.1016/j.gie.2008.04.020. doi: 10.1016/j.gie.2008.04.020. [DOI] [PubMed] [Google Scholar]
- 28.Cameron AJ, Lomboy CT, Pera M, Carpenter HA. Adenocarcinoma of the esophagogastric junction and Barrett's esophagus. Gastroenterology. 1995;109:1541–6. doi: 10.1016/0016-5085(95)90642-8. [DOI] [PubMed] [Google Scholar]
- 29.Fortner JG, Klimstra DS, Senie RT, Maclean BJ. Tumor size is the primary prognosticator for pancreatic cancer after regional pancreatectomy. Ann Surg. 1996;223:147–53. doi: 10.1097/00000658-199602000-00006. [DOI] [PMC free article] [PubMed] [Google Scholar]
- 30.Roayaie S, Jibara G, Taouli B, Schwartz M. Resection of Hepatocellular Carcinoma with Macroscopic Vascular Invasion. Ann Surg Oncol. 2013;25:25. doi: 10.1245/s10434-013-3074-7. [DOI] [PubMed] [Google Scholar]
- 31.Vaughan TL, Davis S, Kristal A, Thomas DB. Obesity, alcohol, and tobacco as risk factors for cancers of the esophagus and gastric cardia: adenocarcinoma versus squamous cell carcinoma. Cancer Epidemiol Biomarkers Prev. 1995;4:85–92. [PubMed] [Google Scholar]
- 32.Garidou A, Tzonou A, Lipworth L, Signorello LB, Kalapothaki V, Trichopoulos D. Life-style factors and medical conditions in relation to esophageal cancer by histologic type in a low-risk population. Int J Cancer. 1996;68:295–9. doi: 10.1002/(SICI)1097-0215(19961104)68:3<295::AID-IJC5>3.0.CO;2-X. [DOI] [PubMed] [Google Scholar]
- 33.Pohl H, Sirovich B, Welch HG. Esophageal adenocarcinoma incidence: are we reaching the peak? Cancer Epidemiol Biomarkers Prev. 2010;19:1468–70. doi: 10.1158/1055-9965.EPI-10-0012. [DOI] [PubMed] [Google Scholar]
- 34.Enzinger PC, Mayer RJ. Esophageal cancer. N Engl J Med. 2003;349:2241–52. doi: 10.1056/NEJMra035010. [DOI] [PubMed] [Google Scholar]
- 35.Devesa SS, Blot WJ, Fraumeni JF., Jr. Changing patterns in the incidence of esophageal and gastric carcinoma in the United States. Cancer. 1998;83:2049–53. [PubMed] [Google Scholar]
- 36.Chang DT, Chapman C, Shen J, Su Z, Koong AC. Treatment of esophageal cancer based on histology: a surveillance epidemiology and end results analysis. Am J Clin Oncol. 2009;32:405–10. doi: 10.1097/COC.0b013e3181917158. [DOI] [PubMed] [Google Scholar]
- 37.Bedenne L, Michel P, Bouche O, et al. Chemoradiation followed by surgery compared with chemoradiation alone in squamous cancer of the esophagus: FFCD 9102. J Clin Oncol. 2007;25:1160–8. doi: 10.1200/JCO.2005.04.7118. [DOI] [PubMed] [Google Scholar]
- 38.Shaheen NJ. Advances in Barrett's esophagus and esophageal adenocarcinoma. Gastroenterology. 2005;128:1554–66. doi: 10.1053/j.gastro.2005.03.032. [DOI] [PubMed] [Google Scholar]
- 39.Moyer LA BC, Pollock DA. Validity of death certificates for injury-related causes of death. Am J Epidemiol. 1989;130:1024–32. doi: 10.1093/oxfordjournals.aje.a115403. [DOI] [PubMed] [Google Scholar]
- 40.Nathan H, Pawlik TM. Limitations of claims and registry data in surgical oncology research. Ann Surg Oncol. 2008;15:415–23. doi: 10.1245/s10434-007-9658-3. [DOI] [PubMed] [Google Scholar]
- 41.Warren JL, Klabunde CN, Schrag D, Bach PB, Riley GF. Overview of the SEER-Medicare data: content, research applications, and generalizability to the United States elderly population. Med Care. 2002;40:3–18. doi: 10.1097/01.MLR.0000020942.47004.03. [DOI] [PubMed] [Google Scholar]
- 42.Cooper GS, Virnig B, Klabunde CN, Schussler N, Freeman J, Warren JL. Use of SEER-Medicare data for measuring cancer surgery. Med Care. 2002;40:43–8. doi: 10.1097/00005650-200208001-00006. [DOI] [PubMed] [Google Scholar]
- 43.Das A, Thomas S, Zablotska LB, Neugut AI, Chak A. Association of esophageal adenocarcinoma with other subsequent primary cancers. J Clin Gastroenterol. 2006;40:405–11. doi: 10.1097/00004836-200605000-00008. [DOI] [PubMed] [Google Scholar]
- 44.Gerster M, Madsen M, Andersen PK. Matched survival data in a co-twin control design. Lifetime Data Anal. 2013;18:18. doi: 10.1007/s10985-013-9256-6. [DOI] [PubMed] [Google Scholar]
- 45.Sjolander A, Lichtenstein P, Larsson H, Pawitan Y. Between-within models for survival analysis. Stat Med. 2013;32:3067–76. doi: 10.1002/sim.5767. [DOI] [PubMed] [Google Scholar]


