Abstract
Objectives
To develop a reliable, reproducible rat model of posterior ischemic optic neuropathy (PION) and study the cellular responses in the optic nerve and retina.
Methods
Posterior ischemic optic neuropathy was induced in adult rats by photochemically induced ischemia. Retinal and optic nerve vasculature was examined by fluorescein isothiocyanate–dextran extravasation. Tissue sectioning and immunohistochemistry were used to investigate the pathologic changes. Retinal ganglion cell survival at different times after PION induction, with or without neurotrophic application, was quantified by fluorogold retrograde labeling.
Results
Optic nerve injury was confirmed after PION induction, including local vascular leakage, optic nerve edema, and cavernous degeneration. Immunostaining data revealed microglial activation and focal loss of astrocytes, with adjacent astrocytic hypertrophy. Up to 23%, 50%, and 70% retinal ganglion cell loss was observed at 1 week, 2 weeks, and 3 weeks, respectively, after injury compared with a sham control group. Experimental treatment by brain-derived neurotrophic factor and ciliary neurotrophic factor remarkably prevented retinal ganglion cell loss in PION rats. At 3 weeks after injury, more than 40% of retinal ganglion cells were saved by the application of neurotrophic factors.
Conclusions
Rat PION created by photochemically induced ischemia is a reproducible and reliable animal model for mimicking the key features of human PION.
Clinical Relevance
The correspondence between the features of this rat PION model to those of human PION makes it an ideal model to study the pathophysiologic course of the disease, most of which remains to be elucidated. Furthermore, it provides an optimal model for testing therapeutic approaches for optic neuropathies.
Ischemic optic neuropathy (ION), a kind of white matter stroke, is the most prevalent type of acute optic neuropathy in people older than 50 years of age.1 It can be further categorized as anterior ION (AION) and posterior ION (PION), according to the clinical presentation and the distinct sources of blood supply to these 2 portions of the optic nerve.2 Although less common than AION, PION in clinical practice is a devastating source of irreversible vision loss.3
Unlike AION, the pathogenesis and natural history of which have been studied extensively,4–7 to our knowledge, PION has remained understudied and poorly understood owing to its low prevalence, variable presentation, and ill-defined diagnostic criteria, although there is a clear association with inducers of ischemia such as prolonged vascular hypotension, arteriosclerosis, atherosclerosis, hemodilution, and orbital and periorbital edema.3 Histopathologic study of PION has been limited by scarce clinical samples because of the nonfatal nature of the disease.8 Furthermore, there are no effective treatments proven to either prevent or reverse vision loss from AION or PION. Therefore, developing a reliable, reproducible animal model of PION is of great value to study the evolution of the disease process in vivo as well as to test new therapeutic regimens for neuron protection and axon regeneration.
Photochemically induced ischemic injury to the microvasculature resulting in barrier leakage and thrombosis (photothrombosis) is an effective method for creating regional tissue ischemia.9–11 A type 2 photosensitive dye such as erythrosin B injected into the vascular circulation can be activated to produce reactive singlet molecular oxygen, which peroxidizes the vascular endothelium, resulting in acute vasogenic edema,10 and concomitant adherence and aggregation of platelets, leading to fibrin-free but stable occlusive thrombus formation.9–11 The local ischemia produced by thrombosis is greatly exacerbated by the accompanying vasogenic edema owing to mechanical compression and occlusion of nonphotothrom-bosed microvasculature, which progresses to depths beyond the penetration of the light beam.9–13 This method was originally developed to create rat models of small vessel thrombosis in the brain9–11 and later in the spinal cord.12,13 More recently, photochemically induced ischemia was applied to establish a rodent model of AION,14 which creates white matter (optic nerve head) ischemia; gray matter (retinal) ischemia is possible in the AION model if animals are intensely irradiated. To our knowledge, no reliable model of PION has yet been reported.
In the present study, we developed a novel rat model of PION by selectively inducing ischemia in the retrobulbar optic nerve. Here, we examine the unique neuronal and glial responses to PION and explore the role for neurotrophic factors in preventing the death of retinal ganglion cells (RGCs).
METHODS
All animal procedures were approved by the University of Miami institutional animal care and use committee, and they were performed in accordance with the Association for Research in Vision and Ophthalmology Statement for the Use of Animals in Ophthalmic and Visual Research. Adult male Sprague-Dawley (SD) or Wistar rats (150–250 g; Harlan Laboratories) were anesthetized prior to all surgical procedures by an intraparietal injection of ketamine hydrochloride, 60 mg/kg, and xylazine hydrochloride, 8mg/kg, according to their bodyweight. After surgery, animals were allowed to recover on a heating pad and were given subcutaneous injections of buprenorphine hydrochloride, 0.01 mg/kg, twice a day for 3 consecutive days to minimize discomfort.
LASER IRRADIATION SYSTEM
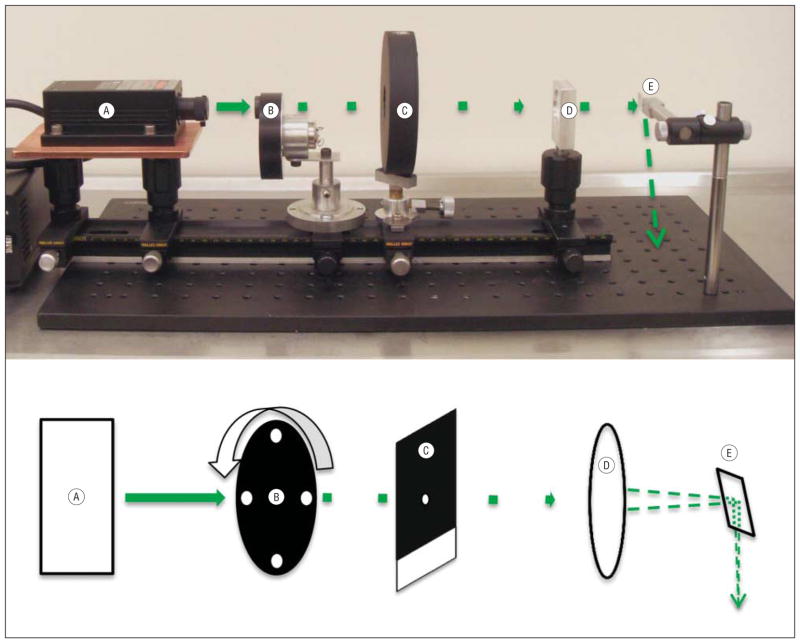
The laser irradiation system (Figure 1) consisting of the following components was mounted on a 0.5-m optical rail: (1) a 532-nm Nd:YAG laser (model LRS-532-KM-200-3; Laser-glow; Figure 1A) with output beam originating 35 cm from the subject rat’s head and operating at a maximum continuous power of 135 mW; (2) a custom-made 4-hole brass shim disk used as a beam chopper, rotating at 250 Hz and duty cycle of 15% (Figure 1B); (3) a mechanical shutter and corresponding shutter drive timer (model SD-10; AAM Vincent Associates; Figure 1C); (4) a 25-cm focal length spherical lens (CVI/Melles-Griot; Figure 1D) located 19 cm from the optic nerve, which focuses the beam onto the target nerve tissue after surgical exposure; and (5) a right-angle prism located 10 cm above the surgical platform to redirect the beam downward onto the optic nerve (Figure 1E, arrow). Proper beam placement was ensured by a weak aiming beam produced from the full-power beam, by spatially filtering it through a 100-μm diameter hole drilled in the closed shutter blade (Figure 1C). The resultant beam (<0.1% of incident intensity) appeared as a green spot on the optic nerve.
Figure 1.
Image and corresponding schematic diagram of the laser irradiation system and laser pathway. The laser irradiation system consists of a 532-nm continuous-wave Nd:YAG laser (with power supply, far left) (A), a custom-made beam chopper (B), a mechanical shutter and corresponding shutter drive timer (C), a 25-cm focal length spherical lens (D), and a right-angle prism to reflect the beam downward onto the optic nerve (E). The beam is designated by a solid green line from A to B; afterward, the beam is shown as chopped. The tip of the last dashed arrow (far right) on the mounting plate shows the approximate beam position, as projected by the right-angle prism, below its focal point on the optic nerve.
After intravenous erythrosin B dye injection, an orange-colored safety filter was inserted into the beam path by means of a foot switch, which also triggered the onset of full-power laser irradiation by opening the mechanical beam shutter after a delay of 1 second. Exposure times were preset using a shutter drive timer. The peak irradiation intensity focused on the nerve (diameter 550 μm by histology) was 107 W/cm2 with an average chopped beam intensity of 16 W/cm2. Irradiation with a chopped high-peak intensity laser beam facilitates effective penetration into the white matter to yield a predetermined depth of injury.13 Because the maximum absorbance of erythrosin B in tissue is at 537 nm, photochemical efficiency is optimized and unnecessary production of heat reduced by the near-resonant 532-nm beam. Erythrosin B activation, and thus the true beam position on the optic nerve, is indicated by erythrosin B fluorescence, ordinarily yellow but here visualized as a deep orange through the safety filter. The quantum efficiency of fluorescence is low because 89% of excited erythrosin B dye molecules proceed by intersystem crossing to the metastable, photochemically active triplet state.15 The energy of the erythrosin B triplet (excited) state is transferred by collision with ground-state (triplet) oxygen to yield singlet (excited state) oxygen (type 2 photochemistry), with an overall quantum efficiency of 69%. Singlet oxygen directly peroxidizes endothelial fatty acids and proteins. Because all its electrons are paired, it does not participate in radical chain reactions.
PION INDUCTION
All experimental animals underwent surgery in the left eye. An incision was made in the superior orbital rim, and the superior orbital tissue was spread bluntly to dissect downward through the orbital tissues. The superior rectus muscle was visualized and cut to reveal the intraorbital optic nerve. While taking care not to touch the nerve or peripheral blood vessels, the surrounding tissue was separated to expose a 5-mm length of the optic nerve, the incision being kept open manually. A 2% aqueous solution of erythrosin B (E8886; Sigma-Aldrich; 1 μL/mg rat weight, yielding a dose of 20 mg/kg rat weight) was injected via femoral vein catheter by a foot switch–activated infusion pump at 600 μL/min, followed by laser irradiation for 90 seconds at 3 to 4mmfrom the optic disc. Sham-treated animals underwent the same surgical exposure and laser treatment without injection of erythrosin B. The fundus was examined for integrity of the central retinal vein and artery at different times after the procedure.
CIRCULATION ASSESSMENT
Blood vessels of the retina and optic nerve were labeled by vascular perfusion with high molecular weight fluorescein isothiocyanate–dextran (2 × 10⁶ MW; Sigma-Aldrich) by a method similar to that described previously.16 Control animals and animals 1 hour after PION induction were terminally anesthetized with ketamine and xylazine. The left ventricle was rapidly perfused with 50 mL of phosphate-buffered saline followed by 20 mL of fluorescein isothiocyanate–dextran, 5 mg/mL. The animals were euthanized and their eyes dissected and postfixed in 4% paraformaldehyde (PFA) for 2 hours. Retinas and optic nerves were collected, flat mounted with mounting medium, and photographed.
RETROGRADE LABELING AND SURVIVAL QUANTIFICATION OF RGCs
Retrograde labeling with fluorogold (FG; fluorochrome) was completed 1 week before PION induction to study RGC survival. The method has been described previously.17 In brief, the animals were anesthetized and the skull was exposed by a midline incision. Bilateral 2-mm diameter craniostomies were placed 0.5 mm posterolateral to the sagittal and transverse sutures. A small piece of gelfoam (Gelfoam, USP) soaked in 4% FG was then placed on the surface of the superior colliculus. The incision was then sutured closed.
At fixed points (between 1 hour and 3 weeks after PION induction, depending on the experiment), acutely euthanized rats were perfused with 4% PFA and the eyes and optic nerves were removed. A suture marked the superior edge of the eyes for orientation and tissues were postfixed with 4% PFA for 2 hours at room temperature. Retinas were flat mounted in mounting medium (H-1000; Vector) on glass slides. Confocal images were taken with a confocal laser scanning microscope (Leica DM 6000B; Leica Biosystems) and a ×40 magnification oil-immersion lens. The imaging and quantification were performed in a masked fashion. The methods used for these procedures were adopted from previous studies.18–20 Briefly, the retinas were divided into 4 quadrants (superior, inferior, temporal, and nasal) and each quadrant was subdivided into 3 areas (central, middle, and peripheral), which were 1, 2, and 3 mm from the optic nerve head, respectively. One digital micrograph was randomly taken from each of the 12 fields. Thus, 12 images were quantified per retina.
Fluorogold-positive cells were counted manually in a masked fashion and presented as cells per millimeter squared in each region of the retina. Microglia and macrophages, which may have incorporated FG after phagocytosis of dying RGCs, were excluded based on morphology.21 Whole retinal RGC density was estimated using the formula: (DC + 3DM + 5DP)/9,22 where DC, DM, and DP represent densities of the central, middle, and peripheral regions, respectively. Each group contained at least 4 rats for obtaining mean densities.
INTRAVITREAL INJECTIONS OF BDNF AND CNTF
Neurotrophic factors were applied to SD rats at different times after PION induction. Intravitreal injections were performed just posterior to the pars plana with a 31-gauge needle (Hamilton) connected to a 5-μL Hamilton syringe. Care was taken not to damage the lens. The control group received no intravitreal injection; the other groups received a 5 ug/3 μL injection of either brain-derived neurotrophic factor (BDNF) or ciliary neurotrophic factor (CNTF) at either 3 days or in a series of repeated injections at 3, 7, and 14 days after PION induction.
ANTEROGRADE LABELING
Intravitreal injections of 1-μL cholera toxin subunit B (CT-B Alexa Fluor 594, 10 μg/μL; C-22841; Invitrogen) were performed 2 days before euthanasia. Optic nerves were dissected and postfixed in 4% PFA for 2 hours, followed by 20% sucrose dehydration at 4°C overnight. Longitudinal cryosections (20 μm) were made of the entire optic nerve and imaged with a −20 magnification objective.
TISSUE PREPARATION AND IMMUNOHISTOCHEMICAL ANALYSIS
For histologic examination, animals were euthanized 3, 7, 14, and 21 days after PION induction. Optic nerves were extracted and postfixed in 4% formaldehyde for 24 hours before embedding in paraffin. Longitudinal sections of 5-μm thickness were cut and stained with hematoxylin and eosin.
After euthanasia by 4% PFA perfusion, optic nerves from 1, 4, 7, 14, and 21 days post–PION induction were postfixed in 4% PFA for 2 hours and then kept in 20% sucrose at 4°C overnight for cryosectioning and immunostaining. Longitudinal cryosections (10 μm) were mounted onto glass slides. The slides were blocked for 30 minutes in a 20% goat serum and 0.2% Triton X-100 antibody buffer and then incubated at 4°C overnight with primary antibodies: ED1 (1:150; MCA341R; Serotec) for activated microglia/macrophages, and mouse monoclonal antiglial fibrillary acidic protein (1:500; G3893; Sigma- Aldrich) for activated astrocytes. Primary antibodies were detected with Alexa 594 fluorophore-conjugated secondary antibodies (1:500; Invitrogen) for 2 hours at room temperature. Tissues were mounted with 4′6-diamidino-2-phenylindole (DAPI)–containing medium after rinsing and imaged using a laser scanning confocal microscope (LSM 700; Zeiss).
STATISTICAL ANALYSIS
All data were analyzed with 1-way analysis of variance or t test using SPSS version 20.0 (SPSS Inc) and graphed using Microsoft Office Excel 2010. All data are displayed as means and standard error of the mean (SEM). Significance is represented with an asterisk.
RESULTS
EFFECT OF PION ON VASCULATURE OF THE OPTIC NERVE AND RETINA
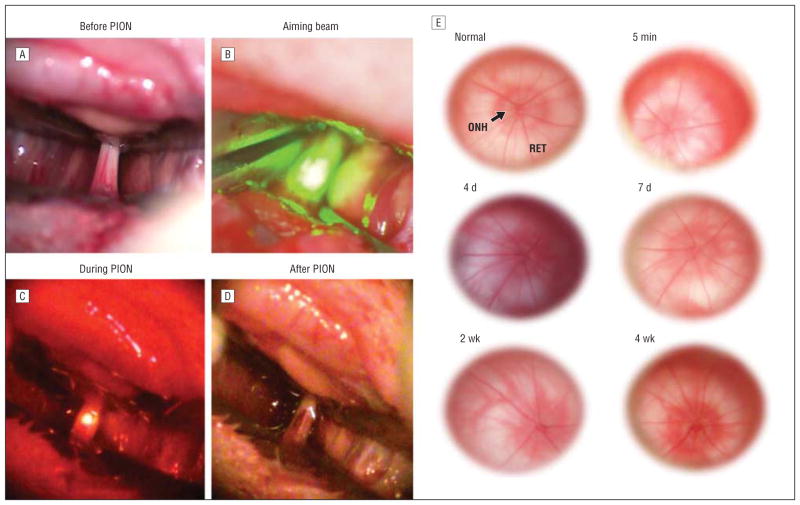
We first examined the clinical appearance of the optic nerve and retina following photochemically induced ischemic optic nerve injury. Before illumination, we observed a network of microvessels on the pial surface surrounding the optic nerve (Figure 2A). Illumination with the aiming beam produced a small green spot that enveloped the optic nerve diameter (Figure 2B). Under laser illumination without erythrosin B (sham-treated animals), no fluorescence was observed. However, after intravenous injection of erythrosin B, an orange fluorescent spot was visible during laser illumination (Figure 2C). Immediately after PION induction, we occasionally observed slight hemorrhage in the area of illumination, indicating vascular leakage (Figure 2D). The vessels in the sham-treated animals were still intact after illumination, suggesting that vascular leakage was caused by photochemical injury and not from the thermal energy of the laser.
Figure 2.
Rat surgical procedure and optic nerve photographs following posterior ischemic optic neuropathy (PION) induction. A, 5 mm of retrobulbar optic nerve surrounded by peripheral microvessels is exposed. B, The aiming beam is centered on the exposed optic nerve segment. C, After beam positioning, 90 seconds of laser irradiation with an average intensity of 16 W/cm2 was administered to erythrosin B–infused rats. Orange-filtered fluorescence arose only from vessels exposed directly to the laser beam. D, Slight hemorrhage may be observed immediately after PION induction. E, Funduscopic examination of optic nerve heads reveals no obvious differences immediately following or at 4 or 7 days or 2 or 4 weeks after PION induction. ONH indicates optic nerve head; RET, retina.
We investigated the retinas immediately as well as at 4, 7, 14, and 28 days following the induction of PION. Compared with the normal eyes, no obvious visible changes to the optic nerve head, such as edema or reduction of blood flow, were present through these examinations (Figure 2E). This result is consistent with human PION, in which the optic disc and retina appear normal on examination in the early stage of the disease.
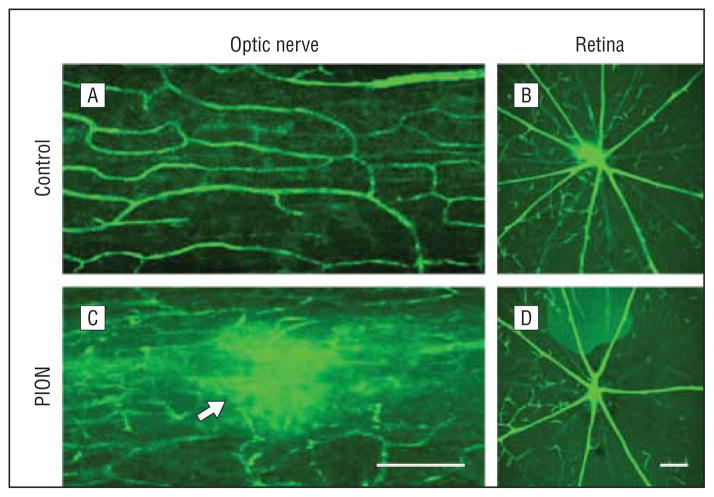
We next explored the specificity of vascular obstruction after PION induction, by perfusion of fluorescein isothiocyanate–dextran. In both normal control and sham-treated animals, interconnected capillaries were observed in a network surrounding the optic nerve with no visible leakage of fluorescence (Figure 3A). In contrast, at 1 hour after PION induction, optic nerve vessels in the lesioned area showed fluorescein dye leakage (Figure 3C, arrow). This plasma leakage was consistent with the hemorrhage occasionally observed following PION induction. The central retinal vessels and choroidal capillaries in both the sham-treated (Figure 3B) and PION-injured (Figure 3D) eyes appeared normal, without any leakage or interruption, indicating that the PION procedure interfered only with the circulation to the optic nerve.
Figure 3.
Optic nerve and retinal circulation evaluated by fluorescein isothiocyanate–dextran perfusion in vivo. A, Optic nerve vasculature in a sham-treated animal shows a clear capillary network and normal circulation. C, One hour after posterior ischemic optic neuropathy (PION) induction, fluorescein dye leakage is visible in the lesion area (arrow) and circulation appears compromised. The intraretinal vasculature in both sham-treated (B) and PION-treated (D) eyes 1 hour after surgical procedures appears unaffected, without leakage or interruption. Scale bars=200 μm.
OPTIC NERVE HISTOLOGY AFTER PION
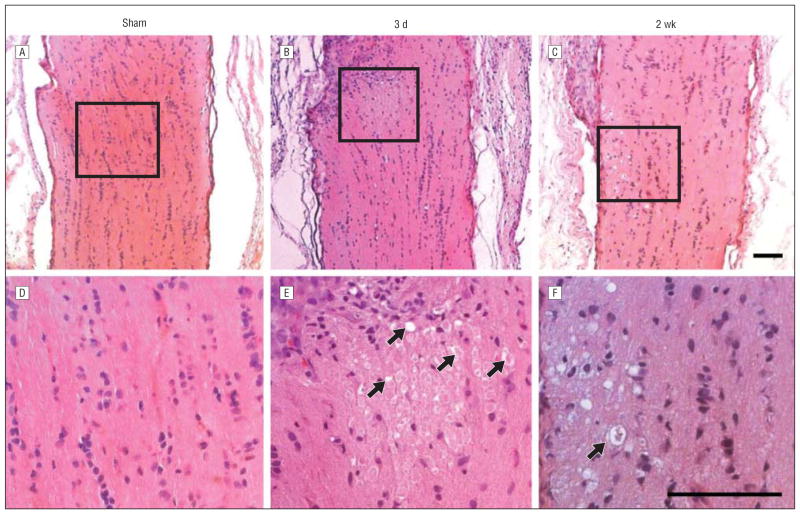
We next explored local changes in the optic nerve after PION. Optic nerves from both the contralateral control (erythrosin B only) and sham-treated animals demonstrated normal histology with optic nerve axons in a typical highly structured configuration (Figure 4A and D). By 3 days after PION, the lesioned area in the posterior portion of the optic nerve was swollen and the cellular architecture of the nerve in the infarct core was disrupted (Figure 4B). Nerve fiber bundles were edematous with swollen cells and cystic degeneration (Figure 4E, arrows). The optic nerve appeared grossly normal at the proximal and distal border of the lesion site. Two and 3 weeks after ischemic injury, optic nerves of the ischemic animals displayed further cavernous degeneration and atrophy (Figure 4C and F, arrow). Similar features were observed previously in the photochemically injured spinal cord.12,13
Figure 4.
Histologic changes of optic nerve after posterior ischemic optic neuropathy (PION). Posterior optic nerves appear normal 3 days after sham control surgical procedures (laser only/no erythrosin B) (A and D). B, However, 3 days after PION, an area of tissue edema is present. C, Atrophy and degenerative changes appear in posterior optic nerves 2 weeks after PION induction. E, Higher magnification of the boxed region in part B reveals swollen cells and caverns (arrows) within the edema area. F, Higher magnification of the boxed region in part C shows marked degeneration of neural tissue in the infarct region, producing an appearance resembling cavernous degeneration (arrow). Scale bars=100 μm.
AXON DEGENERATION AND GLIAL ACTIVATION AFTER PION
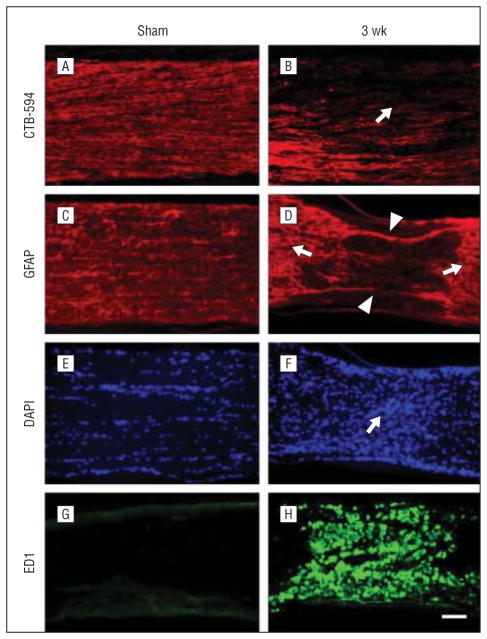
Anterograde labeling of RGC axons with CTB-594 was used to estimate axon degeneration after PION. Three weeks after PION induction, axonal fluorescence appeared weaker in the PION-lesioned area (Figure 5B, arrow) compared with proximal optic nerve tissue and sham-treated animals (Figure 5A). Loss of glial fibrillary acidic protein–positive astrocytes in the lesioned area (Figure 5D, arrowheads) was observed in the same point. Furthermore, hypertrophy of astrocyte processes was obvious in areas adjacent to the lesion (Figure 5D, arrows). The hypercellularity in the lesion zone noted with DAPI nuclear staining (Figure 5F, arrow) was associated with dramatic upregulation of ED1 staining (Figure 5H), reflecting microglial/macrophage recruitment and activation.23
Figure 5.
Axon degeneration and glia activation after posterior ischemic optic neuropathy (PION). Longitudinal sections of optic nerve labeled for CTB-594 (axons), glial fibrillary acidic protein (GFAP; astrocyte processes), 4′6-diamidino-2-phenylindole (DAPI; nuclear), and ED1 (microglia/macrophages) in the sham-treated and PION-induced optic nerve. Anterograde labeling of retinal ganglion cell axons with CTB-594 (A and B). Axonal fluorescence appears dense and uniform in sham-operated animals (A, laser only/no erythrosin B). The fluorescence becomes much weaker in the lesioned area of the optic nerve at 3 weeks after PION induction (B, arrow). In the sham-treated optic nerve (laser only/no erythrosin B), astrocytic processes are transversely arranged (C); 3 weeks after PION, there was a loss of processes in the lesioned area (D, arrowheads), with adjacent astrocytic hypertrophy (D, arrows). The hypercellularity indicated by DAPI nuclear staining was found in the lesioned area of PION-induced instead of sham-treated optic nerve (E and F, arrow). Dramatic upregulation of ED1 staining is observed in the lesioned area in some animals 3 weeks after PION (G and H). Scale bar=100 μm.
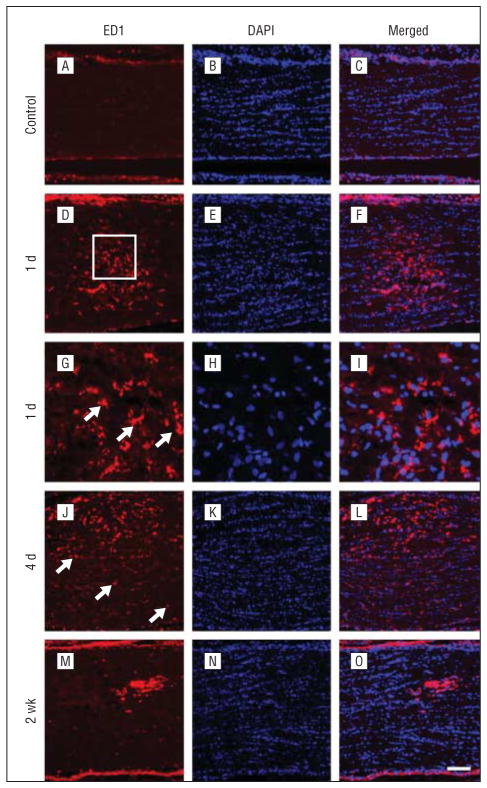
We next explored the course of local and distal activation of microglia/macrophages after optic nerve ischemia. Throughout the optic nerve of control rats, ED1-labeled cells were detected only rarely (Figure 6A). At 1 day after PION induction, an accumulation of ED1-positive microglia/macrophages was observed in the optic nerve (Figure 6D). The number of ED1-positive cells was highest in the infarct core and decreased with distance. Higher magnification showed ED1-positive cells with ameboid morphology (Figure 6G, arrows). At 4 days after PION induction, ED1-positive microglia/macrophages in the lesion area were more numerous than those at 1 day and displayed an activated, phagocytic morphology (Figure 6J). ED1-positive cells were also scattered throughout the peri-ischemic region (Figure 6J, arrows). By 2 weeks, in most animals, the number of ED1-positive cells had decreased in the infarct core (Figure 6M).
Figure 6.
Temporal characterization of microglia/macrophage activation in the optic nerve after posterior ischemic optic neuropathy. Sections taken from the proximal optic nerve in representative animals are shown. In the control rats, no ED1-labeled microglia/macrophages are detected (A–C). B, Nuclei are labeled by 4′6-diamidino-2-phenylindole (DAPI). At 1 day, many ED1-positive microglia/macrophages are observed but are restricted to the infarct core (D–F). G, Higher magnification of the boxed region reveals ameboid-shaped ED1-positive cells (arrows). An increased number of ED1-positive microglia/macrophages is present in the infarct core at 4 days (J–L). Scattered cells in the peri-ischemic area are also observed ( J, arrows). However, by 2 weeks, the accumulation of ED1-positive cells decreases in the infarct core (M–O). Scale bar=100 μm in A–F and J–O; 25 μm in G–I.
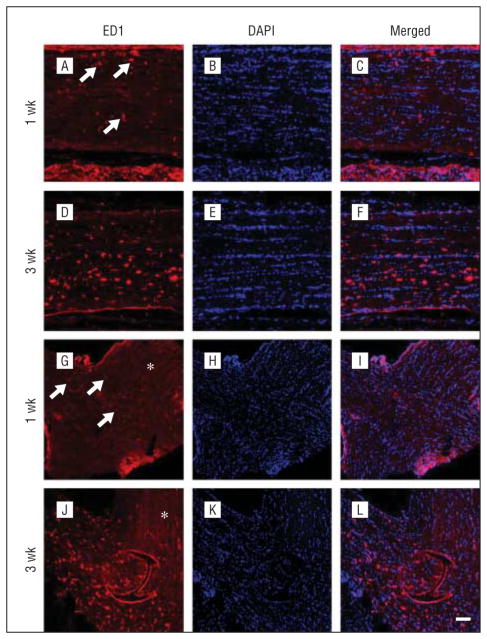
In the distal region of the degenerating optic nerve, no ED1-positive cells were detected at 1 day and 4 days after PION (data not shown). By 1 week after PION, ED1-positive cells appeared in the distal optic nerve (Figure 7A, arrows), and a few were even observed in the optic chiasm (Figure 7G, arrows). By 3 weeks after PION, more ED1-positive cells appeared in the distal optic nerve (Figure 7D) and optic chiasm (Figure 7J). No ED1-positive cells were observed in the contralateral optic nerve (Figure 7G and J, asterisk). Thus, microglial/macrophage activation follows PION initially in the infarct core and later in the distal optic nerve.
Figure 7.
Temporal characterization of microglia/macrophage activation in the distal optic nerve and optic chiasm. Sections taken from representative animals euthanized at 1 week (A–C and G–I) and 3 weeks (D–F and J–L) after the induction of PION are shown. Some ED1-positive microglia/macrophages (A, arrows) are present in the distal optic nerve at 1 week after posterior ischemic optic neuropathy induction (A–C). A few ED1-positive cells in the optic chiasm are also found at this point (G–I, arrows). Three weeks after surgery, an increased number of ED1-positive microglia/macrophages is noted both in the distal optic nerve (D–F) and optic chiasm (J–L). No ED1-positive microglia/macrophages are detected in the contralateral optic nerve (G and J, asterisk). Scale bar=100 μm. DAPI indicates 4′6-diamidino-2-phenylindole.
RGC SURVIVAL AFTER PION INDUCTION
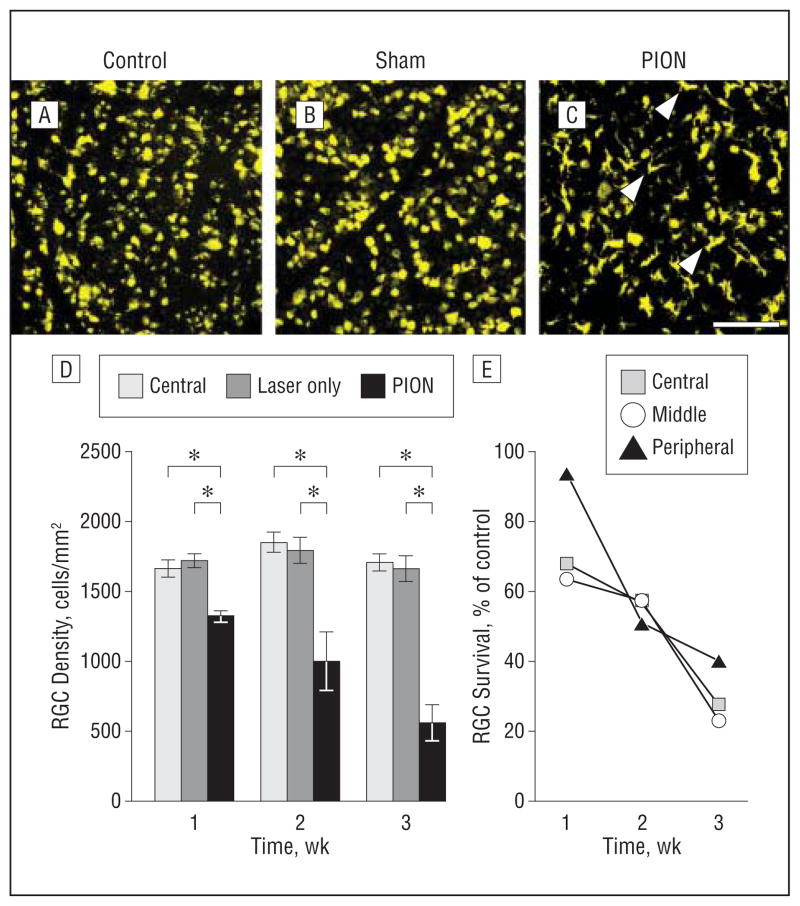
We next asked what was the course of RGC death following ischemic injury to axons. Quantifications of FG-positive cells in PION and control retinas (n=4 animals) were used to estimate RGC survival. After PION, there was a progressive, time-dependent loss of RGCs. At 1 week after injury, RGC number decreased by 23% (Figure 8D; mean [SEM], 1720 [50] RGCs/mm2 in the sham-treated group vs 1322 [39] RGCs/mm2 in the PION group). This reduction reached 50% by 2 weeks after PION(Figure 8D; mean [SEM], 1794 [94] RGCs/mm2 in the sham-treated group vs 999 [212] RGCs/mm2 in the PION group). At 3 weeks, almost 70% of the RGCs were lost when compared with control subjects (Figure 8D;mean[SEM], 1663 [93] RGCs/mm2 in the sham-treated group vs 560 [131] RGCs/mm2 in the PION group). Differences at each point were statistically significant (1-way analysis of variance; P<.001). However, no significant change in the number of RGCs between normal control animals and sham-treated animals was found (Figure 8D), implying that PION-induced RGC loss was elicited by the combination of erythrosin B and laser irradiation, rather than thermal energy from the laser alone. The line graph in Figure 8E shows the RGC survival rate at different points after injury in the central, middle, and peripheral regions of the retina. During the first week following PION induction, significantly more RGC loss was observed in the central and middle retinas than in the peripheral retina.
Figure 8.
Temporal characterization of retinal ganglion cell (RGC) survival after posterior ischemic optic neuropathy (PION). Retinal ganglion cells retrograde labeled with fluorogold and representative images of flat mounted retinal segments approximately 2 mm from the optic disk are shown (A–C). In the normal control (A) and sham-treated (B, laser only/no erythrosin B) eyes, RGCs are labeled with punctate fluorescence. C, Two weeks after PION induction, the number of fluorogold-labeled RGCs is markedly reduced. Some of the ameboid, densely fluorescent cells are microglia, which phagocytose fluorogold from dead RGCs (arrowheads). D, RGC quantification demonstrated no difference in the number of fluorogold-labeled RGCs between normal control animals and sham-treated animals at different points after surgery. However, the number of fluorogold-labeled RGCs is decreased in a time-dependent manner after PION induction. These decreases are statistically significant (error bars indicate mean [standard error of the mean]; *P<.001; 1-way analysis of variance; n=4 animals per group). E, RGC survival rate at different points after injury in the central, middle, and peripheral areas of the retina. Scale bar=100 μm.
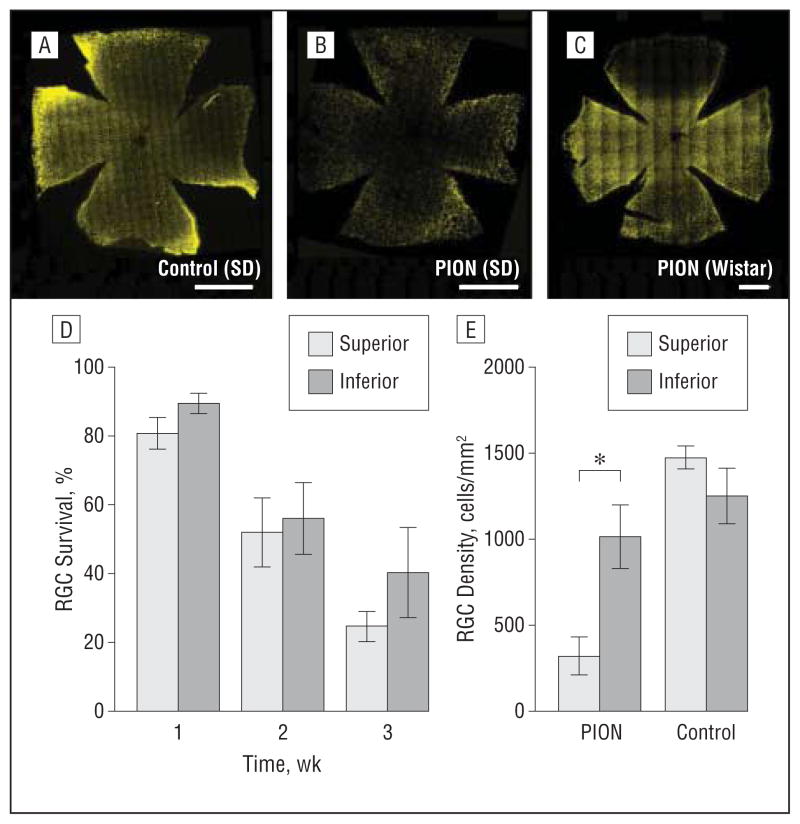
We also assessed RGC survival at different points after PION in the superior and inferior regions of the retina. In SD rats, the mosaic image of the whole-retina flat mount revealed a decline in RGC number throughout the retina (Figure 9B). No statistical difference was found in RGC survival between the superior and inferior portions of the retina in SD rats at any point (1, 2, or 3 weeks) after injury (Figure 9D). Interestingly, in Wistar rats, which we examined at 2 weeks after PION, RGC loss was primarily in the superior portion of the retina, whereas other portions of the retina remained relatively unaffected (Figure 9C and E; mean [SEM], 316 [113] RGCs/mm2 in the superior portion vs 1011 [70] RGCs/mm2 in the inferior portion of the retina). Thus, the region of RGC loss may be correlated with the side of the optic nerve treated with the ischemic lesion, but this is dependent on the strain tested, presumably owing to relative levels of optic nerve axon retinotopy.
Figure 9.
Spatial characterization of retinal ganglion cell (RGC) death after posterior ischemic optic neuropathy (PION) induction. Representative mosaic images of whole flat mounted retinas are shown (A–C). At 2 weeks after PION induction, a decreased number of fluorogold-labeled RGCs is detected throughout the retina (B) compared with the contralateral retina (A) in Sprague-Dawley (SD) rats. C, In Wistar rats, a dramatic decrease of fluorogold-labeled RGCs is restricted to the superior portion of the retina 2 weeks after PION induction. The spread of fluorogold-positive cells is confirmed by counting those cells in the superior and inferior portions of the retina (D and E). D, RGC death was uniform throughout the retina at different points in SD rats. E, In Wistar rats, RGC density in the superior portion of the retina is significantly less than in the inferior portion at 2 weeks after PION (error bars indicate mean [standard error of the mean]; *P<.001; t test comparing superior and inferior retinas within each strain; n=3 animals per group). Scale bar=1000 μm.
EFFECT OF NEUROTROPHIC FACTORS ON RGC SURVIVAL AFTER PION
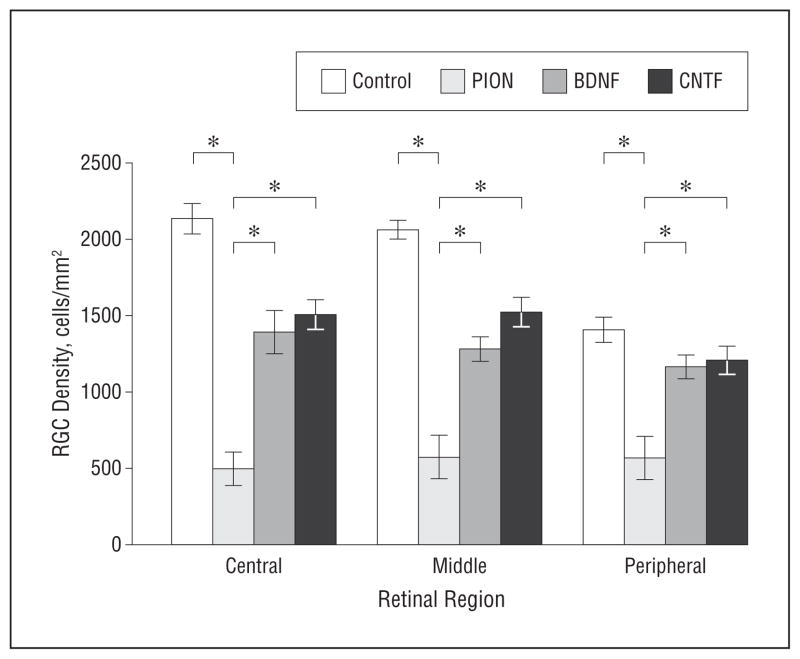
To assess the effect of neurotrophic factors on RGC survival in vivo, CNTF or BDNF was administered at 3 days after PION. Animals were euthanized 3weeks after PION. The number of surviving RGCs in animals with a single neurotrophic factor injection was slightly increased but was not statistically significantly different from that in retinas that received an injection of phosphate-buffered saline (data not shown). We then tested whether multiple injections (at 3, 7, and 14 days after injury) of CNTF or BDNF significantly enhanced RGC survival. We found that both CNTF and BDNF rescued more than 40% of RGCs normally lost at 3 weeks after PION induction (Figure 10 and Table). Thus, repeated exogenous neurotrophic support was able to prevent RGC loss after ischemic axon injury.
Figure 10.
Effect of brain-derived neurotrophic factor (BDNF) or ciliary neurotrophic factor (CNTF) on retinal ganglion cell (RGC) survival at 3 weeks after posterior ischemic optic neuropathy (PION) induction. The average density of surviving fluorogold-positive RGCs in the central, middle, and peripheral regions of the retina after PION and multiple intravitreal injections of BDNF or CNTF is shown. In animals receiving 3 injections (days 3, 7, and 14), BDNF and CNTF both significantly enhance RGC survival (error bars indicate mean [standard error of the mean]; *P<.01; 1-way analysis of variance, BDNF or CNTF compared with the PION-only group; n=4 animals per group).
Table.
Regional Percentages of RGC Survival at 3 Weeks Post-PION Induction
| Retinal Area | %
|
||||
|---|---|---|---|---|---|
| Survivala
|
Rescueb
|
||||
| PION | PION + BDNF | PION + CNTF | PION + BDNF | PION + CNTF | |
| Central | 23.1 | 65.2 | 70.6 | 42.1 | 47.5 |
| Middle | 27.6 | 62.2 | 73.9 | 34.6 | 46.3 |
| Peripheral | 40.3 | 82.9 | 85.7 | 42.6 | 45.4 |
Abbreviations: BDNF, brain-derived neurotrophic factor; CNTF, ciliary neurotrophic factor; PION, posterior ischemic optic neuropathy; RGC, retinal ganglion cell.
Survival = Experimental group/Control group.
Rescue = SurvivalBDNF/CNTF − SurvivalPION.
COMMENT
In the present study, we report on a novel model of rodent PION and use it to test the potential of 2 neurotrophic factors for neuroprotection in this optic neuropathy. To our knowledge, this is the first animal model that mimics human PION, as it displays many of the cardinal pathologic features of human PION24 including focal edema, swollen axons, and ballooned myelin sheaths, followed by axonal loss and cavernous degeneration, glial activation, and delayed RGC death. Although the induction of ischemia in this model was produced by peroxidative endothelial damage induced by singlet oxygen generated from activated erythrosin B, it is similar to human nonarteritic PION in creating local thrombosis and vasogenic edema.2,25 Neither the surgical exposure plus laser alone (eg, in sham-treated eyes) nor erythrosin B applied without the laser (eg, in contralateral eyes) produced any local damage or retrograde RGC death, demonstrating the focal specificity of the insult. Future efforts to characterize the model using measurement tools analogous to those used in humans such as optical coherence tomography, electroretinogram, and visually evoked potentials are warranted.
After PION induction, there was a rapid interruption of retrobulbar optic nerve vascular circulation and leakage from injured vessels. Edema in the infarcted area of the optic nerve was apparent at 3 days after injury. By putting pressure on the optic nerve—which may have limited its ability to expand in response to this edema, creating a compartment syndrome—regional tissue pressure increased and amplified the ischemia through the compression of intrinsic optic nerve blood vessels. Although axon collapse and optic nerve atrophy were evident at 2 weeks after injury, the anterior portion of the optic nerve was free of edema and had normal coloration and vascular filling. These findings are consistent with early stage clinical features in patients with PION. It is interesting to note that our model is different from a previous rodent AION model.14 In that model, focal retinal ischemia may occur close to the optic nerve. In addition, AION also causes pale and swollen optic nerve heads, which are typical clinical presentations in patients with AION but are absent in our model and in clinical PION.
Increasing evidence suggests that immune responses play an important role in ischemic stroke of the central nervous system.26 Both ischemia and the subsequent cell death can induce activation of microglial and macrophage cells.26,27 In our study, microglia/macrophages became activated and accumulated in the infarct core early after PION induction and then gradually decreased, except in some animals where strong microglial reactivity persisted only in the lesion center. These temporal changes match earlier ischemic studies of the brain,10,28 retina,29 and anterior optic nerve.30 A previous histopathologic study of human ischemic optic neuropathy also revealed similar cellular inflammation, in which swollen macrophages had infiltrated edematous nerve fiber bundles.8
Most research regarding immune response in the pathogenesis of experimental retinal and optic neuropathies have focused on the optic nerve head and proximal optic nerve.29,30 However, some evidence suggests that the distal portion of the optic nerve may also be affected. 31–34 In the current study, we observed microglia activation in the distal optic nerve and optic chiasm in a course spreading posteriorly between 7 days and 3 weeks after ischemic injury. This late microglial activation may serve multiple roles, including engulfment of deleterious debris from degenerating axons, and secretion of neurotrophic factors.35,36 These combined roles may contribute to an attempt at the regeneration of damaged tissue. On the other hand, microglia may also exert neurotoxic effects by releasing reactive oxygen species, nitric oxide, or inflammatory cytokines,37–41 which may mediate neuronal damage. Therefore, finding ways to regulate microglial activation to maximize beneficial effects may be critical to neuroprotective and regenerative therapies. Our model provides a new platform for testing such strategies following ischemic damage.
It has been reported that the pattern and course of RGC loss as well as the RGCs’ response to neurotrophic factors are quite distinct in different kinds of nerve injury. 20,42,43 In the present study, we investigated the magnitude and temporal course of RGC loss in this model and tested whether neurotrophic factors could also help to rescue RGCs after optic nerve ischemia. An interesting finding in this study was that 1 week postinjury, RGCs in the central and middle retina decreased significantly in SD rats, whereas very little RGC loss was observed in the periphery retina. This is similar to the visual field defect often seen in patients with PION.2 This may be due to the characteristic organization of blood supply to optic nerve axons. The posterior portion of rat optic nerve is supplied by peripheral centripetal capillaries formed by the pial vascular plexus,44 similar to that in humans.3 That renders human macular fibers, which lie in the central part of the optic nerve, and central vision more susceptible to ischemic damage than the peripheral axons that subserve peripheral vision. Although rodents do not have maculae, our findings suggest that in SD rats, axons of RGCs in the central retina may also lie in the central part of the optic nerve. Interestingly, in SD rats, RGC loss following PION induction was uniform across the retina at 2 to 3 weeks. However, in Wistar rats, RGC loss was mainly restricted to the superior part of the retina. Taken together, these results suggest that a degree of retinotopic organization may exist in the posterior optic nerve of Wistar but not SD rats. This is not directly comparable with previous studies on a rodent model of AION, which showed a regional pattern of RGC death more likely attributable to how the AION induction regionally affected local RGC axons at the optic nerve head.45–47 Importantly, the Wistar rat may provide an opportunity to use this model in the future as a testing ground for therapeutics, as each retina has its own control area lacking RGC degeneration.
Compared with other optic nerve trauma models widely used in research on RGC protection and optic nerve regeneration, such as optic nerve crush and transection, RGC loss in our model was slower. Traumatic models disrupt the normal optic nerve architecture and supportive environment, which may result in more rapid and severe RGC death.48 This optic nerve ischemic model selectively thromboses small vessels, as in the spinal cord,12,13 and may preserve more normal optic nerve architecture and its associated supportive environment such as antiapoptotic and progrowth signals. In our PION model, RGCs died in a course such that after 3 weeks, almost 30% of RGCs still survived. In other traumatic models, such as optic nerve crush or transection, more than 90% of RGCs died within 2 weeks.20 This prolongation of RGC death suggests that there may be an extended period where RGCs may be rescued by neuroprotective strategies following ischemic injury.
Neurotrophic factors such as BDNF, neurotrophin-3, basic fibroblast growth factor, and CNTF have been shown to enhance the survival of RGCs in several optic nerve injury models.49,50 However, there is less information regarding their ability to prevent RGC loss induced by ischemic optic neuropathy. Here, we found that multiple applications of BDNF or CNTF significantly increased RGC survival in SD rats 3 weeks after PION. Although BDNF has shown potent neuronal protection effects in many animal experiments, it did not show efficacy in a pilot study of peripheral neuropathy when tested in humans.51 The lack of effect in human trials may be the result of BDNF binding to p75NTR, which may promote cell death.52,53 In our ischemic optic neuropathy model, CNTF showed even better efficacy than BDNF, suggesting that it may also be an effective treatment to improve the visual function of patients with PION. Currently, there is a phase 1 clinical trial testing the effect of CNTF in patients with ischemic optic neuropathy (clinicaltrials.gov Identifier: NCT01411657).
It is not clear whether neurotrophic factors can affect long-term RGC neuroprotection. Some studies have shown that neurotrophic factors only delay, instead of fully prevent, RGC death.42,43 For example, after severe optic nerve crush, multiple applications of BDNF increased RGC survival at 20 days but less so by 1 month.42 On the other hand, long-term survival of RGCs after optic nerve crush was observed with chronic delivery of CNTF using adeno-associated viral vectors.54 Therefore, different patterns of optic nerve injury and neurotrophic factor administration may result in distinct responses of RGC to such treatment. Although we cannot conclude whether RGC loss in our model has been stabilized or only delayed by neurotrophic factor administration, even such delay might be valuable to help RGC survival in acute ischemia before vascular flow can be restored or collateral circulation recruited. Longer-term observations of neurotrophic or other strategies in this relevant model should address such questions.
In summary, we have developed a reliable and reproducible rodent PION model, in which retinal and optic nerve changes occurring after optic nerve stroke are similar to key features of human PION. Multiple application of BDNF or CNTF could mitigate RGC loss in this model, indicating potential application in clinical patients. Our model provides a novel platform for future research on detailed pathogenesis and molecular changes in PION and can be further optimized for preclinical drug screening of interventional agents against PION as well as other central nervous system ischemic diseases.
Acknowledgments
Funding/Support: This study was funded by grant EY022129 and P30 grant EY014801 from the National Eye Institute, grant NS074490 from National Institute of Neurological Disorders and Stroke, the American Heart Association, the James and Esther King Foundation, the doctoral student exchange program fund of Fudan University Graduate School (No. 2010033), and an unrestricted grant from Research to Prevent Blindness to the University of Miami.
Footnotes
Financial Disclosure: None reported.
Additional Contributions: We are indebted to Xinghuai Sun, MD, PhD, for helpful discussions and his critical reading of the manuscript, Gabe Gaidosh, BS, for microscopy expertise, and Eleut Hernandez for animal husbandry.
References
- 1.Rucker JC, Biousse V, Newman NJ. Ischemic optic neuropathies. Curr Opin Neurol. 2004;17(1):27–35. doi: 10.1097/00019052-200402000-00006. [DOI] [PubMed] [Google Scholar]
- 2.Hayreh SS. Posterior ischaemic optic neuropathy: clinical features, pathogenesis, and management. Eye (Lond) 2004;18(11):1188–1206. doi: 10.1038/sj.eye.6701562. [DOI] [PubMed] [Google Scholar]
- 3.Hayreh SS. Ischemic optic neuropathy. Prog Retin Eye Res. 2009;28(1):34–62. doi: 10.1016/j.preteyeres.2008.11.002. [DOI] [PubMed] [Google Scholar]
- 4.Hayreh SS. Inter-individual variation in blood-supply of the optic nerve head: its importance in various ischemic disorders of the optic nerve head, and glaucoma, low-tension glaucoma and allied disorders. Doc Ophthalmol. 1985;59 (3):217–246. doi: 10.1007/BF00159262. [DOI] [PubMed] [Google Scholar]
- 5.Jacobson DM, Vierkant RA, Belongia EA. Nonarteritic anterior ischemic optic neuropathy: a case-control study of potential risk factors. Arch Ophthalmol. 1997;115(11):1403–1407. doi: 10.1001/archopht.1997.01100160573008. [DOI] [PubMed] [Google Scholar]
- 6.Kosmorsky G, Straga J, Knight C, Dagirmanjian A, Davis DA. The role of transcranial Doppler in nonarteritic ischemic optic neuropathy. Am J Ophthalmol. 1998;126(2):288–290. doi: 10.1016/s0002-9394(98)00154-8. [DOI] [PubMed] [Google Scholar]
- 7.Hayreh SS, Zimmerman MB. Non-arteritic anterior ischemic optic neuropathy: role of systemic corticosteroid therapy. Graefes Arch Clin Exp Ophthalmol. 2008;246(7):1029–1046. doi: 10.1007/s00417-008-0805-8. [DOI] [PMC free article] [PubMed] [Google Scholar]
- 8.Knox DL, Kerrison JB, Green WR. Histopathologic studies of ischemic optic neuropathy. Trans Am Ophthalmol Soc. 2000;98:203–220. discussion 221–222. [PMC free article] [PubMed] [Google Scholar]
- 9.Watson BD. Animal models of photochemically induced brain ischemia and stroke. In: Ginsberg MD, Bogousslavsky J, editors. Cerebrovascular Disease: Pathophysiology, Diagnosis and Treatment. Cambridge, Massachusetts: Blackwell Science; 1998. pp. 52–73. [Google Scholar]
- 10.Dietrich WD, Busto R, Watson BD, Scheinberg P, Ginsberg MD. Photochemically induced cerebral infarction, II: edema and blood-brain barrier disruption. Acta Neuropathol. 1987;72(4):326–334. doi: 10.1007/BF00687263. [DOI] [PubMed] [Google Scholar]
- 11.Watson BD, Dietrich WD, Busto R, Wachtel MS, Ginsberg MD. Induction of reproducible brain infarction by photochemically initiated thrombosis. Ann Neurol. 1985;17(5):497–504. doi: 10.1002/ana.410170513. [DOI] [PubMed] [Google Scholar]
- 12.Prado R, Dietrich WD, Watson BD, Ginsberg MD, Green BA. Photochemically induced graded spinal cord infarction: behavioral, electrophysiological, and morphological correlates. J Neurosurg. 1987;67(5):745–753. doi: 10.3171/jns.1987.67.5.0745. [DOI] [PubMed] [Google Scholar]
- 13.Bunge MB, Holets VR, Bates ML, Clarke TS, Watson BD. Characterization of photochemically induced spinal cord injury in the rat by light and electron microscopy. Exp Neurol. 1994;127(1):76–93. doi: 10.1006/exnr.1994.1082. [DOI] [PubMed] [Google Scholar]
- 14.Bernstein SL, Guo Y, Kelman SE, Flower RW, Johnson MA. Functional and cellular responses in a novel rodent model of anterior ischemic optic neuropathy. Invest Ophthalmol Vis Sci. 2003;44(10):4153–4162. doi: 10.1167/iovs.03-0274. [DOI] [PubMed] [Google Scholar]
- 15.Gandin E, Lion Y, Vandevorst A. Quantum yield of singlet oxygen production by xanthene derivatives. Photochem Photobiol. 1983;37(3):271–278. doi: 10.1111/j.1751-1097.1983.tb04472.x. [DOI] [Google Scholar]
- 16.D’Amato R, Wesolowski E, Smith LEH. Microscopic visualization of the retina by angiography with high-molecular-weight fluorescein-labeled dextrans in the mouse. Microvasc Res. 1993;46(2):135–142. doi: 10.1006/mvre.1993.1042. [DOI] [PubMed] [Google Scholar]
- 17.Chiu K, Lau WM, Yeung SC, Chang RC, So KF. Retrograde labeling of retinal ganglion cells by application of fluoro-gold on the surface of superior colliculus. J Vis Exp. 2008;(16) doi: 10.3791/819. [DOI] [PMC free article] [PubMed] [Google Scholar]
- 18.Lafuente MP, Villegas-Pérez MP, Sobrado-Calvo P, García-Avilés A, Miralles de Imperial J, Vidal-Sanz M. Neuroprotective effects of alpha(2)-selective adrenergic agonists against ischemia-induced retinal ganglion cell death. Invest Ophthalmol Vis Sci. 2001;42(9):2074–2084. [PubMed] [Google Scholar]
- 19.Tsai RK, Chang CH, Wang HZ. Neuroprotective effects of recombinant human granulocyte colony-stimulating factor (G-CSF) in neurodegeneration after optic nerve crush in rats. Exp Eye Res. 2008;87(3):242–250. doi: 10.1016/j.exer.2008.06.004. [DOI] [PubMed] [Google Scholar]
- 20.Berkelaar M, Clarke DB, Wang YC, Bray GM, Aguayo AJ. Axotomy results in delayed death and apoptosis of retinal ganglion cells in adult rats. J Neurosci. 1994;14(7):4368–4374. doi: 10.1523/JNEUROSCI.14-07-04368.1994. [DOI] [PMC free article] [PubMed] [Google Scholar]
- 21.Levkovitch-Verbin H, Quigley HA, Martin KRG, Zack DJ, Pease ME, Valenta DF. A model to study differences between primary and secondary degeneration of retinal ganglion cells in rats by partial optic nerve transection. Invest Ophthalmol Vis Sci. 2003;44(8):3388–3393. doi: 10.1167/iovs.02-0646. [DOI] [PubMed] [Google Scholar]
- 22.Qin Yaowu, Xu Gezhi, Wang Wenji. Damage of the retrograde axial flow of retinal ganglion cells in diabetic rats at the early stage. Chin J Ocul Fundus Dis. 2006;22(1):4–6. [Google Scholar]
- 23.Wu D, Miyamoto O, Shibuya S, et al. Co-expression of radial glial marker in macrophages/microglia in rat spinal cord contusion injury model. Brain Res. 2005;1051(1–2):183–188. doi: 10.1016/j.brainres.2005.05.054. [DOI] [PubMed] [Google Scholar]
- 24.Isayama Y, Takahashi T. Posterior ischemic optic neuropathy, II: histopathology of the idiopathic form. Ophthalmologica. 1983;187(1):8–18. doi: 10.1159/000309295. [DOI] [PubMed] [Google Scholar]
- 25.Sadda SR, Nee M, Miller NR, Biousse V, Newman NJ, Kouzis A. Clinical spectrum of posterior ischemic optic neuropathy. Am J Ophthalmol. 2001;132(5):743–750. doi: 10.1016/s0002-9394(01)01199-0. [DOI] [PubMed] [Google Scholar]
- 26.Chamorro A, Hallenbeck J. The harms and benefits of inflammatory and immune responses in vascular disease. Stroke. 2006;37(2):291–293. doi: 10.1161/01.STR.0000200561.69611.f8. [DOI] [PMC free article] [PubMed] [Google Scholar]
- 27.Wang Q, Tang XN, Yenari MA. The inflammatory response in stroke. J Neuroimmunol. 2007;184(1–2):53–68. doi: 10.1016/j.jneuroim.2006.11.014. [DOI] [PMC free article] [PubMed] [Google Scholar]
- 28.Ito D, Tanaka K, Suzuki S, Dembo T, Fukuuchi Y. Enhanced expression of Iba1, ionized calcium-binding adapter molecule 1, after transient focal cerebral ischemia in rat brain. Stroke. 2001;32(5):1208–1215. doi: 10.1161/01.str.32.5.1208. [DOI] [PubMed] [Google Scholar]
- 29.Zhang C, Lam TT, Tso MOM. Heterogeneous populations of microglia/macrophages in the retina and their activation after retinal ischemia and reperfusion injury. Exp Eye Res. 2005;81(6):700–709. doi: 10.1016/j.exer.2005.04.008. [DOI] [PubMed] [Google Scholar]
- 30.Zhang C, Guo Y, Miller NR, Bernstein SL. Optic nerve infarction and post-ischemic inflammation in the rodent model of anterior ischemic optic neuropathy (rAION) Brain Res. 2009;1264:67–75. doi: 10.1016/j.brainres.2008.12.075. [DOI] [PMC free article] [PubMed] [Google Scholar]
- 31.Schlamp CL, Li Y, Dietz JA, Janssen KT, Nickells RW. Progressive ganglion cell loss and optic nerve degeneration in DBA/2J mice is variable and asymmetric. BMC Neurosci. 2006;7:66. doi: 10.1186/1471-2202-7-66. [DOI] [PMC free article] [PubMed] [Google Scholar]
- 32.Chidlow G, Holman MC, Wood JP, Casson RJ. Spatiotemporal characterization of optic nerve degeneration after chronic hypoperfusion in the rat. Invest Ophthalmol Vis Sci. 2010;51(3):1483–1497. doi: 10.1167/iovs.09-4603. [DOI] [PubMed] [Google Scholar]
- 33.Frank M, Wolburg H. Cellular reactions at the lesion site after crushing of the rat optic nerve. Glia. 1996;16(3):227–240. doi: 10.1002/(SICI)1098-1136(199603)16:3<227::AID-GLIA5>3.0.CO;2-Z. [DOI] [PubMed] [Google Scholar]
- 34.Ebneter A, Casson RJ, Wood JPM, Chidlow G. Microglial activation in the visual pathway in experimental glaucoma: spatiotemporal characterization and correlation with axonal injury. Invest Ophthalmol Vis Sci. 2010;51(12):6448–6460. doi: 10.1167/iovs.10-5284. [DOI] [PubMed] [Google Scholar]
- 35.Kriz J. Inflammation in ischemic brain injury: timing is important. Crit Rev Neurobiol. 2006;18(1–2):145–157. doi: 10.1615/critrevneurobiol.v18.i1-2.150. [DOI] [PubMed] [Google Scholar]
- 36.Zhao BQ, Wang S, Kim HY, et al. Role of matrix metalloproteinases in delayed cortical responses after stroke. Nat Med. 2006;12(4):441–445. doi: 10.1038/nm1387. [DOI] [PubMed] [Google Scholar]
- 37.Yenari MA, Xu L, Tang XN, Qiao Y, Giffard RG. Microglia potentiate damage to blood-brain barrier constituents: improvement by minocycline in vivo and in vitro. Stroke. 2006;37(4):1087–1093. doi: 10.1161/01.STR.0000206281.77178.ac. [DOI] [PubMed] [Google Scholar]
- 38.Lehnardt S, Massillon L, Follett P, et al. Activation of innate immunity in the CNS triggers neurodegeneration through a toll-like receptor 4-dependent pathway. Proc Natl Acad Sci U S A. 2003;100(14):8514–8519. doi: 10.1073/pnas.1432609100. [DOI] [PMC free article] [PubMed] [Google Scholar]
- 39.Giulian D, Corpuz M, Chapman S, Mansouri M, Robertson C. Reactive mononuclear phagocytes release neurotoxins after ischemic and traumatic injury to the central nervous system. J Neurosci Res. 1993;36(6):681–693. doi: 10.1002/jnr.490360609. [DOI] [PubMed] [Google Scholar]
- 40.Jordán J, Segura T, Brea D, Galindo MF, Castillo J. Inflammation as therapeutic objective in stroke. Curr Pharm Des. 2008;14(33):3549–3564. doi: 10.2174/138161208786848766. [DOI] [PubMed] [Google Scholar]
- 41.Hamby AM, Suh SW, Kauppinen TM, Swanson RA. Use of a poly(ADP-ribose) polymerase inhibitor to suppress inflammation and neuronal death after cerebral ischemia-reperfusion. Stroke. 2007;38(2 suppl):632–636. doi: 10.1161/01.STR.0000250742.61241.79. [DOI] [PubMed] [Google Scholar]
- 42.Zhi Y, Lu Q, Zhang CW, Yip HK, So KF, Cui Q. Different optic nerve injury sites result in different responses of retinal ganglion cells to brain-derived neurotrophic factor but not neurotrophin-4/5. Brain Res. 2005;1047(2):224–232. doi: 10.1016/j.brainres.2005.04.037. [DOI] [PubMed] [Google Scholar]
- 43.Parrilla-Reverter G, Agudo M, Sobrado-Calvo P, Salinas-Navarro M, Villegas-Perez MP, Vidal-Sanz M. Effects of different neurotrophic factors on the survival of retinal ganglion cells after a complete intraorbital nerve crush injury: a quantitative in vivo study. Exp Eye Res. 2009;89(1):32–41. doi: 10.1016/j.exer.2009.02.015. [DOI] [PubMed] [Google Scholar]
- 44.Lessell S. Capillaries of rat optic nerve. Relationship of anomalies to cyanide lesions. Arch Ophthalmol. 1974;91(4):308–310. doi: 10.1001/archopht.1974.03900060318015. [DOI] [PubMed] [Google Scholar]
- 45.Bernstein SL, Guo Y, Slater BJ, Puche A, Kelman SE. Neuron stress and loss following rodent anterior ischemic optic neuropathy in double-reporter transgenic mice. Invest Ophthalmol Vis Sci. 2007;48(5):2304–2310. doi: 10.1167/iovs.06-0486. [DOI] [PubMed] [Google Scholar]
- 46.Slater BJ, Mehrabian Z, Guo Y, Hunter A, Bernstein SL. Rodent anterior ischemic optic neuropathy (rAION) induces regional retinal ganglion cell apoptosis with a unique temporal pattern. Invest Ophthalmol Vis Sci. 2008;49(8):3671–3676. doi: 10.1167/iovs.07-0504. [DOI] [PMC free article] [PubMed] [Google Scholar]
- 47.Zhang C, Guo Y, Slater BJ, Miller NR, Bernstein SL. Axonal degeneration, regeneration and ganglion cell death in a rodent model of anterior ischemic optic neuropathy (rAION) Exp Eye Res. 2010;91(2):286–292. doi: 10.1016/j.exer.2010.05.021. [DOI] [PMC free article] [PubMed] [Google Scholar]
- 48.Goldberg JL, Espinosa JS, Xu Y, Davidson N, Kovacs GT, Barres BA. Retinal ganglion cells do not extend axons by default: promotion by neurotrophic signaling and electrical activity. Neuron. 2002;33(5):689–702. doi: 10.1016/s0896-6273(02)00602-5. [DOI] [PubMed] [Google Scholar]
- 49.Mo X, Yokoyama A, Oshitari T, et al. Rescue of axotomized retinal ganglion cells by BDNF gene electroporation in adult rats. Invest Ophthalmol Vis Sci. 2002;43(7):2401–2405. [PubMed] [Google Scholar]
- 50.Unoki K, LaVail MM. Protection of the rat retina from ischemic injury by brain-derived neurotrophic factor, ciliary neurotrophic factor, and basic fibroblast growth factor. Invest Ophthalmol Vis Sci. 1994;35(3):907–915. [PubMed] [Google Scholar]
- 51.Bensa S, Hadden RD, Hahn A, Hughes RA, Willison HJ. Randomized controlled trial of brain-derived neurotrophic factor in Guillain-Barré syndrome: a pilot study. Eur J Neurol. 2000;7(4):423–426. doi: 10.1046/j.1468-1331.2000.00096.x. [DOI] [PubMed] [Google Scholar]
- 52.Hu Y, Cho S, Goldberg JL. Neurotrophic effect of a novel TrkB agonist on retinal ganglion cells. Invest Ophthalmol Vis Sci. 2010;51(3):1747–1754. doi: 10.1167/iovs.09-4450. [DOI] [PMC free article] [PubMed] [Google Scholar]
- 53.Yoon SO, Casaccia-Bonnefil P, Carter B, Chao MV. Competitive signaling between TrkA and p75 nerve growth factor receptors determines cell survival. J Neurosci. 1998;18(9):3273–3281. doi: 10.1523/JNEUROSCI.18-09-03273.1998. [DOI] [PMC free article] [PubMed] [Google Scholar]
- 54.Leaver SG, Cui Q, Plant GW, et al. AAV-mediated expression of CNTF promotes long-term survival and regeneration of adult rat retinal ganglion cells. Gene Ther. 2006;13(18):1328–1341. doi: 10.1038/sj.gt.3302791. [DOI] [PubMed] [Google Scholar]


