

Abstract
United States Environmental Protection Agency has recommended estimating pyrethroids’ risk using cumulative exposure. For cumulative risk assessment, it would be useful to have a bioanalytical method for quantification of one or several pyrethroids simultaneously in a small sample volume to support toxicokinetic studies. Therefore, in the present study, a simple, sensitive and high-throughput ultraperformance liquid chromatography–tandem mass spectrometry method was developed and validated for simultaneous analysis of seven pyrethroids (fenvalerate, fenpropathrin, bifenthrin, lambda-cyhalothrin, cyfluthrin, cypermethrin and deltamethrin) in 100 µL of rat plasma. A simple single-step protein precipitation method was used for the extraction of target compounds. The total chromatographic run time of the method was 5 min. The chromatographic system used a Supelco C18 column and isocratic elution with a mobile phase consisting of methanol and 5 mM ammonium formate in the ratio of 90 : 10 (v/v). Mass spectrometer (API 4000) was operated in multiple reaction monitoring positive-ion mode using the electrospray ionization technique. The calibration curves were linear in the range of 7.8–2,000 ng/mL with correlation coefficients of ≥0.99. All validation parameters such as precision, accuracy, recovery, matrix effect and stability met the acceptance criteria according to the regulatory guidelines. The method was successfully applied to the toxicokinetic study of cypermethrin in rats. To the best of our knowledge, this is the first LC–MS-MS method for the simultaneous analysis of pyrethroids in rat plasma. This validated method with minimal modification can also be utilized for forensic and clinical toxicological applications due to its simplicity, sensitivity and rapidity.
Introduction
Pyrethroids are widely used to eliminate or control a variety of agricultural and household pests (1–3). Pyrethroids have been increasingly used during the past decade due to their limited toxicity to mammals and broad spectrum of pest control. However, pyrethroids are known to be toxic to the nervous system of both mammals and insects (2, 4–6). Despite the usefulness of synthetic pyrethroids in the increment of food production, their injudicious use can lead to environmental contamination and to the presence of their residues in food commodities and water (7–9). Many public health benefits have been gained from the use of synthetic pyrethroids, but in spite of the obvious advantages, the potential adverse impact on the environment and public health can be substantial, because of their inappropriate handling, without any safety equipment during manufacturing and use. However, with the widespread use of pesticides, it is virtually impossible to avoid exposure at some level. The degree and duration of toxicity of any toxicant is determined by the toxicant concentration in the systemic circulation. Therefore, toxicokinetic information provides a significant value in interpreting the toxicity study outcomes from animal studies and proper risk characterization in humans (10).
Several analytical and bioanalytical methods have been reported for the determination of pyrethroids in fruits, vegetables, milk, water and biological matrices (11–24). Table I summarizes the published methods for pyrethroid determination in biological matrices. However, the reported bioanalytical methods for pyrethroids mainly focused on biomonitoring applications, which require a large volume of sample for analysis. Furthermore, most of the reported bioanalytical methods are based on gas chromatographic analysis, require a large volume of sample for analysis utilize a tedious extraction procedure for analyte extraction (liquid–liquid extraction and dispersive liquid–liquid microextraction) and have long chromatographic run time (≥15 min). Large sample volume requirement of these reported bioanalytical methods limits their application on toxicokinetic studies (which require multiple blood sampling from same animals) in most commonly used species for toxicity studies such as mice and rats due to limited blood volume in these species. Recently, one GC–MS method has been reported for the determination of deltamethrin and rat plasma and brain for toxicokinetic applications (17). However, this method focused only on one pyrethroid, i.e., deltamethrin with long chromatographic run time of ∼15 min.
Table I.
Bioanalytical Methods Reported for Pyrethroid Determination in Biological Matrices
| Analyte(s) | Instrument | Sample volume/matrix | Extraction procedure | Run time (min) | LOD/LLOQ | References |
|---|---|---|---|---|---|---|
| Deltamethrin and 3-phenoxy benzoic acid | HPLC | 120 µL/plasma | Protein precipitation, followed by drying and reconstitution step | 27 | 30/100 ng/mL | (16) |
| Deltamethrin | GC–MS | 100 µL/plasma, brain | Protein precipitation, followed by drying and reconstitution step | ∼15 | 0.15/0.30 ng/mL | (17) |
| Deltamethrin | HPLC | 65 µL/plasma, brain, liver and kidney | Protein precipitation | 23 | 10/10 ng/mL | (18) |
| 12 synthetic pyrethroids | GC–MS | 1 mL/blood | Liquid–Liquid extraction | ∼75 | 0.2–5/1–20 pg/mL | (20) |
| 13 synthetic pyrethroids | GC–MS | 1 mL/blood | Liquid–Liquid extraction | 80 | 0.05–1/0.1–4 ng/mL | (21) |
| Chlorpyrifos and cypermethrin | LC–MS-MS | 0.3 mL/plasma | Online solid-phase extraction | 7 | 0.01–0.05/0.1 ng/mL | (22) |
| Pyrethroids, organophosphates and carbamates | GC–MS | 2 mL/plasma | Solid-phase extraction | 33 min | 10–158/NA pg/mL | (23) |
| Cypermethrin | GC-ECD | 50 µL diluted up to 2 mL with water/blood 0.5 g tissue homogenized in 5 mL of acetone |
Dispersive Liquid–Liquid Micro Extraction (DLLME) | 15 | Tissue: 0.043–0.314/0.143–1.03 ng/mg Blood: 8.6/28.3 ng/mL |
(24) |
United States Environmental Protection Agency (US EPA) has recommended estimating pyrethroids’ risk using cumulative exposure (25–27). Owing to the possibility of multiple pyrethroid exposure, it is important to understand the toxicokinetics of single or pyrethroid mixtures in preclinical species for improving the risk assessment in humans based on preclinical data. Pyrethroid mixture has shown a dose-additive effect on motor activity in rats (4). Cumulative risk assessment requires a bioanalytical method that is suitable for quantitation of one or several pyrethroids simultaneously in a small sample volume for supporting toxicokinetic studies. Therefore, the objective of the present study was to develop and validate a simple, rapid and sensitive ultraperformance liquid chromatography–tandem mass spectrometry (UPLC–MS-MS) method for the simultaneous determination of pyrethroids (fenvalerate, fenpropathrin, bifenthrin, lambda-cyhalothrin, cyfluthrin, cypermethrin and deltamethrin) in rat plasma (100 µL) for toxicokinetic applications. In this study, we are using the protein precipitation technique that has simplicity of operation, involves low cost and is a highly versatile sample preparation method; on the other hand, it can also be utilized as a green chemistry approach as it reduces the consumption of organic solvents (200 µL/sample). To the best of our knowledge, this is the first UPLC–MS-MS method for the simultaneous determination of seven pyrethroids in a low volume of rat plasma suitable for toxicokinetic applications.
Materials and methods
Chemicals and reagents
Fenvalerate, fenpropathrin, bifenthrin, lambda-cyhalothrin, cyfluthrin, cypermethrin and deltamethrin were purchased from Sigma Aldrich (St Louis, USA). Centchroman (internal standard, IS) was a gift from CSIR-Central Drug Research Institute, Lucknow, India. MS grades of acetonitrile and methanol as well as MS grades of ammonium formate and ammonium acetate were supplied by Sigma Aldrich. Ethylenediaminetetraacetic acid (EDTA) was purchased from Qualigens (Mumbai, India). Sodium fluoride was purchased from Sigma Aldrich. Ultra-pure water was obtained from a Millipore gradient water purification system (Millipore India Pvt Ltd, New Delhi, India). The control drug-free rat plasma samples were collected from adult healthy rats at the animal facility of the CSIR-Indian Institute of Toxicology Research, Lucknow, India. Prior approval from the Institutional Animal Ethics Committee (IAEC) was sought for maintenance, experimental studies, euthanasia and disposal of carcass of animals. These drug-free rat plasma samples were used to make blank and fortified samples containing pyrethroids. Pyrethroids are well known to undergo esterase-mediated hydrolysis (28, 29). Therefore, sodium fluoride (20 mM), a well-known inhibitor of esterase, was added into the rat plasma to prevent the ex vivo metabolism of pyrethroids by esterases (17, 30). The chemical structures of all analytes and the IS are shown in Figure 1.
Figure 1.

Structural representation of pyrethroids and centchroman (IS).
Instrumentation and chromatographic conditions
UPLC system (Acquity—Waters, Milford, MA, USA) consisting of a pump and an autosampler with a temperature-controlled tray was used to inject 7 µL aliquots of the processed samples on Supelco C18 column (4.6 × 50 mm, 5.0 μm). The system was run in isocratic mode with mobile phase consisting of 5 mM ammonium formate and methanol in the ratio of 10 : 90 (v/v). Mobile phase was pumped at a flow rate of 0.6 mL/min, filtered using a 0.22-µm Millipore filter and degassed ultrasonically for 15 min prior to use. Separations were performed at 37°C. Mass spectrometric detection was performed on an API 4000 mass spectrometer (Applied Biosystems/MDS SCIEX, Toronto, Canada) equipped with an electrospray ionization (ESI) source. The ion spray voltage was set at 5,500 V. The specific values for instrument-related parameters such as nebulizer gas, curtain gas, auxiliary gas and collision gas (collisionally activated dissociation) as well as compound-related parameters such as declustering potential, collision energy, entrance potential and collision exit potential are summarized in Table II. The mass spectrometer was operated at ESI positive-ion mode and detection of the ions was performed in the multiple reaction monitoring (MRM) mode. The optimized MRM transition pair details for all analytes and IS are summarized in Table I. Data acquisition and quantitation were performed using the Analyst software (version 1.6).
Table II.
Mass Parameters of Pyrethroids and Centchroman (IS)
| Analytes | Transition pair | DP | CE | CXP | EP | CUR | CAD | GS1 | GS2 |
|---|---|---|---|---|---|---|---|---|---|
| Fenvalerate | 437.7/167.1 | 60 | 26 | 18 | 10 | 12 | 12 | 40 | 40 |
| Fenpropathrin | 367.2/125.2 | 41 | 22 | 8 | |||||
| Bifenthrin | 440.1/181.1 | 46 | 25 | 10 | |||||
| Lambda-cyhalothrin | 467.1/224.7 | 58 | 25 | 11 | |||||
| Cyfluthrin | 451.2/191 | 45 | 20 | 11 | |||||
| Cypermethrin | 433.2/191 | 45 | 21 | 10 | |||||
| Deltamethrin | 522.9/280.7 | 40 | 26 | 13 | |||||
| Centchroman | 458.5/98.1 | 100 | 43 | 13 |
DP, declustering potential; CE, collision energy; CXP, collision exit potential; EP, entrance potential; CUR, curtain gas; CAD, collisionally activated dissociation; GS1, nebulizer gas; GS2, auxiliary gas.
Preparation of stock solutions, calibration standards and quality control samples
Primary stock solutions of fenvalerate, fenpropathrin, bifenthrin, lambda-cyhalothrin, cyfluthrin, cypermethrin, deltamethrin and centchroman (IS) were prepared by dissolving the accurately weighed amount in acetonitrile to get the concentration of 1 mg/mL and stored at −20°C. Working standard solutions of different pyrethroids were prepared by combining the aliquot of each primary stock solution and followed by the dilution with acetonitrile to obtain the concentrations of 100, 10 and 1 µg/mL for all the analytes. A working stock solution of IS (100 µg/mL) was prepared from primary stock solution of 1 mg/mL in acetonitrile. A calibration curve was obtained by spiking the appropriate working standard solution into pooled drug-free rat plasma followed by serial dilution from highest concentration calibration standard (2,000 ng/mL for all the analytes) to lowest concentration calibration standard (7.8 ng/mL for fenpropathrin, bifenthrin, lambda-cyhalothrin, cypermethrin and deltamethrin; 31.3 ng/mL for fenvalerate and cyfluthrin). Quality control (QC) samples were prepared by spiking pooled drug-free rat plasma in bulk at four concentration levels [7.8 ng/mL for fenpropathrin, bifenthrin, lambda-cyhalothrin, cypermethrin and deltamethrin; 31.3 ng/mL for fenvalerate and cyfluthrin (lower limit of quantification, LLOQ), 60 ng/mL (QC low), 200 ng/mL (QC medium) and 1,600 ng/mL (QC high)] and 100 µL volumes were aliquoted into different tubes and stored at −80°C until analysis.
Sample preparation
A simple protein precipitation method was followed for extraction of all the analytes and IS from rat plasma. To 100 µL of plasma aliquot, 200 µL of acetonitrile containing IS (120 ng/mL) was added and mixed for 15 s on a cyclomixer (Spinix Tarsons, Kolkata, India). The mixture was vortexed for 5 min, followed by centrifugation for 10 min at 12,000 rpm on minispin (Eppendorf India Ltd, Chennai, India). An aliquot of 200 µL of organic layer was separated and 7 µL was injected onto analytical column.
Validation procedures
The chromatographic method for quantification of fenvalerate, fenpropathrin, bifenthrin, lambda-cyhalothrin, cyfluthrin, cypermethrin and deltamethrin in rat plasma was validated according to the United States Food and Drug Administration Bioanalytical Method Validation guidance (31). The method was validated for selectivity and specificity, linearity and LLOQ, intra- and inter-day precision as well as accuracy, matrix effect, recovery and stability.
Selectivity and specificity
The lack of visible chromatographic interferences from the endogenous plasma components at the LC peak region for analytes and IS was evaluated by analyzing the individual and pooled blank plasma sample from six different rats using the proposed extraction method and the chromatographic condition.
Calibration curve and LLOQ
Calibration curves consist of a blank sample (plasma sample processed without IS), a zero sample (plasma sample processed with IS) and non-zero samples (plasma fortified with analytes and IS). Calibration curves were constructed by plotting the ratio of peak areas of analytes to those of IS against the nominal concentration of calibration standards. The final concentrations of calibration standards for plotting the calibration curve were 7.8, 15.6, 31.3, 62.5, 125, 250, 500, 1,000 and 2,000 ng/mL for fenpropathrin, bifenthrin, lambda-cyhalothrin, cypermethrin and deltamethrin and, 31.3, 62.5, 125, 250, 500, 1,000 and 2,000 ng/mL for fenvalerate and cyfluthrin. The results obtained were fitted to linear regression analysis using 1/X2 as weighting factor. The acceptance criterion for each back-calculated standard concentration was 15% deviation from the nominal value, except at LLOQ, which was set at 20%. The LLOQ was considered the lowest point of the calibration curve. This gave at least 10 times the response (signal-to-noise ratio ≥10) compared with blank. The limit of detection (LOD) was calculated using the signal-to-noise criterion of 3.
Extraction recovery and matrix effect
The extraction recoveries of fenvalerate, fenpropathrin, bifenthrin, lambda-cyhalothrin, cyfluthrin, cypermethrin and deltamethrin, through the protein precipitation method, were determined at three concentration levels [QC low (60 ng/mL) and QC high (1,600 ng/mL) by comparing the responses of the extracted samples (n = 4) with those of analytes from post-extracted plasma sample at equivalent concentration]. The effect of rat plasma constituents on the ionization (matrix effect) of analytes was determined at QC low and QC high levels by comparing the responses of the post-extraction fortified plasma QC samples (n = 4) with those of analytes from neat samples at equivalent concentrations. Matrix effect and recovery for IS were determined at a single concentration of 120 ng/mL.
Precision and accuracy
The intra-day assay precision and accuracy were estimated by analyzing six replicates at four different QC levels (LLOQ, QC low, QC medium and QC high). The inter-day assay precision and accuracy were determined by analyzing the four different QC samples, six replicates each on three different runs (n = 18). The accuracy data were accepted if the accuracy values were within ±15% deviation (85–115%) from the nominal concentrations, whereas the precision was measured as percentage standard deviation (%RSD) within ±15%, except at LLOQ where it should not exceed ±20% of accuracy (80–120%) as well as precision.
Stability experiments
All stability studies were conducted at two QC levels (QC low and QC high) using four replicates at each QC levels. The stability of analytes in plasma during 1 h exposure at ice (bench top) was determined. Autosampler stability of analytes and IS in injection solvent was determined by injecting the processed QC samples up to 24 h (7°C) after the initial injection. Long-term stability (freezer stability) of analytes in plasma was assessed by analyzing the QC samples stored at −80 ± 10°C for 7 days. The stability of analytes upon repeated freeze/thaw (FT) cycles was determined after the third FT cycle (FT-3). The samples were thawed for 20 min at ice and stored at −80 ± 10°C between each cycle. Stability samples were considered to be stable if assay values were within the acceptable limits of accuracy (i.e., ±15% deviation) and precision (i.e., 15% RSD) when compared with freshly prepared QC samples.
Toxicokinetic study of cypermethrin in rats
The rat in vivo oral toxicokinetic study of cypermethrin was performed to show the applicability of a newly developed and validated bioanalytical method. The study was performed in male Wistar rats (n = 4, weight range 200–220 g). Cypermethrin was administered orally at a dose of 5 mg/kg as suspension. Blood samples were collected from the retro-orbital plexus of rats into microfuge tubes containing EDTA (anticoagulant) and sodium fluoride (esterase inhibitor, 20 mM) at 0.5, 1.0, 2.0, 4.0, 6.0, 8.0 and 24.0 h post-dosing and immediately centrifuged at 12,000 rpm for 10 min. Plasma was separated and stored frozen at −80 ± 10°C until analysis. Plasma (100 µL) samples were fortified with IS, and processed as described above. Along with the plasma samples, QC samples were distributed among calibrators and unknown samples in the analytical run. The data were accepted based on the performance of QCs prepared using rat blank plasma. Plasma concentration–time data of cypermethrin was analyzed by the non-compartmental method using WinNonlin Version 5.1 (Pharsight Corporation, Mountain View, CA, USA).
Results and discussion
Optimization of UPLC–MS-MS condition and sample preparation
Chromatographic conditions, mass-related parameters and sample preparation technique were optimized to develop a simple, sensitive and high-throughput assay method for quantitation of fenvalerate, fenpropathrin, bifenthrin, lambda-cyhalothrin, cyfluthrin, cypermethrin, deltamethrin and IS in rat plasma. To develop a simple, rapid and high-throughput method, a protein precipitation procedure was adopted and different solvents such as methanol and acetonitrile were screened. Out of these two solvents, acetonitrile was found to provide adequate and reproducible recovery, clean and interference-free extract after the single-step protein precipitation in rat plasma for all the analytes and IS. Different columns and different mobile phase compositions were tested to develop sensitive, robust and shorter bioanalytical method. Different mobile phases such as ammonium acetate and ammonium formate were tested with different percentages of methanol or acetonitrile as organic modifiers. Supelco C18 column (4.6 × 50 mm, 5.0 μm) and methanol and ammonium formate (5 mM) in a ratio of 90 : 10 (v/v) as mobile phase (isocratic mode, flow rate: 0.6 mL/min) provided suitable sensitivity, peak shape, shorter chromatographic run time and reproducible response for all the analytes and IS. The total run time of the method was 5 min.
Mass spectroscopic parameters of the seven synthetic pyrethroids (fenvalerate, fenpropathrin, bifenthrin, lambda-cyhalothrin, cyfluthrin, cypermethrin and deltamethrin) and centchroman (IS) were optimized by infusing standard analyte solution (100 ng/mL) prepared in 10% ammonium formate (5 mM) in methanol into the mass spectrometer. For optimization of ESI conditions for all the analytes and IS, quadrupole full scans were carried out in both negative- and positive-ion modes. Positive-ion detection mode was found suitable for all the analytes and IS. The full scan mass spectra of pyrethroids revealed peaks as ammonium adduct [M+NH4]+ at m/z 437.1, 367.2, 440.1, 462.2, 451.2, 433.2 and 522.9 for fenvalerate, fenpropathrin, bifenthrin, lambda-cyhalothrin, cyfluthrin, cypermethrin and deltamethrin, respectively, and m/z 458.5 for IS as single protonated ions [M+H]+. Upon product ion scan (MS2 scan), the product ions qualified for monitoring were 167.1 and 208.2 for fenvalerate, 125.2 and 208.1 for fenpropathrin, 181.1 and 197.7 for bifenthrin, 224.7 and 423.1 for lambda-cyhalothrin, 191 and 217.4 for cyfluthrin, 191 and 154.8 for cypermethrin, 280.7 and 253 for deltamethrin and 98.1 and 119.1 for IS. Following optimization of MRM mass spectrometry conditions based on the better baseline and sensitivity, the precursor ion → product of m/z 437.1 → 167.1 for fenvalerate, m/z 367.21 → 125.2 for fenpropathrin, m/z 440.1 → 181.1 for bifenthrin, m/z 462.1 → 224.7 for lambda-cyhalothrin, m/z 451.2 → 191 for cyfluthrin, m/z 433.21 → 191 for cypermethrin, m/z 522.9 → 280.7 for deltamethrin and m/z 458.5 → 98.1 for IS were used for the quantitation purpose. Although the selected IS centchroman did not form ammonium adducts as the pyrethroids, it was still chosen as the IS for this study based on its consistent recovery and negligible matrix effect while using the protein precipitation extraction procedure. Additionally, centchroman was eluted closely to other pyrethroids (Figure 2), which makes it suitable as an IS to develop a hyphenated method for pyrethroids.
Figure 2.

Typical MRM chromatograms of blank plasma (B, right column) and plasma fortified at LLOQ (A, left column) for all the analytes (7.8 ng/mL for fenpropathrin, bifenthrin, lambda-cyhalothrin, cypermethrin and deltamethrin; 31.3 ng/mL for fenvalerate and cyfluthrin) and 120 ng/mL for centchroman (IS). This figure is available in black and white in print and in color at JAT online.
Selectivity and specificity
No interfering peaks were observed at the retention times for either analytes (fenvalerate, 2.54 min; fenpropathrin, 2.22 min; bifenthrin, 4.10 min; lambda-cyhalothrin, 2.04 min; cyfluthrin, 2.12 min; cypermethrin, 2.34 min; deltamethrin, 2.45 min) or IS (centchroman, 2.21 min). Figure 2 shows the typical chromatograms of blank plasma (right column) and plasma fortified at LLOQ (left column) for all the analytes (7.8 ng/mL for fenpropathrin, bifenthrin, lambda-cyhalothrin, cypermethrin and deltamethrin, and 31.3 ng/mL for fenvalerate and cyfluthrin) and 120 ng/mL for IS.
Calibration curves, LLOQ and LOD
The calibration curves were prepared by determining the best fit of peak area ratios (peak area analyte/peak area IS) versus concentrations and fitted to the y = mx + c using different weighing factors (1/X, 1/Y, 1/X2 and 1/Y2). The weighing factor of 1/X2 was found to be most appropriate in the selected linearity range. The method was linear over the concentration range of 7.8–2,000 ng/mL for fenpropathrin, bifenthrin, lambda-cyhalothrin, cypermethrin and deltamethrin, and 31.3–2,000 ng/mL for fenvalerate and cyfluthrin. The average correlation coefficient (r, n = 3) was found to be ≥0.995. The LLOQ was defined as the lowest point on the calibration curve, which gave at least five times the response compared with blank with acceptable precision and accuracy. The % accuracy observed for the mean of back-calculated concentrations for three calibration curves was within 90.3–109.0, whereas the precision (% RSD) values ranged from 0.9 to 13.4. The LOD values for fenvalerate, fenpropathrin, bifenthrin, lambda-cyhalothrin, cyfluthrin, cypermethrin and deltamethrin were found to be 7.8, 0.2, 2.0, 3.9, 7.8, 2.0 and 2.0 ng/mL, respectively.
Extraction recovery and matrix effect
The extraction recovery was determined by comparing the responses of pre-fortified plasma samples at two concentration levels, i.e., QC low and QC high levels (n = 4) with those of post-extracted blank plasma samples fortified at equivalent concentration. The mean extraction recoveries (n = 4) of all the analytes ranged from 72.1 to 105.2% (Table III), and the mean extraction recovery of the IS was 88.8%.
Table III.
Extraction Recovery and Matrix Effect for the Pyrethroids in Rat Plasma
| Analytes | Concentration added (ng/mL) | Extraction recovery |
Matrix effect |
||
|---|---|---|---|---|---|
| Valuea (%) | RSDb (%) | Valuea (%) | RSDb (%) | ||
| Fenvalerate | 60.0 | 74.58 ± 9.68 | 13.0 | 91.6 ± 8.69 | 9.5 |
| 1600.0 | 75.53 ± 4.88 | 6.5 | 102.2 ± 3.17 | 3.1 | |
| Fenpropathrin | 60.0 | 88.91 ± 13.01 | 14.6 | 93.1 ± 10.13 | 10.9 |
| 1600.0 | 88.0 ± 8.62 | 9.8 | 91.1 ± 6.45 | 7.1 | |
| Bifenthrin | 60.0 | 105.2 ± 14.15 | 13.5 | 104.6 ± 1.34 | 1.3 |
| 1600.0 | 106.8 ± 7.96 | 7.4 | 112.8 ± 10.78 | 9.6 | |
| Lambda-cyhalothrin | 60.0 | 74.26 ± 9.07 | 12.2 | 85.0 ± 8.08 | 9.5 |
| 1600.0 | 80.15 ± 4.22 | 5.3 | 88.6 ± 6.56 | 7.4 | |
| Cyfluthrin | 60.0 | 72.10 ± 8.31 | 11.5 | 91.6 ± 3.54 | 3.9 |
| 1600.0 | 73.64 ± 7.78 | 10.6 | 103.1 ± 7.25 | 7.0 | |
| Cypermethrin | 60.0 | 96.19 ± 7.45 | 7.7 | 89.2 ± 5.84 | 6.5 |
| 1600.0 | 89.69 ± 4.61 | 5.1 | 98.5 ± 10.26 | 10.4 | |
| Deltamethrin | 60.0 | 81.77 ± 8.28 | 10.1 | 97.1 ± 5.74 | 5.9 |
| 1600.0 | 81.75 ± 2.89 | 3.5 | 104.6 ± 6.78 | 6.5 | |
aData are expressed as mean ± SD (n = 4).
bRSD (%) = (SD/mean) × 100.
In preliminary studies, the matrix effect in different mobile phases and columns was investigated during method optimization. Least matrix effect was seen with the Supelco C18 column and 5 mM ammonium formate and methanol in the ratio of 10 : 90 v/v as mobile phase. The matrix effect was assessed at two concentrations, i.e., QC low and QC high (n = 4). The average matrix effect (ion suppression or enhancement) by plasma constituents was <15% for all the analytes and IS (Table III).
Precision and accuracy
The intra- and inter-day precision and accuracy data of all the analytes are presented in Table IV. The % RSD values of the precision of the intra- and inter-day validation were <9.4 and 9.6%, respectively. The accuracy values of the intra- and inter-day validation were 90.5–110.2 and 92.6–106.9%, respectively. The precision and accuracy values on both the occasions (intra- and inter-day) were found to be within the accepted variable limits.
Table IV.
Intra- and Inter-Day Assay Precision and Accuracy for Pyrethroids in Rat Plasma
| Analytes | Concentration added (ng/mL) | Intra-day (n = 6) |
Inter-day (n = 18) |
||||
|---|---|---|---|---|---|---|---|
| Concentration found (mean ± SD; ng/mL) | % Accuracya | % Precisionb | Concentration found (mean ± SD; ng/mL) | % Accuracya | % Precisionb | ||
| Fenvalerate | 31.3 | 31.43 ± 2.76 | 100.6 | 8.8 | 32.3 ± 2.40 | 103.5 | 7.4 |
| 60.0 | 56.1 ± 4.78 | 93.5 | 8.5 | 55.5 ± 4.22 | 92.6 | 7.6 | |
| 200.0 | 217.7 ± 10.97 | 108.8 | 5.1 | 210.9 ± 15.24 | 105.5 | 7.2 | |
| 1600.0 | 1711.7 ± 101.67 | 107.0 | 5.9 | 1676.1 ± 114.39 | 104.8 | 6.8 | |
| Fenpropathrin | 7.8 | 7.6 ± 0.66 | 97.5 | 8.6 | 7.5 ± 0.66 | 96.0 | 8.8 |
| 60.0 | 64.9 ± 3.39 | 108.1 | 5.2 | 61.7 ± 5.34 | 102.2 | 8.7 | |
| 200.0 | 212.0 ± 9.25 | 106.0 | 4.4 | 211.8 ± 14.37 | 105.9 | 6.8 | |
| 1600.0 | 1471.7 ± 49.56 | 92.0 | 3.4 | 1525.8 ± 79.14 | 95.4 | 5.2 | |
| Bifenthrin | 7.8 | 7.8 ± 0.31 | 99.4 | 4.0 | 7.9 ± 0.76 | 101.2 | 9.6 |
| 60.0 | 59.6 ± 2.65 | 99.3 | 4.4 | 59.0 ± 4.18 | 98.2 | 7.1 | |
| 200.0 | 188.5 ± 16.44 | 94.3 | 8.7 | 188.6 ± 14.48 | 94.3 | 7.7 | |
| 1600.0 | 1448.3 ± 54.92 | 90.5 | 3.8 | 1543.1 ± 125.84 | 96.4 | 8.2 | |
| Lambda-cyhalothrin | 7.8 | 8.3 ± 0.28 | 106.2 | 3.4 | 8.0 ± 0.61 | 102.5 | 7.6 |
| 60.0 | 61.3 ± 4.92 | 102.1 | 8.0 | 59.3 ± 4.97 | 98.9 | 8.4 | |
| 200.0 | 203.3 ± 14.29 | 101.7 | 7.0 | 200.2 ± 15.43 | 100.1 | 7.7 | |
| 1600.0 | 1495.0 ± 74.77 | 93.4 | 5.0 | 1626.3 ± 146.19 | 101.6 | 9.0 | |
| Cyfluthrin | 31.3 | 32.2 ± 1.51 | 103.0 | 4.7 | 33.1 ± 2.14 | 106.1 | 6.4 |
| 60.0 | 61.1 ± 3.32 | 101.9 | 5.4 | 62.0 ± 4.47 | 103.5 | 7.2 | |
| 200.0 | 208.8 ± 13.44 | 104.4 | 6.4 | 207.1 ± 10.39 | 103.5 | 5.0 | |
| 1600.0 | 1475.0 ± 78.68 | 92.2 | 5.3 | 1540.0 ± 80.91 | 96.3 | 5.3 | |
| Cypermethrin | 7.8 | 7.4 ± 0.40 | 95.1 | 5.3 | 7.8 ± 0.52 | 99.5 | 6.7 |
| 60.0 | 62.0 ± 3.00 | 103.3 | 4.8 | 60.3 ± 4.29 | 100.2 | 7.1 | |
| 200.0 | 218.4 ± 13.07 | 109.2 | 6.0 | 209.9 ± 14.64 | 105.0 | 7.0 | |
| 1600.0 | 1600.0 ± 78.74 | 100.0 | 4.9 | 1611.1 ± 80.80 | 100.7 | 5.0 | |
| Deltamethrin | 7.8 | 7.4 ± 0.70 | 95.3 | 9.4 | 7.9 ± 0.65 | 94.1 | 8.2 |
| 60.0 | 61.8 ± 2.15 | 103.0 | 3.5 | 59.3 ± 4.50 | 98.4 | 7.6 | |
| 200.0 | 220.3 ± 110.2 | 110.2 | 5.5 | 213.0 ± 16.73 | 106.5 | 7.9 | |
| 1600.0 | 1745.0 ± 86.20 | 109.1 | 4.9 | 1710.6 ± 125.03 | 106.9 | 7.3 | |
aCalculated as (mean determined concentration/nominal concentration) × 100.
bExpressed as RSD (%) = (SD/mean) × 100.
Stability
The stability of all the analytes at two concentration levels, i.e., QC low and QC high under different storage conditions such as autosampler stability (24 h at 7°C), bench top stability (BT, 1 h at ice), three FT cycles (FT-3 at −80 ± 10°C) and short-term stability (7 days at −80 ± 10°C) are presented in Table V. All the analytes were found stable with the accuracies (%) and precision (%RSD) ranging 88.8–107.0 and 1.10–11.77, respectively. This information provides the confidence that there will not be stability issues during routine toxicokinetic studies of pyrethroids under these tested circumstances.
Table V.
Stability of Pyrethroids in Rat Plasma
| Analytes | Concentration added (ng/mL) | Concentration found (ng/mL; mean ± SD; n = 4) |
|||
|---|---|---|---|---|---|
| Autosampler stability (24 h) | Bench top stability (1 h, at ice) | Freeze–thaw stability (three cycles) | Short-term stability (7 days) | ||
| Fenvalerate | 60.0 | 61.5 ± 7.24 | 62.7 ± 8.33 | 56.4 ± 4.53 | 57.4 ± 4.64 |
| 1600.0 | 1533.3 ± 90.74 | 1576.7 ± 75.72 | 1612.5 ± 113.54 | 1585.0 ± 187.71 | |
| Fenpropathrin | 60.0 | 56.3 ± 5.72 | 58.2 ± 6.61 | 53.3 ± 1.51 | 59.0 ± 5.09 |
| 1600.0 | 1523.4 ± 133.41 | 1519.0 ± 45.21 | 1503.2 ± 132.10 | 1547.5 ± 86.17 | |
| Bifenthrin | 60.0 | 55.9 ± 2.42 | 62.6 ± 5.16 | 53.5 ± 2.10 | 57.2 ± 3.66 |
| 1600.0 | 1682.5 ± 104.04 | 1632.5 ± 63.97 | 1640.0 ± 125.70 | 1644.0 ± 153.39 | |
| Lambda-cyhalothrin | 60.0 | 57.2 ± 5.02 | 61.3 ± 5.42 | 60.8 ± 5.49 | 56.4 ± 5.42 |
| 1600.0 | 1567.0 ± 97.69 | 1540.0 ± 54.77 | 1557.5 ± 17.08 | 1527.5 ± 51.88 | |
| Cyfluthrin | 60.0 | 62.7 ± 8.33 | 62.4 ± 4.95 | 59.8 ± 6.01 | 59.4 ± 6.51 |
| 1600.0 | 1533.3 ± 90.74 | 1540.0 ± 83.67 | 1525.0 ± 91.47 | 1597.0 ± 56.42 | |
| Cypermethrin | 60.0 | 58.2 ± 4.45 | 59.8 ± 5.33 | 60.2 ± 4.13 | 56.6 ± 2.51 |
| 1600.0 | 1487.5 ± 63.44 | 1512.0 ± 48.68 | 1547.5 ± 59.09 | 1712.5 ± 123.12 | |
| Deltamethrin | 60.0 | 60.2 ± 5.65 | 58.8 ± 6.25 | 57.3 ± 4.27 | 61.2 ± 5.30 |
| 1600.0 | 1537.2 ± 107.56 | 1555.0 ± 123.96 | 1502.5 ± 135.98 | 1627.5 ± 57.37 | |
However, initially we tested BT (for 2 h) of all the analytes at room temperature and on ice. Except fenpropathrin and bifenthrin upon storage at ice and bifenthrin at room temperature, all the analytes were found unstable at these tested conditions. Therefore, we conducted BT for 1 h over ice, where all the analytes showed stability within the acceptable limits.
Toxicokinetic study of cypermethrin in rats
The rat plasma samples generated following oral administration of cypermethrin were analyzed by the newly developed and validated method along with QC samples. All the QCs met the acceptance criteria (data not shown). The sensitivity and specificity of the assay was found to be sufficient for accurately characterizing the toxicokinetics of cypermethrin in rats. Figure 3 shows the mean plasma concentration vs. time profile of cypermethrin in rats. Maximum concentration in plasma (Cmax 2,690 ± 84.8 ng/mL) was achieved at 1 h (tmax). The half-life (t1/2) of cypermethrin was 8.2 ± 1.4 h, while the AUC (0−t) was 8909.1 ± 370.1 ng h/mL.
Figure 3.
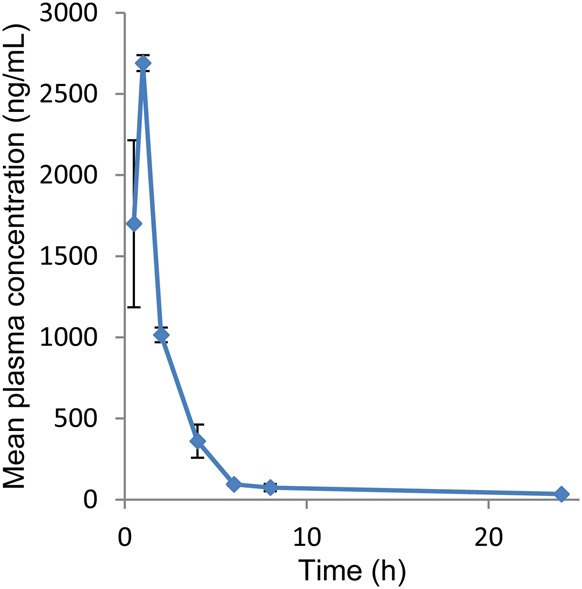
Mean plasma concentration–time profile of cypermethrin in rat plasma following oral administration of cypermethrin in male Wistar rats (mean ± SD, n = 4). This figure is available in black and white in print and in color at JAT online.
Conclusion
To the best of our knowledge, this is the first UPLC–MS-MS method for the simultaneous determination of seven pyrethroids in a small volume (100 µL) of rat plasma. The method utilized the single-step protein precipitation using acetonitrile as the sample preparation technique. This method offers shorter analysis time with a single run taking only 5 min. This method was successfully applied for toxicokinetic study of cypermethrin in rats. The application of this method with minimal changes can also be extended to forensic and clinical toxicology laboratories due to its simplicity and rapidness.
Funding
This research was supported by financial assistance from the Council of Scientific and Industrial Research, India (CSIR-INDEPTH BSC-0111).
Acknowledgments
We are thankful to Director, CSIR-IITR, for his constant encouragement and support. CSIR-IITR communication number for this manuscript is 3305.
References
- 1.Adamis Z., Antal A., Fuzesi I., Molnar J., Nagy L., Susan M. (1985) Occupational exposure to organophosphorus insecticides and synthetic pyrethroid. International Archives of Occupational and Environmental Health, 56, 299–305. [DOI] [PubMed] [Google Scholar]
- 2.Shafer T.J., Meyer D.A., Crofton K.M. (2005) Developmental neurotoxicity of pyrethroid insecticides: critical review and future research needs. Environmental Health Perspectives, 113, 123–136. [DOI] [PMC free article] [PubMed] [Google Scholar]
- 3.Weichenthal S., Moase C., Chan P. (2010) A review of pesticide exposure and cancer incidence in the Agricultural Health Study cohort. Environmental Health Perspectives, 118, 1117–1125. [DOI] [PMC free article] [PubMed] [Google Scholar]
- 4.Wolansky M.J., Gennings C., DeVito M.J., Crofton K.M. (2009) Evidence for dose-additive effects of pyrethroids on motor activity in rats. Environmental Health Perspectives, 117, 1563–1570. [DOI] [PMC free article] [PubMed] [Google Scholar]
- 5.Aldridge W.N. (1990) An assessment of the toxicological properties of pyrethroids and their neurotoxicity. Critical Reviews in Toxicology, 21, 89–104. [DOI] [PubMed] [Google Scholar]
- 6.Halstead N.T., Civitello D.J., Rohr J.R. (2015) Comparative toxicities of organophosphate and pyrethroid insecticides to aquatic macroarthropods. Chemosphere, 135, 265–271. [DOI] [PubMed] [Google Scholar]
- 7.Chen Z.M., Wang Y.H. (1996) Chromatographic methods for the determination of pyrethrin and pyrethroid pesticide residues in crops, foods and environmental samples. Journal of Chromatography A, 754, 367–395. [DOI] [PubMed] [Google Scholar]
- 8.Bateman D.N. (2000) Management of pyrethroid exposure. Journal of Toxicology: Clinical Toxicology, 38, 107–109. [DOI] [PubMed] [Google Scholar]
- 9.Toan P.V., Sebesvari Z., Blasing M., Rosendahl I., Renaud F.G. (2013) Pesticide management and their residues in sediments and surface and drinking water in the Mekong Delta, Vietnam. Science of the Total Environment, 452–453, 28–39. [DOI] [PubMed] [Google Scholar]
- 10.Barton H.A., Pastoor T.P., Baetcke K., Chambers J.E., Diliberto J., Doerrer N.G. et al. (2006) The acquisition and application of absorption, distribution, metabolism, and excretion (ADME) data in agricultural chemical safety assessments. Critical Reviews in Toxicology, 36, 9–35. [DOI] [PubMed] [Google Scholar]
- 11.Boonchiangma S., Ngeontae W., Srijaranai S. (2012) Determination of six pyrethroid insecticides in fruit juice samples using dispersive liquid-liquid microextraction combined with high performance liquid chromatography. Talanta, 88, 209–215. [DOI] [PubMed] [Google Scholar]
- 12.Feo M.L., Eljarrat E., Barcelo D. (2010) A rapid and sensitive analytical method for the determination of 14 pyrethroids in water samples. Journal of Chromatography A, 1217, 2248–2253. [DOI] [PubMed] [Google Scholar]
- 13.Gil-Garcia M.D., Barranco-Martinez D., Martinez-Galera M., Parrilla-Vazquez P. (2006) Simple, rapid solid-phase extraction procedure for the determination of ultra-trace levels of pyrethroids in ground and sea water by liquid chromatography/electrospray ionization mass spectroscopy. Rapid Communications in Mass Spectrometry, 20, 2395–2403. [DOI] [PubMed] [Google Scholar]
- 14.Garcia-Reyes J.F., Gilbert-Lopez B., Molina-Diaz A., Fernandez-Alba A.R. (2008) Determination of pesticide residues in fruit-based soft drinks. Analytical Chemistry, 80, 8966–8974. [DOI] [PubMed] [Google Scholar]
- 15.Hunter R.E. Jr, Riederer A.M., Ryan P.B. (2010) Method for the determination of organophosphorus and pyrethroid pesticides in food via gas chromatography with electron-capture detection. Journal of Agricultural and Food Chemistry, 58, 1396–1402. [DOI] [PubMed] [Google Scholar]
- 16.Ding Y., White C.A., Muralidhara S., Bruckner J.V., Bartlett M.G. (2004) Determination of deltamethrin and its metabolite 3-phenoxybenzoic acid in male rat plasma by high-performance liquid chromatography. Journal of Chromatography B, 810, 221–227. [DOI] [PubMed] [Google Scholar]
- 17.Gullick D., Popovici A., Young H.C., Bruckner J.V., Cummings B.S., Li P. et al. (2014) Determination of deltamethrin in rat plasma and brain using gas chromatography-negative chemical ionization mass spectrometry. Journal of Chromatography B, 960, 158–165. [DOI] [PubMed] [Google Scholar]
- 18.Kim K.B., Bartlett M.G., Anand S.S., Bruckner J.V., Kim H.J. (2006) Rapid determination of the synthetic pyrethroid insecticide, deltamethrin, in rat plasma and tissues by HPLC. Journal of Chromatography B, 834, 141–148. [DOI] [PubMed] [Google Scholar]
- 19.Leng G., Kuhn K.H., Idel H. (1997) Biological monitoring of pyrethroids in blood and pyrethroid metabolites in urine: applications and limitations. Science of the Total Environment, 199, 173–181. [DOI] [PubMed] [Google Scholar]
- 20.Ramesh A., Ravi P.E. (2004) Negative ion chemical ionization-gas chromatographic-mass spectrometric determination of residues of different pyrethroid insecticides in whole blood and serum. Journal of Analytical Toxicology, 28, 660–666. [DOI] [PubMed] [Google Scholar]
- 21.Ramesh A., Ravi P.E. (2004) Electron ionization gas chromatography-mass spectrometric determination of residues of thirteen pyrethroid insecticides in whole blood. Journal of Chromatography B, 802, 371–376. [DOI] [PubMed] [Google Scholar]
- 22.Liao H.T., Hsieh C.J., Chiang S.Y., Lin M.H., Chen P.C., Wu K.Y. (2011) Simultaneous analysis of chlorpyrifos and cypermethrin in cord blood plasma by online solid-phase extraction coupled with liquid chromatography-heated electrospray ionization tandem mass spectrometry. Journal of Chromatography B, 879, 1961–1966. [DOI] [PubMed] [Google Scholar]
- 23.Perez J.J., Williams M.K., Weerasekera G., Smith K., Whyatt R.M., Needham L.L. et al. (2010) Measurement of pyrethroid, organophosphorus, and carbamate insecticides in human plasma using isotope dilution gas chromatography-high resolution mass spectrometry. Journal of Chromatography B, 878, 2554–2562. [DOI] [PMC free article] [PubMed] [Google Scholar]
- 24.Mudiam M.K., Jain R., Maurya S.K., Khan H.A., Bandyopadhyay S., Murthy R.C. (2012) Low density solvent based dispersive liquid-liquid microextraction with gas chromatography-electron capture detection for the determination of cypermethrin in tissues and blood of cypermethrin treated rats. Journal of Chromatography B, 895–896, 65–70. [DOI] [PubMed] [Google Scholar]
- 25.U.S. Environmental Protection Agency. (2000). Supplementary Guidance for Conducting Health Risk Assessment of Chemical Mixtures. http://cfpub.epa.gov/ncea/cfm/recordisplay.cfm?deid=20533 (accessed July 2015). [Google Scholar]
- 26.U.S. Environmental Protection Agency. (2002) Guidance on cumulative risk assessment of pesticide chemicals that have a common mechanism of toxicity. http://www2.epa.gov/pesticide-science-and-assessing-pesticide-risks/guidance-cumulative-risk-assessment-pesticide (accessed July 2015). [Google Scholar]
- 27.Soderlund D.M., Clark J.M., Sheets L.P., Mullin L.S., Piccirillo V.J., Sargent D. et al. (2002) Mechanisms of pyrethroid neurotoxicity: implications for cumulative risk assessment. Toxicology, 171, 3–59. [DOI] [PubMed] [Google Scholar]
- 28.Crow J.A., Borazjani A., Potter P.M., Ross M.K. (2007) Hydrolysis of pyrethroids by human and rat tissues: examination of intestinal, liver and serum carboxylesterases. Toxicology and Applied Pharmacology, 221, 1–12. [DOI] [PMC free article] [PubMed] [Google Scholar]
- 29.Godin S.J., Crow J.A., Scollon E.J., Hughes M.F., DeVito M.J., Ross M.K. (2007) Identification of rat and human cytochrome p450 isoforms and a rat serum esterase that metabolize the pyrethroid insecticides deltamethrin and esfenvalerate. Drug Metabolism and Disposition, 35, 1664–1671. [DOI] [PubMed] [Google Scholar]
- 30.Tsujikawa K., Kuwayama K., Miyaguchi H., Kanamori T., Iwata Y.T., Inoue H. (2009) In vitro stability and metabolism of salvinorin A in rat plasma. Xenobiotica, 39, 391–398. [DOI] [PubMed] [Google Scholar]
- 31.Guidance for Industry, Bioanalytical Method Validation. (May 2001) US Department of Health and Human Services Food and Drug Administration, Center for Drug Evaluation and Research (CDER), Center for Veterinary Medicine (CVM).