Abstract.
Channelized Hotelling observer (CHO) models have been shown to correlate well with human observers for several phantom-based detection/classification tasks in clinical computed tomography (CT). A large number of repeated scans were used to achieve an accurate estimate of the model’s template. The purpose of this study is to investigate how the experimental and CHO model parameters affect the minimum required number of repeated scans. A phantom containing 21 low-contrast objects was scanned on a 128-slice CT scanner at three dose levels. Each scan was repeated 100 times. For each experimental configuration, the low-contrast detectability, quantified as the area under receiver operating characteristic curve, , was calculated using a previously validated CHO with randomly selected subsets of scans, ranging from 10 to 100. Using from the 100 scans as the reference, the accuracy from a smaller number of scans was determined. Our results demonstrated that the minimum number of repeated scans increased when the radiation dose level decreased, object size and contrast level decreased, and the number of channels increased. As a general trend, it increased as the low-contrast detectability decreased. This study provides a basis for the experimental design of task-based image quality assessment in clinical CT using CHO.
Keywords: computed tomography, task-based image quality assessment, model observer, channelized Hotelling observer, radiation dose reduction
1. Introduction
Task-based image quality metrics derived from model observers predicated on statistical decision theory were proposed decades ago for assessing medical image quality.1–3 These metrics have been shown capable of providing comprehensive, objective, and quantitative measurement of image quality for computed tomography (CT) images reconstructed by both linear analytical and nonlinear iterative reconstruction (IR) methods.4–6 Among numerous observer models, the channelized Hotelling observer (CHO) expressed in the spatial domain has been demonstrated to successfully correlate with human observer performance for specific diagnostic tasks.1,4
In previous studies, we have evaluated the performance of CHO models in phantom-based detection/classification tasks using images from real CT scans.5,7,8 These tasks included a 2-alternative forced choice (2AFC) lesion detection task,5 a lesion detection and localization task,7 and a shape discrimination task to differentiate a round and hexagonal shapes.8 CHO and human observer performance were highly correlated in each of these tasks. To estimate the statistics under both conditions (i.e., signal present and signal absent/background) and to yield accurate observer performance, scans for each CT image acquisition condition were repeated a large number of times. This approach of large sampling has also been adopted by other investigators to evaluate the quality of IR reconstructed images.9
In all of these previous studies, the number of repeated scans was chosen without explicit evaluation of its impact on the accuracy of the CHO’s estimated performance. Theoretically, the bias of the CHO’s figure of merit (FOM) can be reduced to be arbitrarily small by increasing the number of repeated scans.10 For computer simulation experiments, this can be readily achieved by simply generating a large number of images, given sufficient computing time and power. For the evaluation of “real” clinical CT images, however, it is impractical to arbitrarily increase the number of repeated scans and oversample each condition. Therefore, it is desirable to understand the relationship between the number of repeated scans and the accuracy of a CHO such that the minimum number of scans can be selected without sacrificing performance accuracy.11 This is extremely important if the CHO-based methods are to be used in routine quality control testing.
The purpose of this study was to investigate the minimum number of repeated scans necessary for accurate estimate of performance by CHO as a function of object size and contrast, reconstruction method, radiation dose, and channel filters in a phantom with homogenous background. These results are expected to provide a basis for experimental design of CHO-based image quality assessment of clinical CT exams.
2. Methods and Materials
2.1. Experimental Setup
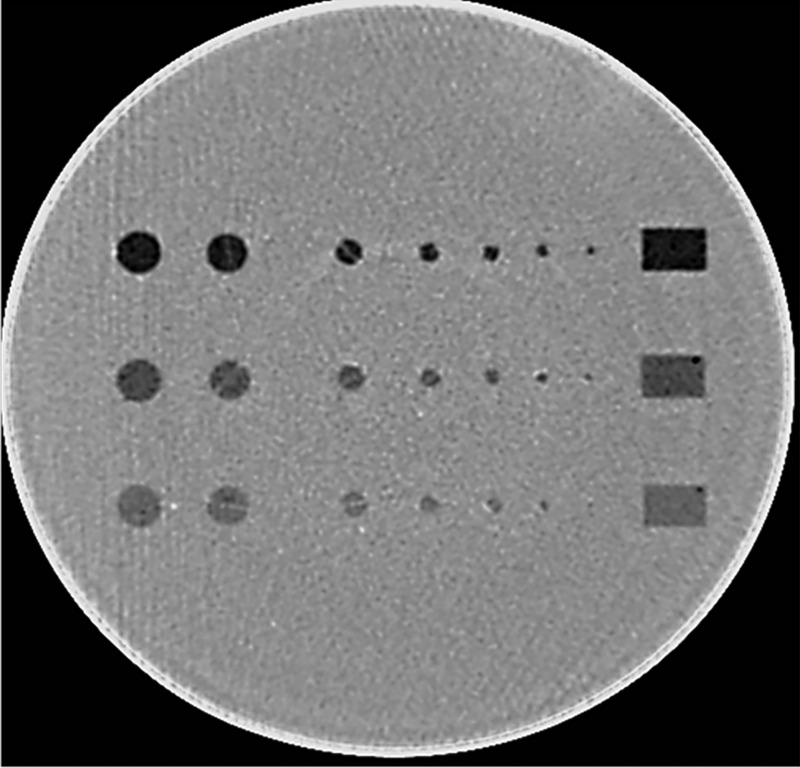
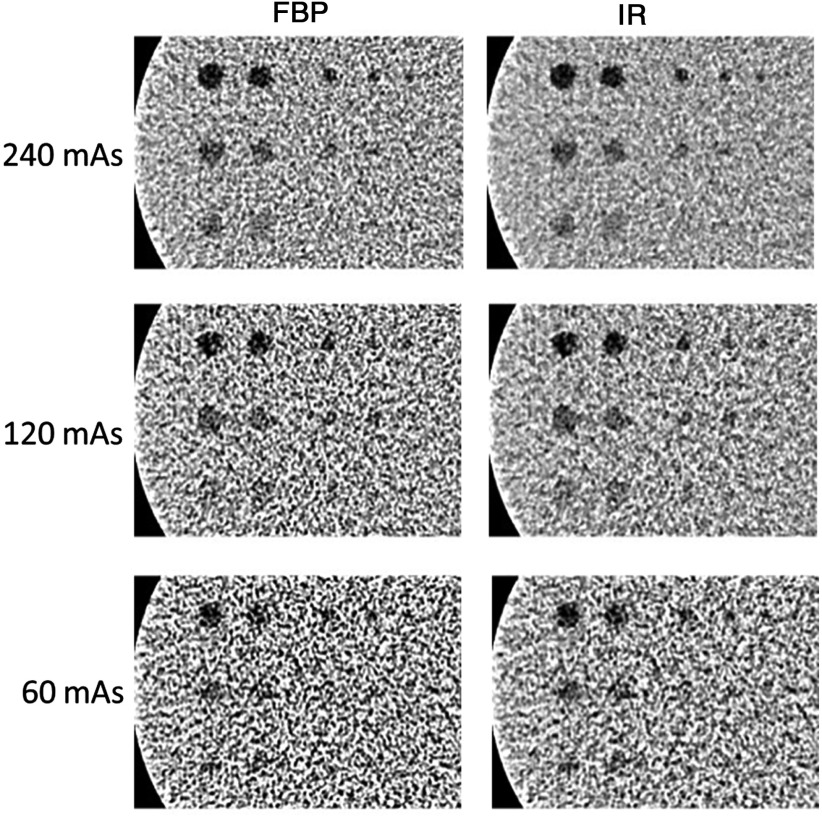
A cylindrical phantom (Helical CT Phantom, CIRS Inc.) was scanned on a dual-source 128-slice CT scanner (Definition Flash, Siemens Healthcare) using only the primary x-ray tube. The phantom has a diameter of 18 cm and a length of 4 cm and contains three groups of low-contrast objects with different contrast levels (measured values: , and below the liver equivalent background) that embedded in homogenous background material. Each group has six spheres and two rods, with one of the rods positioned parallel and the other perpendicular to the longitudinal axis of the phantom. These objects show seven disks and one rectangular box in a cross-sectional image (Fig. 1). The diameters of the seven disks were 10, 9.5, 6.3, 4.8, 4, 3.2, and 2.4 mm, respectively. The scanning parameters were as follows: 120 kV, detector collimation with the -flying focal spot, rotation time of 0.5 s, and helical pitch of 0.8. Three tube current settings were used: 240, 120, and 60 effective mAs (mAs/pitch), which correspond to volume CT dose index () values of 16, 8, and 4 mGy, respectively. The automatic exposure control system was disabled for all image acquisitions since the phantom is a cylinder. Scans at each dose level were repeated 100 times. Images were reconstructed with a 1-mm slice thickness and 0.8-mm slice interval using two different reconstruction methods, filtered-back projection (FBP) with a convolution kernel of B40 and IR (SAFIRE, Sinogram Affirmed Iterative Reconstruction, Siemens Healthcare) with a convolution kernel of I40 and a strength setting of 3 (on a scale of 1 to 5, with 1 being the least amount of noise reduction and 5 the most). Example images reconstructed by FBP and IR methods at each of the three dose levels are shown in Fig. 2.
Fig. 1.
A phantom with three groups of low-contrast inserts (, and ), each with seven disks of different sizes (diameters: 10, 9.5, 6.3, 4.8, 4, 3.2, and 2.4 mm).
Fig. 2.
Sample CT images of low-contrast inserts at three different dose levels with FBP and IR reconstructions.
2.2. Use of Channelized Hotelling Observer to Calculate Low-Contrast Detectability
A CHO model previously validated through a 2AFC low-contrast detection task5 was used to determine the low-contrast detectability for each object at each dose level. The general form of the test statistics for a CHO is expressed as ,12 where is the channelized test image and is the template, which is defined as: , where is the channel output of intraclass scatter matrix; and are the mean channelized images under the signal present and absent conditions, respectively. and are the mean original images under the signal present and absent conditions, respectively. and are the covariance matrices of the channelized images, defined as and , where is the matrix representation of the channel profiles and matrices and are the covariance matrices of the images. There are many types of filters that can be used to channelize the images, such as Gabor, Laguerre–Gauss, and difference of Gaussian.13–15 In this study, we utilized Gabor filters as they have been shown to well characterize human visual system responses.2,16
After calculating the test statistics, an internal noise component was added according to the following equation:
| (1) |
where is a weighting factor and is a normally distributed random variable with a zero mean and a standard deviation of that were obtained from
| (2) |
where “var” stands for variance and is the set of test statistics from the signal-absent images. The internal noise weighting factor was set to 9.35; the same value used in Ref. 5. This weighting factor was determined to generate the same percent correct (Pc) between model observer and human observers for one specific configuration (5-mm diameter object, 120 mAs, FBP reconstruction), and was used in all the rest of the configurations. The signal-present images for each low-contrast object were generated by extracting a region of interest (ROI) surrounding the object with a size of 1.5 times of the object diameter. The signal-absent images for each low-contrast object were generated by extracting an ROI of the same size and located near the object of interest. The template, , was built using signal-present and signal-absent images, where is the number of scans available for the CHO calculation. The template was subsequently used to calculate the decision variable for each pair of the signal-present and signal-absent images. After adding the internal noise, the decision variables were compared and the 2AFC decision was made. The Pc for pairs of signal-present and signal-absent images was calculated and used as the FOM to describe the low-contrast detectability. The Pc obtained from the 2AFC experiment is equivalent to the area under the receiver operating characteristic (ROC) curve (). Here, we used a “resubstitution” strategy to calculate the test statistics, i.e., the same set of images was used for training and testing the model. In other words, the same set of images used to build the template were used to calculate the decision variables and hence the FOM. A more thorough description of this resubstitution strategy can be found in page 973 in Ref. 10.
2.3. Determining Minimum Number of Scans
Ideally one could establish a ground truth of observer performance and based on this ground truth, the minimum number of scans necessary for sufficient observer performance accuracy could be determined. However, one would need infinite number of scans to establish the truth or a large number to yield an assuredly accurate value, which is not achievable in practice. Therefore, the absolute value of the bias between the CHO-determined FOM with a finite number of scans and the truth (i.e., infinite scans) is difficult to estimate. Our previous studies showed that the model observer calculated using 100 repeated scans can achieve excellent agreement with human observers.5 It is therefore appropriate to use the values estimated from 100 scans as a reference or ground truth by which the bias associated with values determined from fewer scans can be compared.
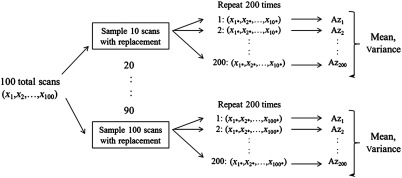
To determine FOMs from different number of scans, the mean and variance of values were calculated using the following method. First, image subsets were randomly selected with replacement from the 100-image pool 200 times. In this case, the chance of each image being selected was the same similar to the well-established bootstrap strategy.17 Then from these image subsets, mean values and corresponding variances were calculated for each subset of images. This process is shown in Fig. 3.
Fig. 3.
Scheme used to calculate mean and variance from subsets of (finite) scans.
Using this strategy, the empirical distribution of images given a single set of images is the nonparametric maximum-likelihood estimate of the actual distribution of images. Hence, resampling this single set of images gives the best estimate of sampling from the actual distribution of images, in the absence of any other information about the distribution.18
The minimum number of scans was determined as the fewest number of scans that yielded a mean value within ±0.02 of the reference value. Note here the mean value calculated with all the 100 repeated scans was used as the reference.
2.4. Factors Affecting the Minimum Number of Images Required for Channelized Hotelling Observer
We investigated the impact of several Gabor filter parameters on the minimum number of scans necessary for accurate CHO performance. The general form of Gabor function can be expressed as
where is the channel width, () is the channel center, is the center spatial frequency, indicates the channel orientation, and is a phase factor.16
We started with a set of 40 Gabor filters consisting of four passbands, five orientations, and two phases. The four passbands were [1/128, 1/64], [1/64, 1/32], [1/32, 1/16], and [1/16, 1/8] cycles/pixels, with center frequencies , and 3/16 cycles/pixels, respectively. The five orientations were , and , and the two phases were equal to .4 The number of channels was first reduced by trimming the number of passbands. By iteratively removing the highest and lowest frequency channel filters, the total number of passbands was reduced to 4, 2, and 1. Correspondingly, the total number of channels was 40, 20, and 10, while keeping the five orientations and two phases the same. We further altered the total number of channels by adding four more passbands (two low frequencies and two high frequencies) to the original four passbands and then iteratively reducing the number from 8 to 6, 4, and 2, while keeping only one orientation () and one phase (), resulting in 8, 6, 4, and 2 channels in total. Similar operations were then performed to reduce the number of orientations from 5 to 3 and 1, while keeping four passbands and two phases. This results in a total of 24 and 8 channels, respectively. Ideally, for symmetric testing objects, it is not necessary to include the directional channels. However, the testing objects in physical phantoms are not perfectly symmetrical. We include this test to evaluate its impact on the minimum number of repeated scans. Finally, the number of phases was reduced from 2 (0 and ) to 1 (only 0 deg), while maintaining four passbands and five orientations, resulting in a total of 20 channels. These channel selection strategies are listed in Table 1.
Table 1.
Channel selection strategies for the Gabor filter.
| Passband change | |||
|---|---|---|---|
| Number of orientations | Number of phases | Number of passbands | Total number of channels |
| 40 | |||
| 20 | |||
| 10 | |||
|
|
|
8 | |
| 6 | |||
| 4 | |||
|
|
2 |
||
| Orientation change | |||
| Number of passbands | Number of phases | Number of orientations | |
|
|
|
40 | |
| 24 | |||
|
|
8 |
||
| Phase change | |||
| Number of passbands | Number of orientations | Number of phases | |
| 40 | |||
| 20 | |||
We also investigated the impact of various experimental factors on the mean and variance of the values estimated by CHO. These factors include object size and contrast, radiation dose level, and reconstruction kernel (Table 2). Based on the mean of the values at different subset number of images, the minimum number of images for each experimental configuration was determined using the previously stated criterion.
Table 2.
Varying object size, object contrast, radiation dose, and reconstruction kernels.
| Object size (mm) | Object contrast (HU) | Radiation dose level (mGy) | Reconstruction kernel |
|---|---|---|---|
| 10, 9.5, 6.3, 4.8, 4.0, 3.2, 2.4 | 16, 8, 4 | FBP (B40) SAFIRE (I40-3) |
3. Results
3.1. Estimated Performance Using all 100 Repeated Scans
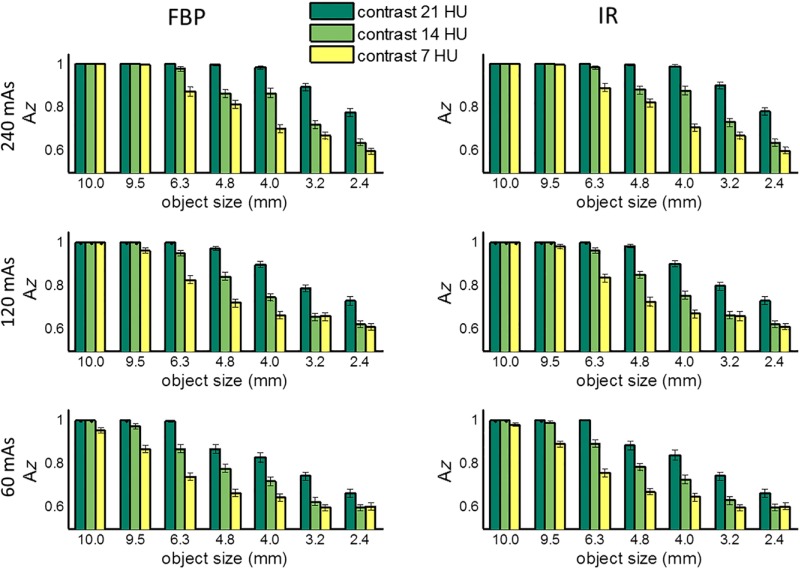
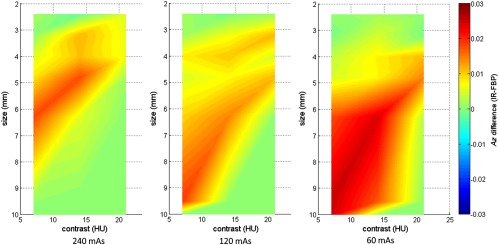
Figure 4 shows the values estimated by a CHO for all 21 low-contrast objects at each of the three dose levels and two reconstruction methods (FBP and IR). Presented in this figure are FOMs from a CHO based on 20 Gabor channel filters, including four channel passbands: [1/64, 1/32], [1/32, 1/16], [1/16, 1/8], and [1/8, 1/4] cycles/pixels, five orientations: (, and ), and one phase at 0 deg. All 100 repeated scans were used to generate the results. The error bar denotes the standard deviation obtained from 200 repeats of samples with replacement. As expected, the low-contrast detectability decreased with the decrease of radiation dose, object contrast, and size and approached 0.5 at 60 mAs for smaller objects (3.2 and 2.4 mm) and 7 HU contrast, indicating that it was almost a random guess at this dose level. The largest lesion (10 mm) at all three contrast levels had almost perfect detectability at all doses. Figure 5 shows two-dimensional (2-D) map of absolute value differences between IR and FBP as a function of both object size and contrast level at three different dose levels (240, 120, and 60 mAs, corresponding to 16, 8, and 4 mGy in . We performed paired -test for each of the 21 objects and three dose levels between IR and FBP, most pairs show significant difference between IR and FBP, but these differences were really small, with a maximum difference below 0.03 as shown in Fig. 5.
Fig. 4.
Area under the ROC curve () estimated by CHO for the 21 low-contrast objects (7 sizes × 3 contrast levels) at three different mAs levels (240, 120, and 60), corresponding to a of 16, 8, and 4 mGy, respectively, with both FBP and IR reconstruction methods, using 20 channel Gabor filter (four passbands, five orientations, and one phase).
Fig. 5.
2-D map of value difference between IR and FBP as a function of both object size and contrast level at three different dose levels (240, 120, and 60 mAs, corresponding to 16, 8, and 4 mGy in ). Twenty channel Gabor filter (four passbands, five orientations, and one phase) was used.
3.2. Dependency on Object Size and Contrast Level
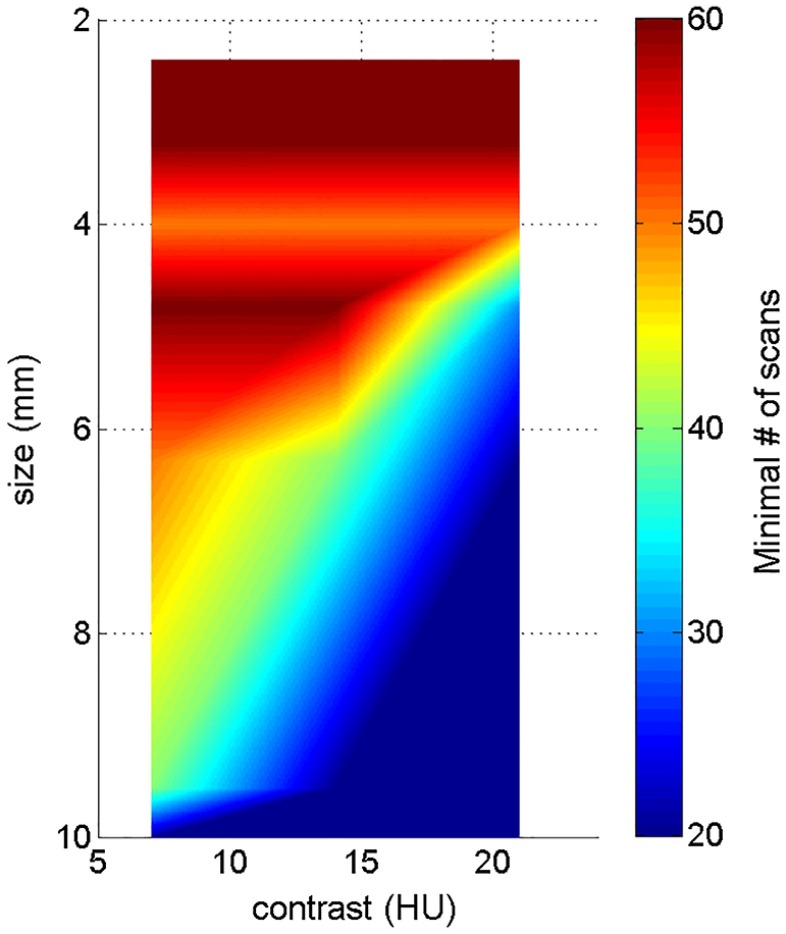
Figure 6 shows 2-D map of the minimum required number of scans as a function of both object size and contrast level (120 mAs, FBP reconstruction, and the same 20 channel setting as in Sec. 3.1). As a general trend, the minimum required number of scans increases as object size and contrast decrease. For example, for an object with a diameter of 6.3 mm and a contrast of 21 HU, a minimum number of 20 repeated scans is necessary for accurate model performance; where as, for an object with a diameter of 3.2 mm and a contrast of 7 HU, a minimum of 60 scans is required for accurate performance.
Fig. 6.
2-D map of minimum required number of scans as a function of both object size and contrast level, at 120 mAs dose level, using the FBP reconstruction. Twenty channel Gabor filter (four passbands, five orientations, and one phase) was used.
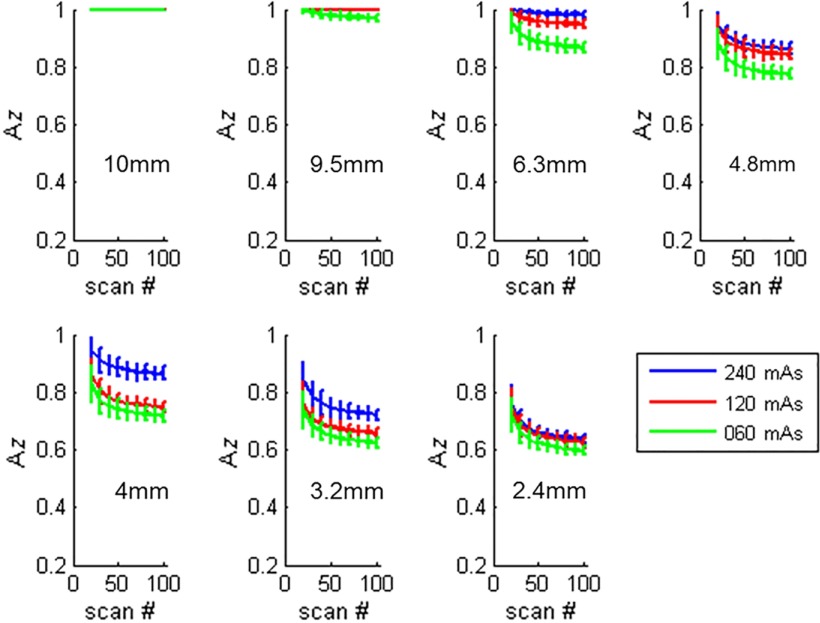
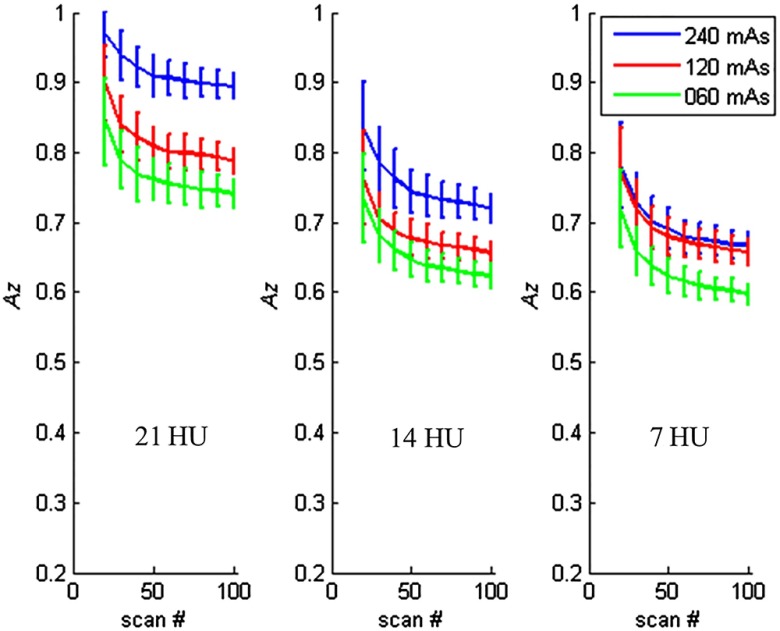
Figure 7 shows examples of how the values changed as a function of number of repeated scans for different object sizes. The object contrast was fixed at . Figure 8 shows the examples of how the values changed as a function of number of repeated scans for different object contrast levels. The object size was fixed at 3.2 mm object, and the images were reconstructed with the FBP method.
Fig. 7.
Estimated performance as a function of number of repeated scans used in the CHO calculation, for different object sizes. The contrast was , and the images were reconstructed with FBP. Twenty channel Gabor filter (four passbands, five orientations, and one phase) was used.
Fig. 8.
Estimated performance as a function of number of repeated scans used in the CHO calculation for different object contrast levels. The object size was 3.2 mm, and the images were reconstructed with FBP. Twenty channel Gabor filter (four passbands, five orientations, and one phase) was used.
3.3. Dependency on Radiation Dose
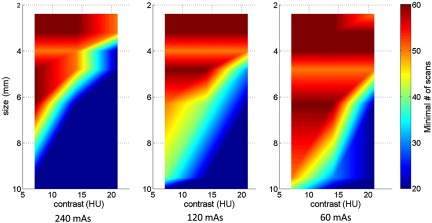
Figure 9 shows 2-D maps of the minimum required number of scans as a function of both object size and contrast level at each of the three dose levels, which correspond to different noise levels (standard deviation: at 240 mAs, at 120 mAs, and at 60 mAs, respectively). In this figure, the minimum required number of scans increases as the mAs level decreases from 240 to 60 mAs.
Fig. 9.
2-D map of minimum required number of scans as a function of object size and contrast level using the FBP reconstruction at three different dose levels (240, 120, and 60 mAs, corresponding to 16, 8, and 4 mGy in ). Twenty channel Gabor filter (four passbands, five orientations, and one phase) was used.
3.4. Dependency on Reconstruction Methods
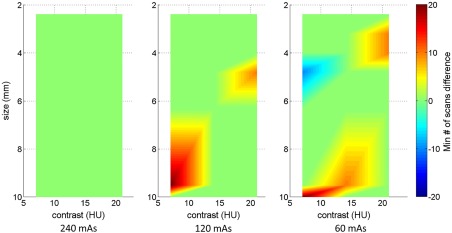
Figure 10 shows 2-D maps of the difference between FBP and IR in terms of minimum required number of scans as a function of both the object size and contrast level at 120 mAs dose level. There were only a few differences between FBP and IR among all of the object contrast and sizes combinations, and these differences in minimum number of scans did not exceed .
Fig. 10.
2-D maps of the difference between FBP and IR in terms of minimum required number of scans as a function of object size and contrast level at three dose levels (240, 120, and 60 mAs, corresponding to 16, 8, and 4 mGy in ). Twenty channel Gabor filter (four passbands, five orientations, and one phase) was used.
3.5. Dependency on Channel Parameters
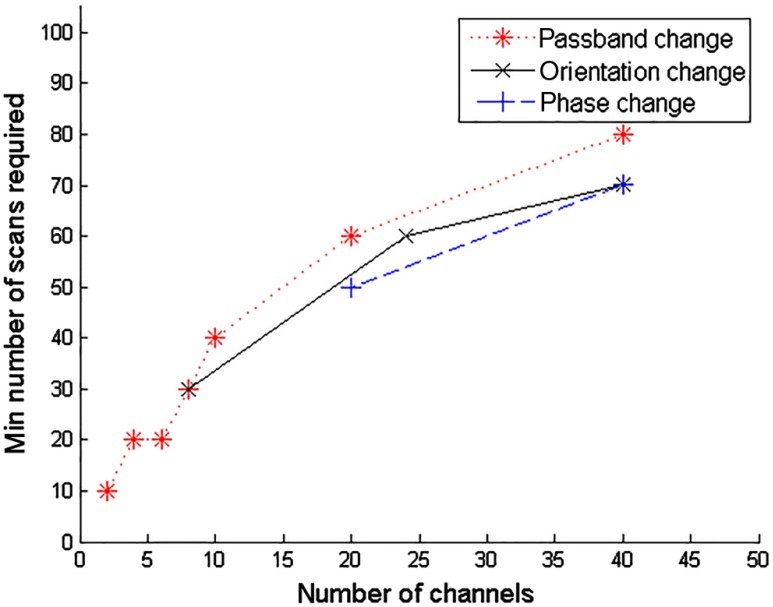
Figure 11 shows the minimum required number of scans as a function of number of channels. The selection of parameters that results in changes of total number of channels is detailed in Table 1. As can be seen, the minimum required number of scans increases as the number of channels increases, regardless of the change of the channel filter parameters (passband, phase, or orientation).
Fig. 11.
Minimum required number of scans as a function of number of channels, for an object contrast of 21 HU and a size of 3.2 mm at 240 mAs using the FBP reconstruction.
3.6. Dependency on Value
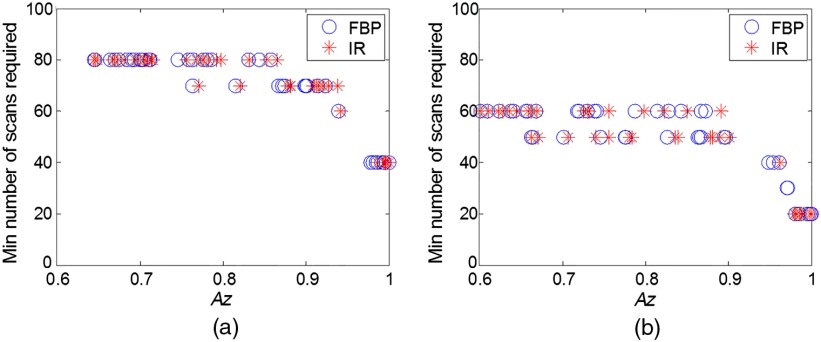
As previously shown, the minimum number of scans is dependent on the object size and contrast, noise, as well as channel parameters. Figure 12 shows a summary of the results by using a scatter plot of the minimum number of scans as a function of low-contrast detectability expressed as . As can be seen, the minimum number of scans is highly dependent on the low-contrast detectability. Regardless of the factors (size, contrast, noise, and reconstructions) that affect the low-contrast detectability, the minimum number of scans increases with the decrease of .
Fig. 12.
Scatter plot of the minimum required number of scans as a function of low-contrast detectability expressed in . Each scatter point in the plot represents the value at certain object size, contrast level, and dose level. (a) Forty channels in the Gabor filter (four passbands, five orientations, and one phase) and (b) 20 channels in the Gabor filter (four passbands, five orientations, and one phase).
4. Discussion
Previously, we have demonstrated the effectiveness of the spatial domain CHO models to correlate with human observer performance in a series of phantom-based detection/classification tasks and with IR.5,7,8 One major limitation of these CHO models is that it requires a large number of repeated scans to establish the model’s template. In order to use the CHO in a routine quality control test or in image quality assessment for given tasks, one would prefer to acquire and use fewer number of repeated scans without sacrificing the accuracy of the image quality evaluation. To accomplish this goal, it is important to understand the relationship between the minimum required number of repeated scans and experimental and model parameters, including radiation dose, noise, reconstruction method, contrast level, object, and channel filters. Results presented in the current study provided experimental data on these relationships, which may help guide the experimental design for low-contrast performance measurement when CHO models are used.
Model observers have become a popular choice for task-based image quality assessment in CT in recent years,5–8,19–21 especially with the increased use of IR and other noise reduction methods in clinical CT.22–24 The growing adoption of model observer-based assessment is primarily due to the limitations of traditional quality metrics, such as modulation transfer function (MTF) and noise standard deviation, which poorly characterize the spatial resolution and noise properties of IR methods that involve nonlinear regularizations.25–27 Among various model observers that have been proposed to assess image quality in CT, some were expressed in spatial frequency domain that required characterization of the system’s MTF and noise power spectrum, which rely on the assumption of locally linear shift-invariance (LSI) of the CT system.6,19,20 These frequency-domain model observers do not require a large number of repeated scans. However, it is known that accurate measurement of MTF is challenging for nonlinear IR methods at very low contrast levels27 and, more importantly, the local LSI assumption is invalid for images created using IR methods and containing anatomical structures.28
It is interesting to note that the minimum required numbers of scans required for FBP and IR were not significantly different from each other, given the same radiation dose, object size and contrast, and channel filter parameters in CHO. This lack of a difference may be due to the marginal or very small improvement on low-contrast detectability using IR. Objective assessment of image quality on IR reconstructed images has recently been an active research area in clinical CT. It appears that the performance of IR varies across vendors, software version, dose levels, and diagnostic tasks. The reason why the performance of IR is highly dependent on the diagnostic task and dose level is because of the nonlinear properties of the spatial resolution and noise as a result of the nonlinear regularization term in all current IR methods implemented on CT scanners. In general, the performance improvement over FBP is higher for high-contrast diagnostic tasks, but lower or close to none for low-contrast tasks.24 In our current study, we focus on the low-contrast detection task, which was the reason why we did not observe much improvement. This observation is consistent with some of the other recent evaluation studies on the low-contrast performance of IR methods, either phantom-based 5,29–31 or clinical patient-based studies.32,33
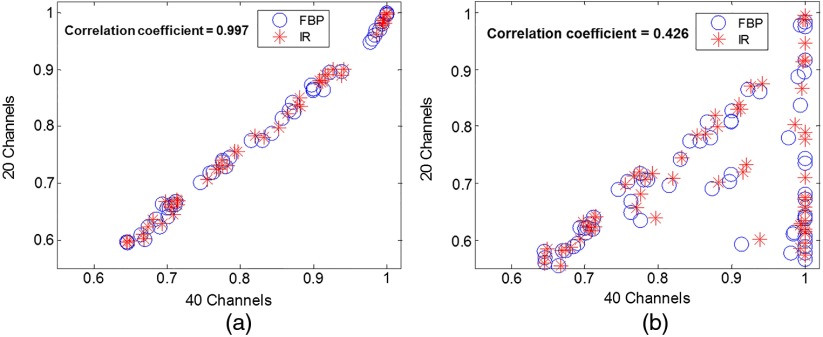
The results in Fig. 11 suggested that the required number of scans decreased as the number of channels decreased. However, it is inappropriate to make the claim that less number of channels is better. When the number of channels is reduced to a certain extent (e.g., by reducing the number of passband and number of orientations), it is expected that it does not model the human visual system response well and its correlation with human observers becomes degraded. The correlation between two sets of channels (one of them validated with human observer) serves as a reasonable test on how well the channel selection maintains the estimate of human performance, at least in terms of relative ranking order. Figure 13 shows two examples of such correlation test. When the channel selection was appropriate, the correlation between the two sets of channel selection was high [Fig. 13(a)]. However, when the channel selection was inappropriate (the frequency band cannot cover the frequency component of the object), the correlation with the 40 channel selection became very low [Fig. 13(b)]. How to select the optimal number of channels and the channel parameters such that a good balance between the minimum numbers of repeated scans and sufficient correlation accuracy remains to be investigated, although it was claimed that 36 channels gives a complete model (six channels to cover spatial frequency space × six orientation channels), see page 937 in Ref. 10.
Fig. 13.
Correlation of values between 40 channels (four passbands, five orientations, and two phases) and (a) 20 channels (four passbands, five orientations, and one phase), (b) 10 channels (one frequency band, five orientations, and two phases). Each scatter point in the plot represents the value at certain object size, contrast level, and dose level. The correlation coefficient is 0.997 for (a) and 0.426 for (b).
There were limitations in this study. First, we did not test the hold out strategy18 for CHO calculations. This was mainly because our previously validated CHO models were based on the resubstitution strategy. It is expected that the positive bias with finite samples in the resubstitution strategy becomes negative in the hold out strategy, but the general trend of the impact on the minimum number of repeated scans from various factors (reconstruction, dose, lesion size/contrast, and channel parameters) should remain similar. Second, use of as the FOM has its limitation. When the value is approaching 1, there could still be a bias that cannot be detected since the performance for the detection task becomes saturated. Index of detectability may be used to overcome this limitation, but the bias at an value close to 1 is mostly irrelevant in terms of diagnostic performance for a given task.
5. Conclusion
We performed an experimental study to investigate the impact of object size and contrast, reconstruction method, radiation dose, and channel filter parameters on the minimum number of repeated scans required for accurate CHO calculation in a signal-known-exactly phantom-based detection task. Using results obtained with 100 independent image samples acquired from repeated scans as the reference, we determined the minimum number of scans required to yield accurate performance of the model for images acquired at different dose levels and reconstructed with both FBP and IR methods. This study provides an experimental basis that may help guide the design of task-based image quality assessment in clinical CT when CHO models are used.
Acknowledgments
The authors would like to thank Mr. Thomas Vrieze for his help on phantom scans, Dr. Frederic Noo from the University of Utah and Dr. Matthew Kupinski from the University of Arizona for helpful discussions, and Ms. Kris Nunez for her help on paper preparation. The project was supported by the National Institutes of Health (NIH) Grant Nos. R01 EB017095 and U01 EB017185. The content is solely the responsibility of the authors and does not necessarily represent the official views of the NIH.
Biographies
Chi Ma received a BS degree in physics from University of Science and Technology of China, in 2007, an MS degree in nuclear physics from University of Notre Dame in 2009, and a PhD in medical physics from University of Wisconsin-Madison, in 2014. He is a medical physics resident at Mayo Clinic. His research interests include CT physics and image quality assessment, MR safety, and ultrasound strain imaging.
Lifeng Yu received a BS degree in nuclear physics in 1997 and an MEng degree in nuclear technology in 2000, both from Beijing University, and a PhD in medical physics from the University of Chicago in 2006. He is an associate professor of Medical Physics at Mayo Clinic. He is the author of over 90 journal articles and holds 10 patents. His research interests include CT physics, image quality assessment, and spectral CT.
Baiyu Chen received a BS degree in engineering physics from Tsinghua University in 2008, and a PhD degree in medical physics from Duke University in 2014. She is a research fellow at the Mayo Clinic in Rochester, MN. Her research interests include evaluation and optimization of medical image quality.
Christopher P. Favazza is an assistant professor of Medical Physics in the Department of Radiology at Mayo Clinic. He received his PhD degree in physics from Washington University in St. Louis. He is the coauthor of more than 30 journal papers and 3 book chapters. His current research interests include diagnostic imaging applications across all preclinical and clinical imaging modalities and novel biomarker detection systems.
Shuai Leng received a BS degree in engineering physics in 2001, an MS degree in engineering physics in 2003, from Tsinghua University, and a PhD degree in medical physics in 2008 from the University of Wisconsin, Madison. He is an associate professor of Medical Physics at the Mayo Clinic in Rochester, MN. He has authored over 100 peer-reviewed articles. His research interest is technical development and clinical application of X-ray and CT imaging
Cynthia McCollough received a BS degree in physics from Hope College in 1985, an MS degree in medical physics from the University of Wisconsin, Madison, in 1986, and a PhD degree in medical physics from the University of Wisconsin, Madison, in 1991. She is a professor of Medical Physics and Biomedical Engineering at the Mayo Clinic in Rochester, MN, where she directs the multidisciplinary CT Clinical Innovation Center.
References
- 1.Myers K. J., Barrett H. H., “Addition of a channel mechanism to the ideal-observer model,” J. Opt. Soc. Am. A 4(12), 2447–2457 (1987). 10.1364/JOSAA.4.002447 [DOI] [PubMed] [Google Scholar]
- 2.Barrett H. H., et al. , “Model observers for assessment of image quality,” Proc. Natl. Acad. Sci. U. S. A. 90(21), 9758–9765 (1993). 10.1073/pnas.90.21.9758 [DOI] [PMC free article] [PubMed] [Google Scholar]
- 3.Vennart W., “Medical imaging—the assessment of image quality,” ICRU Report 54, International Commission of Radiation Units and Measurements, Bethesda, Maryland (1996).
- 4.Wunderlich A., Noo F., “Image covariance and lesion detectability in direct fan-beam x-ray computed tomography,” Phys. Med. Biol. 53(10), 2471–2493 (2008). 10.1088/0031-9155/53/10/002 [DOI] [PMC free article] [PubMed] [Google Scholar]
- 5.Yu L., et al. , “Prediction of human observer performance in a 2-alternative forced choice low-contrast detection task using channelized Hotelling observer: impact of radiation dose and reconstruction algorithms,” Med. Phys. 40(4), 041908 (2013). 10.1118/1.4794498 [DOI] [PMC free article] [PubMed] [Google Scholar]
- 6.Wilson J. M., et al. , “A methodology for image quality evaluation of advanced CT systems,” Med. Phys. 40(3), 031908 (2013). 10.1118/1.4791645 [DOI] [PubMed] [Google Scholar]
- 7.Leng S., et al. , “Correlation between model observer and human observer performance in CT imaging when lesion location is uncertain,” Med. Phys. 40(8), 081908 (2013). 10.1118/1.4812430 [DOI] [PMC free article] [PubMed] [Google Scholar]
- 8.Zhang Y., et al. , “Correlation between human and model observer performance for discrimination task in CT,” Phys. Med. Biol. 59(13), 3389–3404 (2014). 10.1088/0031-9155/59/13/3389 [DOI] [PMC free article] [PubMed] [Google Scholar]
- 9.Li K., et al. , “Statistical model based iterative reconstruction in clinical CT systems. Part III. Task-based optimization for radiation dose reduction,” Med. Phys. 42(9), 5209–5221 (2015). 10.1118/1.4927722 [DOI] [PMC free article] [PubMed] [Google Scholar]
- 10.Barrett H. H., Myers K. J., Foundations of Image Science, Wiley-Interscience, Hoboken, NJ: (2004). [Google Scholar]
- 11.Reiser I., Lu Z., “Sample-size dependence of model observers for estimating low-contrast detection performance from CT images,” presented at AAPM Annu. Mtg. (Abstract), Austin Texas, SU-E-I-46 (2014). [Google Scholar]
- 12.Barrett H. H., et al. , “Model observers for assessment of image quality,” Proc. Natl. Acad. Sci. U. S. A. 90(21), 9758–9765 (1993). 10.1073/pnas.90.21.9758 [DOI] [PMC free article] [PubMed] [Google Scholar]
- 13.Eckstein M., et al. , “Automated computer evaluation and optimization of image compression of x-ray coronary angiograms for signal known exactly detection tasks,” Opt. Express 11(5), 460–475 (2003). 10.1364/OE.11.000460 [DOI] [PubMed] [Google Scholar]
- 14.Zhang Y., Abbey C. K., Eckstein M. P., “Adaptive detection mechanisms in globally statistically nonstationary-oriented noise,” J. Opt. Soc. Am. A 23(7), 1549–1558 (2006). 10.1364/JOSAA.23.001549 [DOI] [PubMed] [Google Scholar]
- 15.Chawla A. S., et al. , “Effect of dose reduction on the detection of mammographic lesions: a mathematical observer model analysis,” Med. Phys. 34(8), 3385–3398 (2007). 10.1118/1.2756607 [DOI] [PubMed] [Google Scholar]
- 16.Gabor D., “Theory of communication. Part 1: the analysis of information,” J. Inst. Electr. Eng. Part III 93(26), 429–441 (1946). 10.1049/ji-3-2.1946.0074 [DOI] [Google Scholar]
- 17.Efron B., Tibshirani R., An Introduction to the Bootstrap. Monographs on Statistics and Applied Probability, Vol. XVI, p. 436, Chapman & Hall, New York: (1993). [Google Scholar]
- 18.Gagne R. M., Gallas B. D., Myers K. J., “Toward objective and quantitative evaluation of imaging systems using images of phantoms,” Med. Phys. 33(1), 83–95 (2006). 10.1118/1.2140117 [DOI] [PubMed] [Google Scholar]
- 19.Richard S., et al. , “Predictive models for observer performance in CT: applications in protocol optimization,” Proc. SPIE 7961, 79610H (2011). 10.1117/12.877069 [DOI] [Google Scholar]
- 20.Gang G. J., et al. , “Task-based detectability in CT image reconstruction by filtered backprojection and penalized likelihood estimation,” Med. Phys. 41(8), 081902 (2014). 10.1118/1.4883816 [DOI] [PMC free article] [PubMed] [Google Scholar]
- 21.Xu J., et al. , “Task-based image quality evaluation of iterative reconstruction methods for low dose CT using computer simulations,” Phys. Med. Biol. 60(7), 2881–2901 (2015). 10.1088/0031-9155/60/7/2881 [DOI] [PubMed] [Google Scholar]
- 22.Hara A. K., et al. , “Iterative reconstruction technique for reducing body radiation dose at CT: feasibility study,” Am. J. Roentgenol. 193(3), 764–771 (2009). 10.2214/AJR.09.2397 [DOI] [PubMed] [Google Scholar]
- 23.Winklehner A., et al. , “Raw data-based iterative reconstruction in body CTA: evaluation of radiation dose saving potential,” Eur. Radiol. 21(12), 2521–2526 (2011). 10.1007/s00330-011-2227-y [DOI] [PubMed] [Google Scholar]
- 24.Ehman E. C., et al. , “Methods for clinical evaluation of noise reduction techniques in abdominopelvic CT,” Radiographics 34(4), 849–862 (2014). 10.1148/rg.344135128 [DOI] [PubMed] [Google Scholar]
- 25.Fessler J. A., Rogers W. L., “Spatial resolution properties of penalized-likelihood image reconstruction: space-invariant tomographs,” IEEE Trans. Image Process. 5(9), 1346–1358 (1996). 10.1109/83.535846 [DOI] [PubMed] [Google Scholar]
- 26.Thibault J. B., et al. , “A three-dimensional statistical approach to improved image quality for multislice helical CT,” Med. Phys. 34(11), 4526–4544 (2007). 10.1118/1.2789499 [DOI] [PubMed] [Google Scholar]
- 27.Yu L. F., et al. , “Technical note: measuring contrast- and noise-dependent spatial resolution of an iterative reconstruction method in CT using ensemble averaging,” Med. Phys. 42(5), 2261–2267 (2015). 10.1118/1.4916802 [DOI] [PMC free article] [PubMed] [Google Scholar]
- 28.Li K., et al. , “Experimental assessment of Z- and axial spatial resolution of statistical model based iterative reconstruction and its correlation with image noise,” presented at Radiological Society of North America 2014 Scientific Assembly and Annual Meeting, Chicago, Illinois, SSG14-09 (2014). [Google Scholar]
- 29.Schindera S. T., et al. , “Iterative reconstruction algorithm for CT: can radiation dose be decreased while low-contrast detectability is preserved?” Radiology 269(2), 511–518 (2013). 10.1148/radiol.13122349 [DOI] [PubMed] [Google Scholar]
- 30.Goenka A. H., et al. , “Effect of reduced radiation exposure and iterative reconstruction on detection of low-contrast low-attenuation lesions in an anthropomorphic liver phantom: an 18-reader study,” Radiology 272(1), 154–163 (2014). 10.1148/radiol.14131928 [DOI] [PubMed] [Google Scholar]
- 31.McCollough C. H., et al. , “Degradation of CT low-contrast spatial resolution due to the use of iterative reconstruction and reduced dose levels,” Radiology 276(2), 499–506 (2015). 10.1148/radiol.15142047 [DOI] [PMC free article] [PubMed] [Google Scholar]
- 32.Fletcher J. G., et al. , “Observer performance in the detection and classification of malignant hepatic nodules and masses with CT image-space denoising and iterative reconstruction,” Radiology 276(2), 465–478 (2015). 10.1148/radiol.2015141991 [DOI] [PMC free article] [PubMed] [Google Scholar]
- 33.Fletcher J. G., et al. , “Observer performance for adaptive, image-based denoising and filtered back projection compared to scanner-based iterative reconstruction for lower dose CT enterography,” Abdom. Imaging 40(5), 1050–1059 (2015). 10.1007/s00261-015-0384-1 [DOI] [PMC free article] [PubMed] [Google Scholar]


