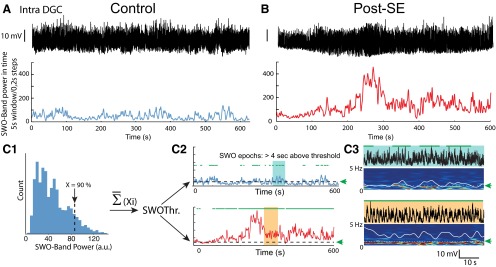
Figure 1.
Method to compare the incidence and power of slow oscillations in the membrane potential of dentate granule cells from control and post-SE rats. A, Top, Vm of a DGC from a control rat. The recording was bandpass filtered (0.1-40 Hz). Bottom, Time-varying power in the slow-frequency range (0.1-2 Hz) extracted from the time–frequency spectrogram of the Vm trace computed over a 5 s sliding window in 0.2 s steps. B, Same as in A except that the cell from a post-SE rat was spontaneously firing (unlike the cell in A), and spikes were digitally removed from the recording. Scale bar, as in A. C1, For each recording in controls, the 90th percentile highest value of the SWO band (0.1-2 Hz) power (Xi) was determined. The mean of all these values for control cells gives a unique threshold (SWOThr), which is then used to determine the SWO epochs in all DGCs from both control and post-SE rats. C2, Example of the time-varying SWO power for the two recordings shown in A (top, blue) and B (bottom, red). Dashed lines correspond to the threshold for significant SWO epochs detection (green arrow). The epochs of high SWO power (green horizontal bars) are defined as epochs when the SWO power is above the threshold for >4 s. C3, Illustration of detected SWO epochs corresponding to the light blue- and orange-shaded areas in C2, Top, Vm traces. Bottom, Time–frequency spectrogram. Superimposed white lines represent the time-varying power values in the SWO band (0.1-2 Hz). Dashed white lines (green arrows) indicate the threshold used for SWO epochs detection (horizontal green bars above the traces).

