Figure 2.
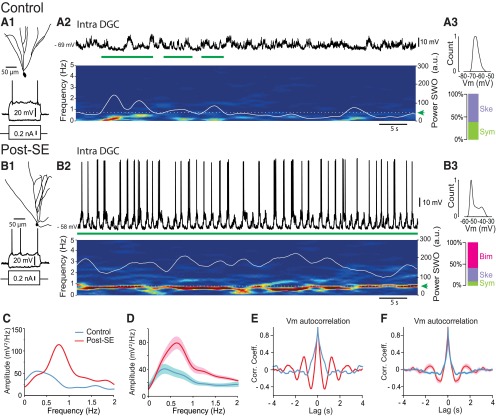
Increased slow-oscillatory UP/DOWN state dynamics of the membrane potential of dentate granule cells in post-SE rats. A1, Neurolucida reconstruction of the morphology of a recorded dentate granule cell from a control rat (top) and voltage responses to intracellularly injected depolarizing and hyperpolarizing current pulses (500 ms duration, bottom). A2, Top, Vm of the cell illustrated in A1 during a 60 s recording. Bottom, Time–frequency power spectrogram (5 s sliding window, 0.2 s steps) corresponding to the top trace. Superimposed white line represents the time-varying power values in the SWO frequency range (0.1-2 Hz). Dashed white line (green arrow) indicates the SWO detection threshold used to detect SWO epochs (horizontal green bars). A3, Top, Distribution of Vm values for the trace shown in A2, Bottom, Relative proportion of DGCs according to the distribution of their Vm (Ske., skewed; Sym., symmetric; n = 10). B, Same as in A for the post-SE condition. Note the presence of a continuous band in the slow-frequency range (∼0.8 Hz), and bimodal distribution of the Vm in the DGC from post-SE, but not control, rat (Bim., bimodal). C, Power spectrum of the traces shown in A (blue) and B (red). D, Average power spectrum for all recorded DGCs in control (blue line; n = 10) and post-SE (red line; n = 8). E, Autocorrelogram of the traces shown in A (blue) and B (red). F, Mean autocorrelogram for all recorded DGCs in control (blue line; n = 10) and post-SE (red line; n = 8). Light blue- and pink-shaded areas correspond to ±SEM.

