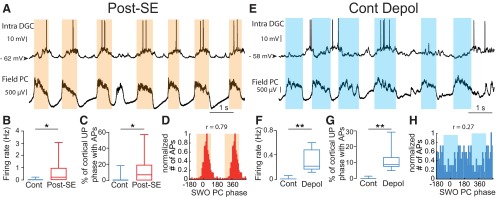
Figure 6.
Modulation of the action potentials of dentate granule cells by the neocortical slow oscillation in post-SE and control rats. A, E, Membrane potential of a DGC (top) recorded in a post-SE rat (A) or a control rat after depolarization to induce spontaneous firing (E) and simultaneously recorded local field potentials in the parietal cortex (bottom). B, Box plots of the firing frequency of intracellularly recorded DGCs from control rats (with no added depolarization; n = 10) and post-SE rats (n = 8). C, Box plots of the percentage of neocortical UP phases associated with at least one AP in the control condition (with no added depolarization; n = 10) and post-SE condition (n = 8). D, Phase distribution histogram of APs recorded in the DGC shown in A in reference to SWO phase in the parietal cortex. The orange-shaded area depicts the UP phase of SWO simultaneously recorded in the parietal cortex. F, Same as in B for DGCs from control rats before and after depolarization to induce spontaneous firing (n = 8). G, Same as in C for DGCs from control rats before and after depolarization to induce spontaneous firing (n = 8). H, Same as in D for the cell illustrated in E. *p < 0.05; **p < 0.01. For a description of box plots, see the legend of Figure 3.

