Abstract
The objective of this study is to link regional nasal spray deposition patterns of suspension formulations, predicted with computational fluid dynamics (CFD), to in vivo human pharmacokinetic (PK) plasma concentration profiles. This is accomplished through the use of CFD simulations coupled with compartmental PK modeling. Results showed a rapid initial rise in plasma concentration that is due to the absorption of drug particles deposited in the nasal middle passages, followed by a slower increase in plasma concentration that is governed by the transport of drug particles from the nasal vestibule to the middle passages. Although drug deposition locations in the nasal cavity had a significant effect on the shape of the concentration profile, the absolute bioavailability remained constant provided that all of the drug remained in the nose over the course of the simulation. Loss of drug through the nostrils even after long time periods resulted in a significant decrease in bioavailability and increased variability. The results of this study quantify how differences in nasal drug deposition affect transient plasma concentrations and overall bioavailability. These findings are potentially useful for establishing bioequivalence for nasal spray devices and reducing the burden of in vitro testing, pharmacodynamics and clinical studies.
Keywords: Pharmacokinetics, Nasal drug delivery, Nasal absorption, Dissolution, Clearance
INTRODUCTION
With the steadily increasing price of medications in the US market,1 the introduction of cost-effective generic products is typically viewed as favorable for consumers. For a generic pharmaceutical nasal spray suspension formulation to enter the marketplace, a demonstration of bioequivalence between an innovator and the generic product is required by the US FDA to ensure that the generic product has equivalent local delivery, equivalent systemic exposure and equivalent in vitro performance, together with a demonstration of device and formulation sameness.2 When considering bioequivalence of these suspension nasal spray devices, the complex relationship between local nasal drug deposition and systemic drug plasma concentrations poses significant challenges to regulators who wish to evaluate and compare these products.2,3
Bioequivalence determinations are dependent on the comparability between product-related factors that influence regional nasal drug deposition, uptake, and systemic exposure.2,4 Establishing bioequivalence between two nasal spray suspension formulations requires a comparison of in vitro performance (e.g. plume geometry and droplet size characteristics) as well as systemic exposure.2 Equivalent local delivery for these products is assessed using a pharmacodynamic or clinical study. While the overall bioavailability of a drug is calculated from the area under the plasma concentration curve (AUC), the shape of this concentration profile may also be used to infer the regional deposition of drug within the nasal cavity, as the two are expected to be correlated. If the regional deposition of a suspension nasal spray formulation can be deduced from PK data and knowledge of the formulation properties, the process of determining bioequivalence could be greatly simplified.
Although many nasal sprays are designed to treat localized conditions, the potential for systemic absorption must be considered with regard to patient safety. The bioavailabilities of various inhaled corticosteroids have been reported in several studies, and show widely varying degrees of systemic exposure for these lipophilic drugs.5-10 However, these studies generally do not specify initial regional deposition profiles of the nasal spray within the nose, which can differ between individual nasal geometries and administration methods (e.g. the nozzle insertion angle or the degree of patient inhalation).11,12 This initial deposition of the spray, and therefore the suspended drug, in the nasal cavity is expected to have a significant effect on the plasma concentration profile. Therefore, an efficient method is needed to examine the link between regional nasal spray drug deposition and time-dependent plasma concentrations.
The dose of drug delivered as a suspension formulation in a nasal spray device to the systemic circulation is the outcome of a complex relationship between regional deposition and formulation properties. With regards to toxicological vapor absorption in both nasal and respiratory epithelial cells, several groups have found that the vapor partition coefficient has a strong effect on the overall uptake rate.13-16 As an additional step, computational fluid dynamics (CFD) simulations have been linked to PK data of gas absorption in animal models,17 providing a new approach to determine bioequivalence parameters. However, these types of CFD simulations have not yet investigated the effect of suspended drug particle size or regional deposition patterns on PK parameters and plasma concentrations for pharmaceutical products. A simulation of suspension nasal spray aerosol deposition coupled with nasal clearance, drug dissolution, epithelial absorption, and PK modeling would therefore be useful in understanding the effects of suspension properties and regional spray deposition patterns on systemic dosage and bioequivalence.
Rygg and Longest previously developed a CFD model for nasal spray suspension products that simulates the coupled effects of nasal clearance, particle dissolution, and drug absorption at the epithelium.18 This nasal-DAC (dissolution, absorption, and clearance) model utilizes an anatomically-accurate surface model of the nasal cavity, and was shown to simulate particle clearance and dissolution that reflected in vivo and in vitro data, respectively. Coupled with PK simulations, this nasal-DAC model has the ability to realistically predict the time-dependent absorption of drug into the systemic circulation resulting from an initial spray deposition profile for a suspension nasal spray product. As the nasal-DAC model provides an efficient computational method for evaluating the factors that affect drug absorption and bioavailability, it has the potential to reduce the necessity for in vivo testing and simplify the process for determining bioequivalence.
The objective of this study is to link regional nasal spray drug deposition patterns and the size of the suspended drug particles in the formulation to pharmacokinetic plasma concentration profiles. This is accomplished by considering a variety of spray deposition profiles in combination with transient simulations of systemic drug absorption. The previously developed nasal-DAC model is further advanced by the addition of a PK model that simulates systemic absorption from epithelial tissue, binding of the drug to glucocorticoid receptors, and metabolism and clearance of the drug over time. The effect of drug particle size was previously considered with the nasal-DAC model in terms of microdosimetry and total nasal uptake.19 These results are now extended to explore the effect of drug particle size in the nasal suspension formulation on plasma concentration, which is a common endpoint with in vivo PK assessments. The results of this study are intended to help understand the relationship between the shape of a plasma concentration profile and the regional distribution of drug in the nose following administration of a suspension formulation with a nasal spray device.
MATERIALS AND METHODS
Overview
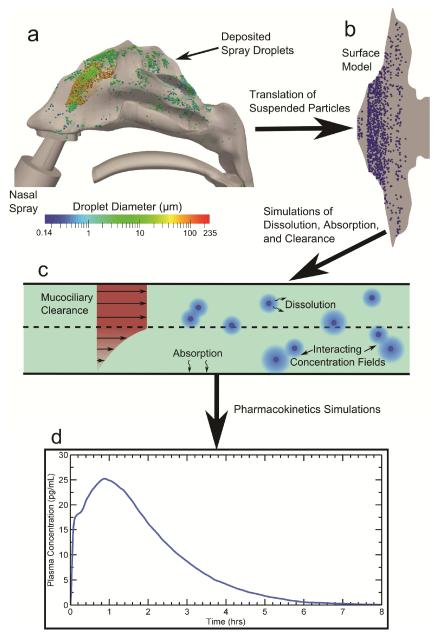
The overall methodology, shown in Figure 1, follows the fate of nasal spray droplets from their discharge at the nozzle tip of the spray pump to the point of systemic drug absorption. CFD simulations of nasal spray transport in a three-dimensional model of the human nasal cavity (Figure 1a) were used to obtain regional deposition locations. These deposition predictions were validated in the previous study of Rygg and Longest.18 The spray droplet deposition locations in the 3D nasal cavity were then translated onto the anatomically-accurate nasal-DAC model (Figure 1b) for use in CFD simulations of particle dissolution and drug absorption at the epithelium (Figure 1c). Finally, an integrated compartmental PK model allowed for calculations of plasma concentration over time (Figure 1d). The rationale behind this methodology was that the initial spray deposition patterns will affect the dissolution and absorption rates of the suspended drug particles. Therefore, these post-deposition physics are best addressed by a separate clearance model (the nasal-DAC model), which is capable of resolving the relevant spatial and temporal drug concentration profiles in the nasal mucus layer. Using a velocity field18 that realistically models mucociliary clearance rates in vivo for healthy adults,11 simulations of drug particle advection, dissolution, and diffusion were carried out, as described in the following sections. Mometasone furoate (MF) was used as a representative drug in the current study. A PK model using first-order rate constants for systemic drug absorption, receptor binding, and drug metabolism provided time-dependent values of the plasma concentration post-deposition.
Figure 1.
The overall methodology for conducting the CFD simulations is shown. Particle deposition data in the (a) 3D model of the nasal cavity (air space) including a commercial nasal spray pump was mapped onto the (b) surface-based model. CFD simulations were run using this model and accounted for (c) particle advection due to mucociliary clearance, particle dissolution and diffusion, and drug absorption at the epithelial surface. (d) Coupled pharmacokinetics simulations provided transient plasma concentration profiles.
CFD Simulations of Nasal Spray and Droplet Deposition
To determine initial drug particle deposition locations in the nasal-DAC model, 3D CFD calculations of droplet transport from a nasal spray device were carried out. For a detailed description of the methodology used for the simulations, see the previous study of Rygg and Longest.18 These CFD simulations were validated with the in vitro experiments of Azimi et al.,12 which implemented a Nasonex® (Merck & Co., Summit, NJ) spray pump, MF as a suspension product, and an in vitro airway geometry identical to that used in the computational simulations. Results of the CFD simulations and in vitro experiments showed that without nasal inhalation, deposition fractions in the nasal vestibule (NV) and middle passage (MP) were approximately 90% and 10%, respectively. These results correspond to a nozzle insertion angle of 30 degrees from vertical and an insertion depth of 10 mm, while approximately centering the device between the medial and lateral walls of the nostril. For the current study, insertion angles of 40 and 50 degrees are also considered, and the effects of nasal inhalation flow are taken into account.
Nasal-DAC Model
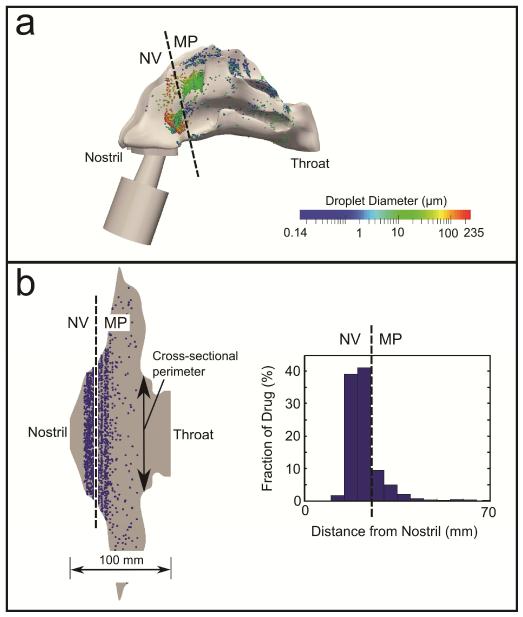
The previously developed nasal-DAC model18 was used to calculate the uptake of drug into the nasal epithelium. Details related to this model can be found in the previous studies by Rygg and Longest18 and Rygg et al.19 Briefly, an anatomically-accurate surface model of the nasal cavity was created by mapping nasal morphometric data from Xi et al.20,21 onto a flat surface. At a given distance from the nostril, the width of the surface model was set equal to the cross-sectional perimeter of the nasal airway; this provided a base for a computational mesh representative of the nasal mucus (or airway surface liquid, ASL) layer. To translate the droplet deposition locations from the 3D CFD simulations to the surface-based nasal-DAC model, the distance of each deposited droplet from the nostril was first calculated (Figure 2a). This distance was then translated to a location relative to the nostril on the nasal-DAC model (Figure 2b), where a number of solid drug particles (proportional to the droplet mass) were injected to represent the deposition of suspended drug particles delivered in a carrier spray droplet. This spatial distribution of drug particles, represented by the histogram in Figure 2b, provided the initial conditions for the particle transport and dissolution simulations.
Figure 2.
Translation of the deposited spray droplets illustrating (a) particle locations in the 3D nasal cavity model and (b) surface model of the nasal wall, resulting in a spatial distribution of drug (histogram in b). NV: Nasal vestibule; MP: Middle passages.
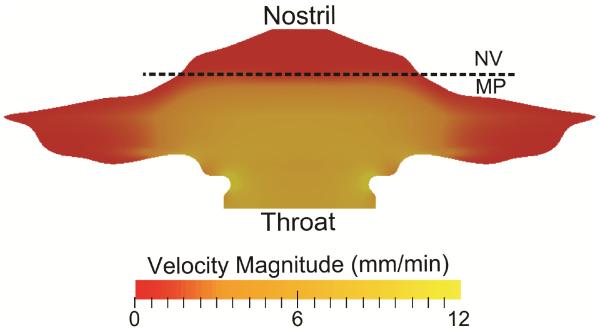
A prescribed ASL velocity field, validated within vivo data,11 was used to transport deposited drug particles in simulations of mucociliary clearance. The ASL velocity field (Figure 3) reflected the physiological differences between the unciliated NV,22 where the ASL velocity is close to zero, and the ciliated MP, where an average ASL clearance rate of 5-6 mm/min is typical of healthy, human adults.23-25 Additional details regarding the development of this velocity field can be found in our previous studies.18,19
Figure 3.
The velocity profile of the ASL layer is shown and represents clearance by mucociliary action. NV: Nasal vestibule; MP: Middle passages.
During simulations of drug particle transport, user-defined-functions modeled particle dissolution in the ASL, governed by the Noyes-Whitney equation, expressed as
| (1) |
where A is the surface area of the particle, Dmucus is the diffusion coefficient of the drug in mucus (or ASL), Cs is the solubility of the drug, Cb is the concentration in the bulk phase, and h is the diffusion layer thickness. Since the effective radius of a mometasone molecule is very small (~1 nm), the diffusion coefficient of the dissolved drug in mucus is approximately equal to its diffusion coefficient in water.26 Given this, the diffusion coefficient of MF was calculated by the Hayduk and Laudie equation27 to be Dmucus = 4.3e-6 cm2/s. All other drug properties were taken from the product information for the considered Nasonex® formulation.28 For particles with radius < 30 μm, the diffusion layer thickness h can be approximated as the particle radius that changes with time as the drug dissolves.29 The bulk phase concentration (Cb) field was updated at each time step in the simulations to represent the evolving dissolved drug environment around each particle including particle-to-particle interactions. These user-defined functions were validated with in vitro experiments that measured dissolution rates for corticosteroids with differing solubilities at high concentrations (i.e., concentration-limited dissolution).30 The validation study showed good agreement between the CFD simulations and in vitro data for three drugs with widely varying properties.18 Thus, the user-defined-functions implemented in the current simulations are expected to accurately predict concentration-limited particle dissolution behavior in the limited nasal ASL.
In the nasal-DAC model, the behavior of the dissolved drug was governed by the advection-diffusion equation, i.e.,
| (2) |
where ρ is the fluid density, Yi is the mass fraction of species i, is the fluid velocity, Di,m is the mass diffusion coefficient of the drug, and the source term Si accounts for the local addition of drug into the bulk phase from the dissolving particles. The advection-diffusion equation was solved in the ASL shown in Figure 1c with boundary conditions described below.
When calculating drug uptake at the epithelium, variations in the nasal epithelial cells were taken into account. The anterior third of the nose (i.e., NV) is characterized by keratinized, stratified squamous epithelium31-33 and is therefore unlikely to absorb any significant amount of drug. A zero-gradient boundary condition for the drug was therefore applied in this region. In contrast, the posterior region of the nose is coated with respiratory and olfactory epithelium.31,33 Given that the octanol/water partition coefficient of MF is greater than 5000,34 it can be assumed that the drug is readily taken up by these epithelial cells upon exposure. As a result, the drug concentration at the epithelium-ASL interface was set to zero in this portion of the model.
Numerical Methods
Computational fluid dynamics simulations were run using ANSYS Fluent 15 (ANSYS Inc., Canonsburg, PA). User-defined functions were employed to calculate particle dissolution, drug uptake at the epithelium, and PK physics. A steady-state flow solution was obtained using the SIMPLEC algorithm for pressure-velocity coupling, and all transport equations were discretized using 2nd order spatial accuracy. The solution was considered to be converged when all mass and momentum residuals dropped by at least three orders of magnitude and did not change with further iterations. The resolution of the mesh was determined to be sufficiently fine, as increasing the number of computational cells spanning the ASL layer (above ~15) had a negligible effect on the flow solution or overall epithelial drug absorption. Using the calculated ASL flow field, coupled simulations of drug particle transport, dissolution, and diffusion were carried out to assess systemic exposure over a simulation time of 8 hours. A time step of 5 s was used, requiring n = 5760 time steps and 5 solution iterations at each time step.
Pharmacokinetic Model
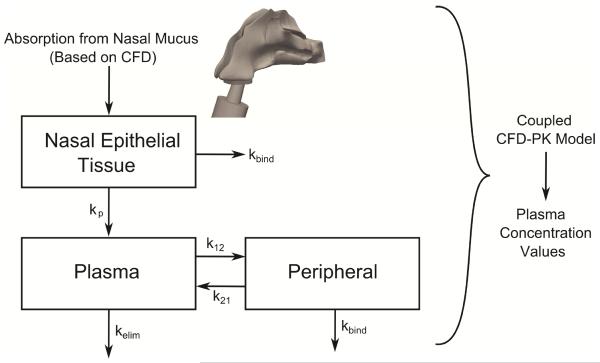
For the current study, the previously developed nasal-DAC model was extended to include a PK model to calculate systemic exposure over time. This model begins with the calculation of nasal epithelial drug uptake, described above, and implements a compartmental model to determine the resulting plasma concentration. As illustrated in Figure 4, drug uptake from the ASL is used to calculate the drug concentration in the epithelial tissue. First-order rate constants then govern drug transport from the nasal tissue to the plasma (kp), transport from the plasma into the peripheral tissue compartment (k12 and k21), drug binding to the glucocorticoid receptors (kbind), and metabolism and elimination of the drug (kelim). This compartmental model is similar in concept to those reported by Weber and Hochhaus35 and Gonda.36,37One unique aspect of the current model is the presence of kbind, which was needed in the current CFD simulations to obtain an accurate bioavailability. The need for kbind is likely due to the very high relative receptor affinity of MF reported in the literature,38 and this rate constant may become less significant for other steroids or drugs. Another difference is the presence of kp to describe the transport of drug from the nasal tissue to the plasma. Because the CFD model has already accounted for dissolution, absorption, and clearance, the value of kp is not expected to be similar to the absorption constant (ka) that is typically found in nasal PK studies.
Figure 4.
An illustration of the compartmental pharmacokinetic model is shown where initial Absorption from Nasal Mucus is provided by the CFD model on a spatially and temporally resolved basis. Drug is absorbed from the nasal mucus into the tissue, where it can distribute into the plasma (with first-order rate constant kp), distribute into the peripheral compartment (with rate constants k12 and k21), bind to glucocorticoid receptors (with rate constant kbind), or be metabolized or filtered (at a rate of kelim).
The process of determining the first-order rate constants (Figure 4) was aimed at matching in vivo PK data for an MF nasal spray.6 The study by Daley-Yates et al.6 reported the Cmax, tmax, and absolute bioavailability of an 800 μg dose of MF administered every eight hours by a nasal spray device to twelve subjects. The goal of the current validation study was to find values for kp, k12, k21, kbind, and kelim in the current PK model that would result in a plasma concentration curve with Cmax, tmax, and an absolute bioavailability in agreement with the in vivo data.
Using these calculated rate constants and the 800 μg administered dose of Daley-Yates et al,6 the post-deposition plasma concentration of MF administered by a nasal spray device was modeled over a simulation time of 8 hours under differing scenarios. Effects of the spray insertion angle, suspended particle size, inhalation during spraying, and the type of delivery device were all considered, as well as the possibility of nose blowing or wiping by the patient.
RESULTS
Determination of Pharmacokinetic Rate Constants
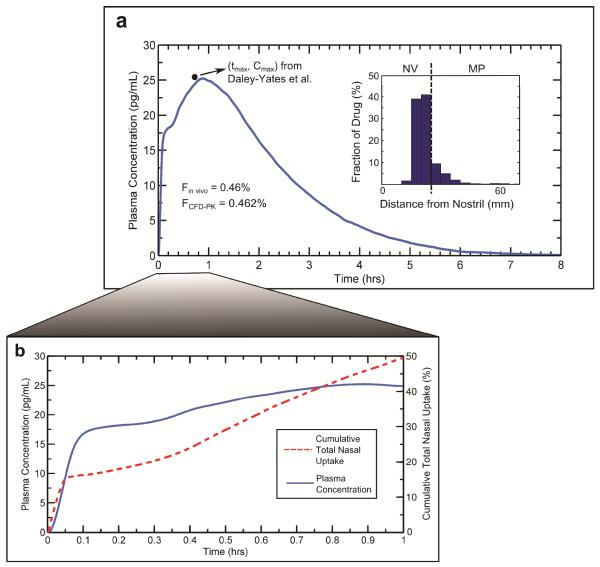
CFD calculations of nasal spray droplet deposition (described previously) at a 40° insertion angle were used to provide the particle deposition field in this rate constant and model validation study. After specifying the corresponding particle locations in the nasal-DAC model, simulations of particle transport, dissolution, diffusion, and absorption were coupled with the PK model to determine the plasma concentration over a simulation time of 8 hours. Setting the rate constants to kp= 2.16hr−1, k12 = 47.52hr−1, k21 = 2.16 hr−1, kbind = 2.88hr−1, and kelim= 0.119hr−1 resulted in the plasma concentration curve shown in Figure 5a. Also shown in this panel is the histogram illustrating the initial distribution of deposited drug mass in the nasal-DAC model. Quantitatively, the value of k12 is significantly larger than k21due to the lipophilic nature of MF, which gives it a high affinity for the tissue phase. The values of kbind and kelim govern the decay rate of the curve in Figure 5a. The comparatively high value of kbind is likely due to the large relative receptor affinity for MF reported in the literature,38 while the value of kelim was specified to match the typical elimination half-life of MF.28
Figure 5.
To determine the appropriate PK rate constants, the calculated plasma concentration profile was validated with in vivo data from Daley-Yates et al., 2004. Starting with the initial deposition profile given by the histogram in Panel (a), the simulated plasma concentration curve (a) provided a tmax, Cmax, and bioavailability in agreement with the in vivo data. Also shown in Panel (b) is the plasma concentration over the first hour, along with the cumulative drug uptake at the epithelium during this time. NV: Nasal vestibule; MP: Middle passages.
The Cmax and tmax in the concentration curve (Figure 5a) determined from the model predictions are approximately 25 pg/mL and 0.9 hrs, respectively, which are within the standard errors reported by Daley-Yates et al.6 Specifically, the inter-subject variability (reported as the mean ± standard error of the mean, SEM) observed in the in vivo study for Cmax and tmax were 25.5 ± 5.2 pg/mL and 0.75 ± 0.2 hrs, respectively. The absolute bioavailability of the nasally administered dose was calculated by
| (3) |
where AUCnasal and AUCIV are the area under the curve values for nasal and intravenous administration, respectively, and Dnasal and DIV are the nasal and intravenous doses, respectively. For comparison, the intravenous values used by Daley-Yates et al.6 were also used in the current study. The bioavailability calculated from the CFD plasma concentration curve was 0.46%, matching the 0.46% value reported by Daley-Yates et al.6 Accounting for the SEM of the AUC values reported in the in vivo study, the inter-subject variability of the bioavailability ranged from 0.26% - 0.65%.6
In Figure 5a there is a noticeable rapid rise in plasma concentration followed by a slower increase to Cmax; Figure 5b shows these plasma concentration peaks in more detail, along with the cumulative total nasal uptake of drug by the epithelium from the ASL (as a percentage of the total delivered dose). As shown by the initial rapid rise of the cumulative uptake curve, the drug particles deposited in the MP are rapidly absorbed within the first few minutes. Subsequently, there is a slower, steady uptake corresponding to drug transport from the NV to the MP. As described previously by Rygg and Longest,18 the connection of the NV and MP liquid layers provides a mechanism for this drug absorption over a longer time scale, where mucociliary motion in the MP slowly pulls NV liquid into the nasal cavity. In this manner, some drug deposited in the NV can reach the MP, where it is absorbed. Additionally, it was shown that the rate of MP mucus motion has a large effect on the amount of drug that is transported from the NV into the MP, providing a potentially significant source of variability in inter-individual dosage.18
In the plasma concentration curve, the rapid initial rise in concentration is a result of the rapid drug uptake within the first few minutes post-deposition. The following increase to Cmax reflects the absorption of drug crossing the NV/MP boundary. This indicates that the current PK model, coupled with the nasal-DAC model, is able to capture the transient systemic exposure of nasally administered drugs in a realistic manner. Here, it is worth mentioning that tmax is dependent on the initial deposition profile and the particle locations relative to the NV/MP boundary. In short, clustering of drug particles near this boundary (the dotted line in the histogram of Figure 5a) leads to an earlier tmax and larger Cmax. This relationship between particle deposition and peak concentrations will be discussed in more detail below, where additional deposition profiles are considered.
Effect of Nozzle Insertion Angle
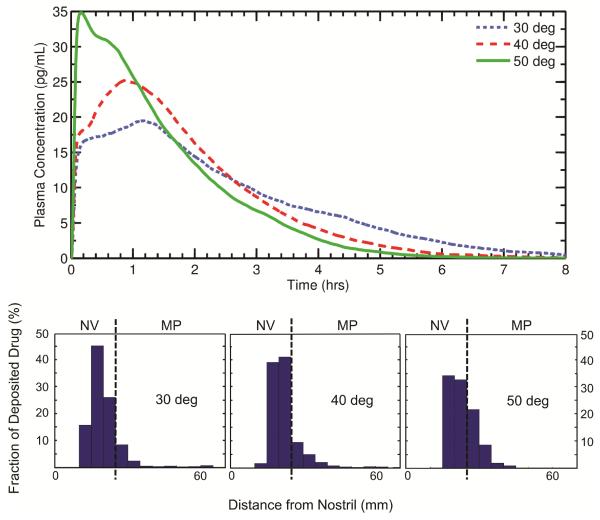
Figure 6 shows plasma concentration curves and the corresponding initial drug deposition profiles for various nozzle insertion angles, with a monodisperse suspended drug particle size of 3 μm. As shown in the figure, an increased amount of drug deposition in the MP (50°> 40°> 30°) leads to a larger plasma peak (Cmax) since more drug is rapidly absorbed during this initial phase. In the 50 degree case, the initial rapid absorption of drug in the MP dominates the time-dependent systemic exposure, and the overall tmax and Cmax are significantly earlier and higher, respectively, than those seen in the 30 and 40 degree cases.
Figure 6.
Plots of the calculated post-deposition plasma concentration are shown for three different nozzle insertion angles. The histograms illustrate the initial particle deposition profile used for each angle. The angle of the spray pump is shown to produce large differences in PK variables with all other parameters held constant. NV: Nasal vestibule; MP: Middle passages.
For the 30 and 40 degree cases, the shape of the plasma peak is a result of the distribution of drug in the NV. Because the plasma peak arises from the transport of drug from the NV to the MP, a clustering of drug near the NV/MP boundary (40 degrees) leads to bolus transfer to the MP and a sharper plasma peak compared to a case where the drug is more widely spread in the NV (30 degrees). In other words, when a large amount of drug is deposited near the NV/MP boundary, tmax will occur more quickly than when the drug is deposited over a larger portion of the NV.
To quantify the differences between these PK curves, the relative differences in the Cmax and tmax values were calculated. For two nozzle insertion angles, A and B, the relative difference was calculated as
| (4) |
where RD is the relative difference, and XA and XB represent either Cmax or tmax for angles A and B, respectively. Given this, the relative differences in Cmax and tmax for 30 and 40 degrees are 26% and 27%, respectively. Comparing 30 and 50 degrees, the relative differences in Cmax and tmax are 56% and 152%, respectively.
Overall, it can be observed that the location and magnitude of the plasma peak is governed by both the deposition fraction and drug distribution in the NV. For cases with high MP deposition (e.g. 50 degrees), the initial rise in plasma concentration dominates the overall systemic exposure. For cases with large deposition fractions in the NV (e.g. 30 and 40 degrees), the shape of the plasma peak is determined by the amount of drug in the NV and the degree of clustering of drug near the NV/MP boundary. That is, the plasma peak itself can be spread out or relatively narrow depending on the location of particle impaction.
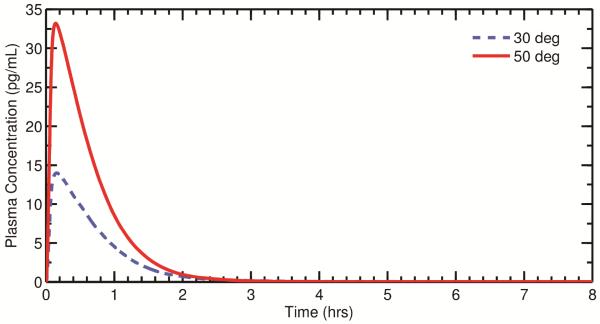
From Equation 3, the bioavailabilities for insertion angles of 30, 40, and 50 degrees were all calculated as 0.46%. It is clear that, despite the significantly different shapes of the plasma concentration curves (Figure 6), the overall bioavailability does not change as the insertion angle is varied. Thus, while the overall tmax and Cmax can change dramatically based on the degree of drug deposition in the MP, the overall measure of systemic exposure remains relatively constant if the drug is allowed to be absorbed over the full 8 hours, which would require not disturbing the dose in the NV through nose blowing or wiping. Considering that leaving the NV dose undisturbed for 8 hours is highly unlikely, the effects of different NV exposure times on PK parameters is evaluated later in this study.
Effect of Suspended Particle Size
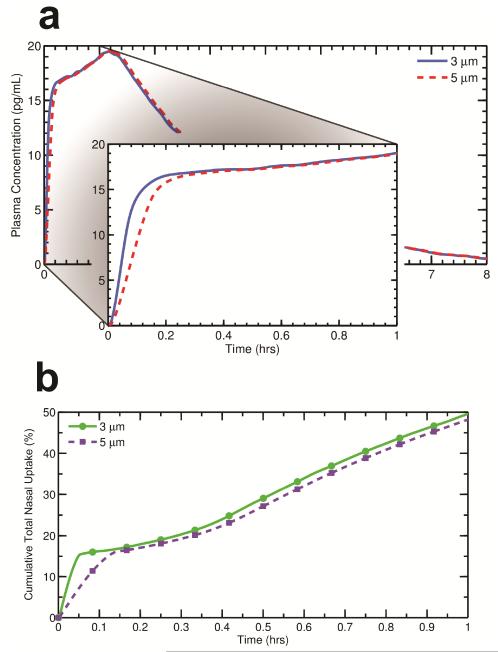
Figure 7a shows plasma concentration curves for two different monodisperse suspended drug particle sizes, 3 and 5 μm, resulting from nasal spray deposition at a 30 degree insertion angle (the corresponding deposition histogram can be seen in Figure 6). In these cases, the nasal spray droplets and drug dose are identical but the suspended drug particle geometric diameter is either 3 or 5 μm. As expected, the initial rise in plasma concentration takes slightly longer as the particle size becomes larger. Because larger particles take longer to dissolve, there is a slower initial uptake of drug by the epithelium when the particle diameter is increased (Figure 7b). As a result, drug from the larger particles is absorbed less quickly into the systemic circulation within the first few minutes. After ~10 mins, the cumulative epithelial uptake is very similar for the different particle sizes (Figure 7b); likewise, the corresponding plasma concentration curves are almost identical after the initial concentration rise. Relative differences in Cmax and tmax as a result of increasing the particle size from 3 μm to 5 μm were 0% and 2.2%, respectively.
Figure 7.
The plasma concentration profiles for two different initial suspended drug particle diameters are shown in Panel (a), with an inset enlarging the data over the first hour. Cumulative drug uptake at the epithelium for the same initial particle diameters is illustrated in Panel (b). In contrast with nozzle insertion angle, the initial size of the suspended drug particles in the spray droplets appears to have a small effect on PK variables.
Nasal Inhalation
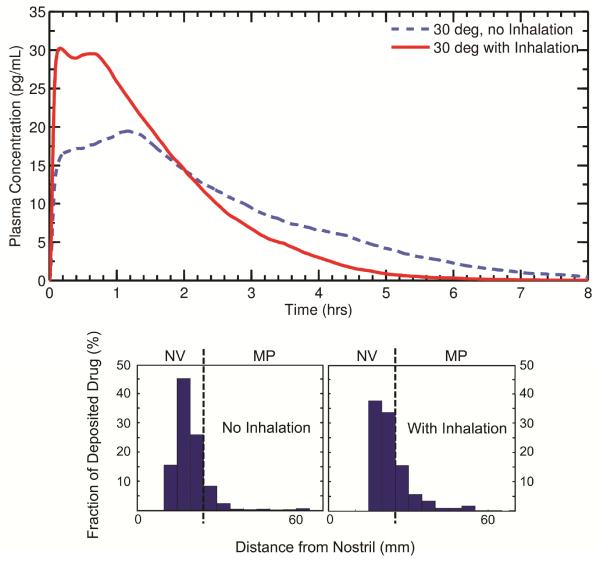
The effect of nasal inhalation at a flow rate of 38.5 LPM during nasal spray administration was investigated for a monodisperse particle size of 3 μm and a 30 degree insertion angle. As shown by the histograms in Figure 8, more drug is deposited in the MP when a patient inhales during spraying (29% drug mass deposition in the MP with inhalation compared to 13% MP deposition with no inhalation). In agreement with the results shown earlier, the increased drug penetration into the MP with inhalation leads to a relatively large Cmax (Figure 8). Interestingly, the clustering of particles near the NV/MP boundary during delivery with inhalation causes a small second plasma peak to occur, with a second tmax around 45 minutes. Relative differences in Cmax and tmax as a result of spray delivery with nasal inhalation (0 vs. 28.5 LPM) were 43% and 152%, respectively.
Figure 8.
Plasma concentration profiles are shown for two methods of nasal spray administration, one with inhalation during spraying and one without inhalation. Both cases used a 30 degree nozzle insertion angle. The histograms illustrate the initial particle deposition profile used for each scenario. As with spray pump angle, inhalation during spray delivery is observed to have a large impact on PK variables. NV: Nasal vestibule; MP: Middle passages.
Again, despite the significant differences between the two concentration curves, the absolute bioavailabilities with and without inhalation were both calculated as 0.46%. Therefore, it appears that as long as drug is allowed to be absorbed over the entire 8 hour course, differences in administration techniques do not significantly change the overall measure of systemic exposure.
Effect of Nose Blowing or Wiping
The previous study of Rygg and Longest18 investigated the change in nasal-tissue drug absorption caused by a discharge of drug through either nose blowing or wiping immediately after spray administration. This scenario represents a realistically conservative case, where an individual may expel some of the delivered drug through the nostril before it has a chance to reach the MP for absorption. Results of the previous study found that removing the drug particles located in the NV immediately after deposition eliminated the long-term uptake of drug, since no particles were transported from the NV to the MP.18 The corresponding change in plasma concentration and absolute bioavailability were investigated in the current study.
By expelling the NV drug particles immediately after deposition, drug absorption only occurred through the rapid uptake of particles deposited in the MP, leading to an early peak in plasma concentration within the first few minutes followed by a rapid distribution phase (Figure 9).Comparing the 30 and 50 degree insertion angles with removal of the NV dose, relative differences in Cmax and tmax were 81% and 10%, respectively.
Figure 9.
Plasma concentration profiles for two different nozzle insertion angles for the case when the patient removes the NV dose immediately after delivery due to nose wiping/blowing or sneezing. In these cases, particles in the NV were removed immediately after deposition to simulate discharge through the nostrils. Compared with Figure 6, patient behavior appears to further amplify observed changes in PK variables.
Unlike the previously considered cases, the absolute bioavailability changed significantly when particles were removed through the nostrils. Starting with drug deposition patterns for nozzle insertion angles of 30 and 50 degrees (see histograms in Figure 6), the immediate discharge of particles in the NV resulted in absolute bioavailabilities of 0.083% and 0.17%, respectively. In this scenario, increased deposition in the NV results in more drug being wiped away and a corresponding decrease in bioavailability.
To expand upon this idea further, nasal spray bioavailabilities (for insertion angles of 30 and 50 degrees) are estimated for drug particle residence times in the nasal vestibule of 0.5, 1, and 2 hours. Note that simulations were not run for these residence times, but the bioavailabilities are estimated from the PK curves in Figure 6. For particle residence times of 0.5, 1, and 2 hours at a 30 degree insertion angle, the bioavailabilities are approximately 0.12%, 0.18%, and 0.31% respectively. Likewise, for the same residence times and an insertion angle of 50 degrees, the estimated bioavailabilities are 0.24%, 0.32%, and 0.4%, respectively. These results (as well as those presented in Figure 9) further exemplify that localized deposition patterns do have an effect on overall systemic exposure when “early” discharge of drug particles through the nostrils (prior to 8 hours) is considered.
DISCUSSION
The results of this study quantify, for the first time, how regional differences in nasal drug deposition affect transient plasma concentrations and overall bioavailability. These findings are potentially useful for establishing bioequivalence for generic formulations and nasal spray devices by linking regional deposition data to time-dependent PK data, thus reducing the burden of in vivo clinical or pharmacodynamics testing. As discussed in the Introduction, determining bioequivalence requires multiple tests, two components of which are ensuring the same local delivery and same systemic exposure. The approach presented here is able to evaluate both of these components; i.e., the local delivery was validated with in vitro data, and the current CFD-PK model established systemic exposure. A future study that verifies local drug deposition and delivery with in vivo data would be useful in confirming these bioequivalence parameters.
As mentioned earlier, the current compartmental PK model is similar in concept to previous models developed by Weber and Hochhaus35 and Gonda.36,37 The previously established model by Gonda et al.36,37 includes compartments for the nonciliated anterior region of the nose, the posterior region of the nasal cavity, the gastrointestinal tract, and the systemic circulation. This type of compartmental model performs well in describing overall systemic exposure of a nasally administered drug. While the current PK model is derived from a similar concept, the total number of compartments is reduced due to the direct simulation of drug particle transport and dissolution by means of CFD.
Primary advantages of previous PK models developed for nasal spray36,37 exposure include a simple and generalized approach that includes lung and gastrointestinal tract compartments. Disadvantages of these models include a lack of knowledge regarding deposition within each airway region; no mechanism to understand how aerosol delivery properties (such as inhalation and spray angle) affect regional dose; and omission of the complex transport dynamics that affect dissolution, absorption, and clearance in the ASL. The new CFD-PK model seeks to improve upon these disadvantages by simulating the delivery and absorption processes with a first principles approach. As a result, the new CFD-PK model provides the advantages of directly evaluating the effects of particle size or spray angle on regional dose and systemic exposure, for the first time. Capturing the transport related details leading to differences in systemic exposure as a function of spray angle or nasal inhalation would not have been possible with the previous more general PK models. However, the CFD-PK model, in its current form, is less general than previously developed pharmaceutical aerosol PK tools in that it lacks gastrointestinal and lung exposure compartments. Expansion of the PK components are clearly needed for cases in which gastrointestinal and lung exposure are expected to contribute to the PK profile and systemic exposure.
The location and magnitude of the plasma concentration peaks were correlated with the amount of drug deposited in the MP and the impaction locations around the NV/MP boundary. Given these observations, the overall shape of the PK curve can be used to infer performance characteristics of a nasal spray device regarding in vivo deposition, if sufficient pharmacokinetic samples in the temporal region of interest are available. Furthermore, as the plasma peak is often a result of drug transport from the NV to the MP, changes in tmax could also be used to assess the certain physiological conditions in the nose, such as impaired mucociliary clearance.
The quick initial rise in plasma concentration has some potential implications for in vivo PK testing. For instance, the magnitude of the initial rise in plasma concentration could be greatly underestimated if plasma samples are not drawn frequently within the first few minutes following administration. This is especially true for cases with high deposition fractions in the MP. The results presented here highlight the importance of ensuring that in vivo studies collect data at appropriate intervals to accurately capture transient changes in plasma drug concentrations.
As the suspended particle size in the nasal spray was increased, the overall shape of the PK curve remained virtually the same, although a slightly slower initial rise in plasma concentration was observed. However, the previous study by Rygg et al.19 showed significant differences in regional epithelial absorption for suspended particle sizes ranging from 1-5 μm in diameter. In the previous study, larger particles were carried further by mucociliary clearance before fully dissolving, resulting in more uniform distribution of drug over the nasal epithelium. Based on the current results, the suspended particle size in a nasal spray formulation may be optimized (below the limit of 5 μm particles considered in this study) to treat localized conditions without the need to consider corresponding changes in systemic exposure.
Importantly, results of the current study showed that absolute bioavailability was independent of the method of nasal drug administration, provided that all of the drug remained in the nose for the full 8 hours. Realistically this is unlikely to occur, as an individual is likely to sneeze, blow their nose, or wipe their nostrils within this time frame, eliminating some or all of the drug in the NV. The simulations showed that removal of the drug in the NV significantly decreased the absolute bioavailability. Thus, expected behavioral routines (e.g. sneezing, nose blowing, etc.) must be considered when assessing the overall bioavailability of nasally administered drugs in pharmacokinetic studies. As discussed in the previous study by Rygg and Longest,18 methods of nasal drug administration that target deep drug penetration within the nasal cavity may be beneficial in reducing variability associated with delivered dosage and uptake rates. Sniffing after nasal spray application may also largely affect the uptake and plasma concentration curve, but was not considered in this study.
Elaborating on the previous paragraph, the 8 hour residence time considered in these simulations is only theoretical, and is likely to be an unrealistic extreme in a typical setting. In vivo, fluid production by the nasal mucosa to enhance mucociliary clearance would decrease the residence time of drug particles in the nasal cavity. For drugs poorly absorbed in the gastrointestinal tract or with high first-pass metabolism (such as MF), this would reduce the overall systemic exposure. At a certain point, a sufficient amount of mucus would be created to require discharge by nose blowing or wiping. This transient response to nasal spray deposition would, in most cases, result in expulsion of drug particles at post-deposition time scales smaller than 8 hours. Viewed another way, results of the current study indicate that with expected variations in nasal inhalation and spray insertion angle, bioavailability is equivalent only if nose blowing and wiping is delayed for 8 hours, which is understood to not be reasonable.
Although the current CFD and PK model provides a better understanding of the relationship between nasal spray deposition patterns and systemic absorption, several limitations should be noted. First, the current model represents a simplified surface of the complex three dimensional nasal airways. At this stage, the simplified surface model is unable to show if deposited drug enters the sinuses or reaches the olfactory epithelium (which is important when considering drugs that are envisioned to act on the central nervous system).39,40 In addition to simplifying the properties of the drug, this study considered a monodisperse suspended particle size in each of the simulations; however, many suspension formulations likely contain polydisperse distributions of suspended drug particles within a polydisperse droplet spray. Only one nasal clearance velocity condition was considered to represent average adult conditions,19 but high variability is expected in the rate of MP nasal clearance, which is largely affected by airway health and disease.41 Finally, the current PK model is a simplified three-compartment model with first-order rate constants. While the current model was able to closely match in vivo PK data from a nasal spray device,6 a more sophisticated model may be needed in the future. Additional in vivo data that specifies both plasma concentration and the corresponding initial drug deposition profile (e.g., through 3D imaging) would contribute to further in silico model development and validation. However, it is noted that the nasal deposition patterns predicted with the CFD model were previously validated with comparisons to in vitro deposition profiles across a range of spray conditions.12,18
CONCLUSION
The current study showed that regional differences in nasal drug deposition can have a significant effect on the shape and characteristics of the plasma concentration profile, but very little effect on overall bioavailability provided the deposited dose is not disturbed. Using these results, connections can be made between measured PK data and the performance of a nasal spray device. The location and magnitude of the plasma concentration peak is highly dependent on the regional deposition of nasal spray droplets. With regards to formulation properties, the suspended drug particle size was shown to have very little effect on systemic exposure for the size range and lipophilic drug considered in this study. Finally, it was found that absolute bioavailability is highly dependent on individual behavioral differences post-spray administration. That is, nose blowing or wiping within an 8 hour period, which can result in removal of drug from the NV, has the potential to significantly reduce the absorbed dosage, especially for nasal spray devices that fail to deliver drug to the MP. Overall, these findings could potentially be used to establish bioequivalence for generic formulations and nasal spray devices by relating regional drug deposition data to time-dependent PK data. As a result, simulations such as these may reduce the burden of in vitro testing or in vivo radiological imaging techniques when developing and testing generic devices.
ACKNOWLEDGMENTS
Dr. Geng Tian is gratefully acknowledged for his part in developing the NMT and nasal spray pump model during his time as a postdoc at Virginia Commonwealth University. This study was supported by Award U01 FD004570 and Contract HHSF223201310223C from the US FDA. The content is solely the responsibility of the authors and does not necessarily represent the official views of the US FDA.
ABBREVIATIONS
- ASL
airway surface liquid
- AUC
area under the curve
- CFD
computational fluid dynamics
- DAC
dissolution, absorption, and clearance
- DF
deposition fraction
- MDI
metered dose inhaler
- MF
mometasone furoate
- MP
middle passages
- NV
nasal vestibule
- PK
pharmacokinetic
- SEM
standard error of the mean
Footnotes
Author Disclosure Statement
No conflicts of interest exist.
Publisher's Disclaimer: This is a PDF file of an unedited manuscript that has been accepted for publication. As a service to our customers we are providing this early version of the manuscript. The manuscript will undergo copyediting, typesetting, and review of the resulting proof before it is published in its final citable form. Please note that during the production process errors may be discovered which could affect the content, and all legal disclaimers that apply to the journal pertain.
References
- 1.Davit BM, Nwakama PE, Buehler GJ, Conner DP, Haidar SH, Patel DT, Yang Y, Lawrence XY, Woodcock J. Comparing Generic and Innovator Drugs: A Review of 12 Years of Bioequivalence Data from the United States Food and Drug Administration. Annals of Pharmacotherapy. 2009;43(10):1583–1597. doi: 10.1345/aph.1M141. [DOI] [PubMed] [Google Scholar]
- 2.Li BV, Jin F, Lee SL, Bai T, Chowdhury B, Caramenico HT, Conner DP. Bioequivalence for Locally Acting Nasal Spray and Nasal Aerosol Products: Standard Development and Generic Approval. The AAPS Journal. 2013;15(3):875–883. doi: 10.1208/s12248-013-9494-2. [DOI] [PMC free article] [PubMed] [Google Scholar]
- 3.Suman JD, Laube BL, Dalby R. Validity of in vitro Tests on Aqueous Spray Pumps as Surrogates for Nasal Deposition, Absorption, and Biologic Response. Journal of Aerosol Medicine. 2006;19(4):510–521. doi: 10.1089/jam.2006.19.510. [DOI] [PubMed] [Google Scholar]
- 4.Lee SL, Lawrence XY, Cai B, Johnsons GR, Rosenberg AS, Cherney BW, Guo W, Raw AS. Scientific Considerations for Generic Synthetic Salmon Calcitonin Nasal Spray Products. The AAPS journal. 2011;13(1):14–19. doi: 10.1208/s12248-010-9242-9. [DOI] [PMC free article] [PubMed] [Google Scholar]
- 5.Affrime MB, Cuss F, Padhi D, Wirth M, Pai S, Clement RP, Lim J, Kantesaria B, Alton K, Cayen MN. Bioavailability and Metabolism of Mometasone Furoate following Administration by Metered-Dose and Dry-Powder Inhalers in Healthy Human Volunteers. The Journal of Clinical Pharmacology. 2000;40(11):1227–1236. [PubMed] [Google Scholar]
- 6.Daley-Yates P, Kunka R, Yin Y, Andrews S, Callejas S, Ng C. Bioavailability of Fluticasone Propionate and Mometasone Furoate Aqueous Nasal Sprays. European Journal of Clinical Pharmacology. 2004;60(4):265–268. doi: 10.1007/s00228-004-0763-y. [DOI] [PubMed] [Google Scholar]
- 7.Derendorf H, Munzel U, Petzold U, Maus J, Mascher H, Hermann R, Bousquet J. Bioavailability and Disposition of Azelastine and Fluticasone Propionate when Delivered by MP29-02, a Novel Aqueous Nasal Spray. British Journal of Clinical Pharmacology. 2012;74(1):125–133. doi: 10.1111/j.1365-2125.2012.04222.x. [DOI] [PMC free article] [PubMed] [Google Scholar]
- 8.Daley-Yates PT, Price AC, Sisson JR, Pereira A, Dallow N. Beclomethasone Dipropionate: Absolute Bioavailability, Pharmacokinetics and Metabolism Following Intravenous, Oral, Intranasal and Inhaled Administration in Man. British Journal of Clinical Pharmacology. 2001;51(5):400–409. doi: 10.1046/j.0306-5251.2001.01374.x. [DOI] [PMC free article] [PubMed] [Google Scholar]
- 9.Edsbäcker S, Andersson K-E, Ryrfeldt Å . Nasal Bioavailability and Systemic Effects of the Glucocorticoid Budesonide in Man. European Journal of Clinical Pharmacology. 1985;29(4):477–481. doi: 10.1007/BF00613465. [DOI] [PubMed] [Google Scholar]
- 10.McDowall J, Mackie A, Ventresca G, Bye A. Pharmacokinetics and Bioavailability of Intranasal Fluticasone in Humans. Clinical Drug Investigation. 1997;14(1):44–52. [Google Scholar]
- 11.Shah SA, Berger RL, McDermott J, Gupta P, Monteith D, Connor A, Lin W. Regional Deposition of Mometasone Furoate Nasal Spray Suspension in Humans. Allergy and Asthma Proceedings. 2015;36(1):48–57. doi: 10.2500/aap.2015.36.3817. [DOI] [PubMed] [Google Scholar]
- 12.Azimi M, Longest PW, Hindle M. Towards Clinically Relevant In Vitro Testing of Locally Acting Nasal Spray Suspension Products. Respiratory Drug Delivery Europe. 2015;1:121–130. [Google Scholar]
- 13.Kimbell JS, Subramaniam RP. Use of Computational Fluid Dynamics Models for Dosimetry of Inhaled Gases in the Nasal Passages. Inhalation Toxicology. 2001;13(5):325–334. doi: 10.1080/08958370151126185. [DOI] [PubMed] [Google Scholar]
- 14.Zhang Z, Kleinstreuer C, Kim CS. Transport and Uptake of MTBE and Ethanol Vapors in a Human Upper Airway Model. Inhalation Toxicology. 2006;18(3):169–184. doi: 10.1080/08958370500434172. [DOI] [PubMed] [Google Scholar]
- 15.Tian G, Longest PW. Development of a CFD Boundary Condition to Model Transient Vapor Absorption in the Respiratory Airways. Journal of Biomechanical Engineering. 2010;132(5):051003. doi: 10.1115/1.4001045. [DOI] [PubMed] [Google Scholar]
- 16.Tian G, Longest PW. Transient Absorption of Inhaled Vapors into a Multilayer Mucus-Tissue-Blood System. Annals of Biomedical Engineering. 2010;38(2):517–536. doi: 10.1007/s10439-009-9808-9. [DOI] [PubMed] [Google Scholar]
- 17.Bush ML, Frederick CB, Kimbell JS, Ultman JS. A CFD PBPK Hybrid Model for Simulating Gas and Vapor Uptake in the Rat Nose. Toxicology and Applied Pharmacology. 1998;150(1):133–145. doi: 10.1006/taap.1998.8407. [DOI] [PubMed] [Google Scholar]
- 18.Rygg A, Longest PW. Absorption and Clearance of Pharmaceutical Aerosols in the Human Nose: Development of a CFD Model. Journal of Aerosol Medicine and Pulmonary Drug Delivery. 2015 doi: 10.1089/jamp.2015.1252. [DOI] [PMC free article] [PubMed] [Google Scholar]
- 19.Rygg A, Hindle M, Longest PW. Absorption and Clearance of Pharmaceutical Aerosols in the Human Nose: Effects of Nasal Spray Suspension Particle Size and Properties. Pharmaceutical Research. 2015 doi: 10.1007/s11095-015-1837-5. [DOI] [PMC free article] [PubMed] [Google Scholar]
- 20.Xi J, Si X, Kim JW, Berlinski A. Simulation of Airflow and Aerosol Deposition in the Nasal Cavity of a 5-Year-Old Child. Journal of Aerosol Science. 2011;42(3):156–173. [Google Scholar]
- 21.Xi J, Longest PW. Numerical Predictions of Submicrometer Aerosol Deposition in the Nasal Cavity Using a Novel Drift Flux Approach. International Journal of Heat and Mass Transfer. 2008;51(23-24):5562–5577. [Google Scholar]
- 22.Fry FA, Black A. Regional Deposition and Clearance of Particles in the Human Nose. Journal of Aerosol Science. 1973;4(2):113–124. [Google Scholar]
- 23.Illum L. Nasal Drug Delivery - Possibilities, Problems and Solutions. Journal of Controlled Release. 2003;87(1-3):187–198. doi: 10.1016/s0168-3659(02)00363-2. [DOI] [PubMed] [Google Scholar]
- 24.Mistry A, Stolnik S, Illum L. Nanoparticles for Direct Nose-to-Brain Delivery of Drugs. International Journal of Pharmaceutics. 2009;379(1-2):146–157. doi: 10.1016/j.ijpharm.2009.06.019. [DOI] [PubMed] [Google Scholar]
- 25.Ugwoke MI, Agu RU, Verbeke N, Kinget R. Nasal Mucoadhesive Drug Delivery: Background, Applications, Trends and Future Perspectives. Advanced Drug Delivery Reviews. 2005;57(11):1640–1665. doi: 10.1016/j.addr.2005.07.009. [DOI] [PubMed] [Google Scholar]
- 26.Cu Y, Saltzman WM. Mathematical Modeling of Molecular Diffusion Through Mucus. Advanced Drug Delivery Reviews. 2009;61(2):101–114. doi: 10.1016/j.addr.2008.09.006. [DOI] [PMC free article] [PubMed] [Google Scholar]
- 27.Gulliver JS. Introduction to Chemical Transport in the Environment. Cambridge University Press; 2007. [Google Scholar]
- 28.Merck Nasonex Product Monograph. http://www.merck.ca/assets/en/pdf/products/NASONEX-PM_E.pdf.
- 29.Sugano K, Okazaki A, Sugimoto S, Tavornvipas S, Omura A, Mano T. Solubility and Dissolution Profile Assessment in Drug Discovery. Drug Metabolism and Pharmacokinetics. 2007;22(4):225–254. doi: 10.2133/dmpk.22.225. [DOI] [PubMed] [Google Scholar]
- 30.Arora D, Shah KA, Halquist MS, Sakagami M. In vitro Aqueous Fluid-Capacity-Limited Dissolution Testing of Respirable Aerosol Drug Particles Generated from Inhaler Products. Pharmaceutical Research. 2010;27(5):786–795. doi: 10.1007/s11095-010-0070-5. [DOI] [PubMed] [Google Scholar]
- 31.Beule AG. Physiology and Pathophysiology of the Paranasal Sinuses. GMS Current Topics in Otorhinolaryngology - Head and Neck Surgery. 2010;9 doi: 10.3205/cto000071. [DOI] [PMC free article] [PubMed] [Google Scholar]
- 32.Schipper NGM, Verhoef JC, Merkus FWHM. The Nasal Mucociliary Clearance: Relevance to Nasal Drug Delivery. Pharmaceutical Research. 1991;8(7):807–814. doi: 10.1023/a:1015830907632. [DOI] [PubMed] [Google Scholar]
- 33.Pires Ai, Fortuna A, Alves G, Fal1 ao Ai. Intranasal Drug Delivery: How, Why and What For? Journal of Pharmacy and Pharmaceutical Sciences. 2009;12(3):288–311. doi: 10.18433/j3nc79. [DOI] [PubMed] [Google Scholar]
- 34.FDA Nasonex Product Information. http://www.accessdata.fda.gov/drugsatfda_docs/label/2002/20762s11lbl.pdf.
- 35.Weber B, Hochhaus G. A Pharmacokinetic Simulation Tool for Inhaled Corticosteroids. The AAPS Journal. 2013;15(1):159–171. doi: 10.1208/s12248-012-9420-z. [DOI] [PMC free article] [PubMed] [Google Scholar]
- 36.Gonda I. Mathematical Modeling of Deposition and Disposition of Drugs Administered via the Nose. Advanced Drug Delivery Reviews. 1998;29(1):179–184. doi: 10.1016/s0169-409x(97)00068-9. [DOI] [PubMed] [Google Scholar]
- 37.Gonda I, Gipps E. Model of Disposition of Drugs Administered into the Human Nasal Cavity. Pharmaceutical Research. 1990;7(1):69–75. doi: 10.1023/a:1015891727080. [DOI] [PubMed] [Google Scholar]
- 38.Valotis A, Neukam K, Elert O, Högger P. Human Receptor Kinetics, Tissue Binding Affinity, and Stability of Mometasone Furoate. Journal of Pharmaceutical Sciences. 2004;93(5):1337–1350. doi: 10.1002/jps.20049. [DOI] [PubMed] [Google Scholar]
- 39.Illum L. Transport of Drugs from the Nasal Cavity to the Central Nervous System. European Journal of Pharmaceutical Sciences. 2000;11(1):1–18. doi: 10.1016/s0928-0987(00)00087-7. [DOI] [PubMed] [Google Scholar]
- 40.Hanson LR, Frey WH. Intranasal Delivery Bypasses the Blood-Brain Barrier to Target Therapeutic Agents to the Central Nervous System and Treat Neurodegenerative Disease. BMC Neuroscience. 2008;9(Suppl 3):S5. doi: 10.1186/1471-2202-9-S3-S5. [DOI] [PMC free article] [PubMed] [Google Scholar]
- 41.Illum L. Nasal Clearance in Health and Disease. Journal of Aerosol Medicine. 2006;19(1):92–99. doi: 10.1089/jam.2006.19.92. [DOI] [PubMed] [Google Scholar]


