Abstract
The aim of this study was to reveal mechanisms responsible for nitrogen (N) stress in two contrasting Populus clones. Leaves of Nanlin 1388 (N stress-insensitive clone hybrids of Populus deltoides Bart.CV. × Populus euramericana (Dode) Guineir CV) and Nanlin 895 (N stress-sensitive clone hybrids of Populus deltoides Bart.CV. × Populus euramericana (Dode) Guineir CV) were harvested and analyzed. Different responses visible in photosynthesis, N and carbon contents, physiological traits, and chlorophyll were observed. The Solexa/Illumina’s digital gene expression system was used to investigate differentially expressed miRNAs and mRNAs under N stress. Target profiling, and biological network and function analyses were also performed. Randomly selected mRNAs and miRNAs were validated by quantitative reverse transcription polymerase chain reaction. In all, 110 Nanlin 1388 and 122 Nanlin 895 miRNAs were differentially expressed, among which 34 and 23 miRNAs were newly found in the two clones, respectively. Under N stress, a total of 329 and 98 mRNAs were regulated in N stress-insensitive and -sensitive clones, respectively. Notably, the miR396 family and its regulated mRNAs were altered in both clones under N stress, while miR646 was regulated only in the N stress-insensitive clone (Nanlin 1388), and miR156, miR319 and miR393 in the N stress-sensitive clone (Nanlin 895). Gene ontology and Kyoto Encyclopedia of Genes and Genomes analyses also proved several clone-specific functions and pathways. These findings may be significant for understanding the genetic responses of Populus to N stress.
Keywords: gene expression profiling, miRNAs
Introduction
Nitrogen (N) is essential for plant growth and development. It is a constituent of amino acids, nucleic acids, chlorophyll and several plant hormones, and a pivotal regulator involved in many biological processes, including carbon metabolism, amino acid metabolism and protein synthesis (Frink et al. 1999, Crawford and Forde 2002). In higher plants, changes in these processes result in dramatic effects on plant growth and development, such as root branching, leaf chlorosis and the production of fewer seeds (Stitt 1999, Good et al. 2004). Nitrogen is generally the most common limiting nutrient for growth and it must be abundantly available. Nitrogen metabolism can be regulated by changes in the mRNA abundance of several components involved in N uptake and N assimilation. A negative feedback regulation results in upregulation at the transcript level when the N status of plants is low, and in downregulation at the transcript level when the N status is high (Gazzarrini et al. 1999, Cerezo et al. 2001). Nitrogen metabolism also responds quickly to external stimulation by rapid posttranscriptional protein modifications. Posttranscriptional regulation of mRNA translation and stability by miRNAs has been shown to play an important role in plants’ N responses (Vidal and Gutierrez 2008). Therefore, understanding the molecular basis of plants’ responses to N deficiency and identifying N responsive genes whose expression can be manipulated to enable plants to use N more efficiently have become important research subjects.
Nitrogen deficiency has a considerable impact on plant development. Plants can take up and assimilate inorganic N in the form of ammonium () and nitrate (). From the Populus trichocarpa genome, 14 ammonium and 79 nitrate transporters have been putatively identified (Plett et al. 2010, Bai et al. 2013). Additionally, physiological and gene expression analyses have been conducted for Populus under N- and phosphorus (P)-deficient conditions (Gan et al. 2016). Studies on the growth and morphological responses of Populus clones under different N levels have also been reported, it was found that added N could help mitigate the negative effects of tree competition (Mamashita et al. 2015). However, there is limited information about the transcriptional and miRNA regulation in poplars exposed to N starvation.
miRNAs are small (20–24 nt), non-translated RNAs found to be processed from the stem-loops of precursor miRNAs in plants and animals (Bonnet et al. 2006, Mallory and Vaucheret 2006, Zhang et al. 2006, Sunkar et al. 2007). They often negatively regulate posttranscriptional gene expression by partial base-pairing to their complementary mRNA (Lee et al. 1993, Carrington and Ambros 2003, Bartel 2004). The miRNAs play critical roles at each major stage of plant development (Jones-Rhoades et al. 2006) and they are also involved in the coordination of nutrient homeostasis. For example, low sulfate levels strongly induce miR395, but it is repressed under P limitation, miR398 responds to copper deprivation and is repressed under a combined limitation of N and P, and miR399 has been found or predicted to increase drastically in low-phosphate conditions in Arabidopsis and other plant species (Fujii et al. 2005, Aung et al. 2006, Bari et al. 2006, Chiou et al. 2006, Sunkar et al. 2006, Chiou 2007, Buhtz et al. 2008, Doerner 2008, Hsieh et al. 2009, Pant et al. 2009). However, the expression and function of miRNAs in different Populus plants still remain unclear. In this study, the Solexa/Illumina’s digital gene expression system (Blow 2009, Morrissy et al. 2009) was used to investigate differentially expressed miRNAs and mRNAs in response to N stress in two contrasting clones of Populus. Interactions and possible functions of miRNAs and mRNAs were also analyzed.
In our study, Nanlin 1388 (Populus × euramericana CV. Nanlin 1388, N stress-insensitive clone) and Nanlin 895 (Populus × euramericana CV., Nanlin 895, N stress-sensitive clone) were employed. Different responses in photosynthesis, N and carbon contents, physiological traits, and chlorophyll were observed. The Solexa/Illumina’s digital gene expression system was used to investigate differentially expressed miRNAs and mRNAs under N stress. Target profiling, and biological network and function analyses were also performed. The aim was to reveal mechanisms responsible for N stress responses in two contrasting Populus clones.
Materials and methods
Plant materials and experimental design
One-year-old stems of two Populus clones (2 cm in diameter) were cut into 20-cm-long pieces according to Gan et al. (2016). The used clones were as follows: (i) N stress-insensitive clone, Nanlin 1388 and (ii) N stress-sensitive clone, Nanlin 895. Both of them are hybrids of Populus deltoides Bart. CV. × Populus euramericana (Dode) Guineir CV. developed by the Poplar Research and Development Center in Nanlin. Nitrogen stress sensitivity differences were defined based on the photosynthetic parameters of the two Populus clones according to a previous study, which showed that photosynthetic parameters were affected by nutrient deficiencies (N and P) in Populus cathayana Rehd. (Zhang et al. 2014). The experiments were performed in the city of Guiyang, China, which is from 106°07′ to 107°17′ east longitude and from 26°11′ to 27°22′ north latitude.
Branches were separated from parent plants and then cultured for 30 days in the sterile Hoagland medium (Fodor et al. 2005), which contains 1.25 mM KNO3, 1.25 mM Ca(NO3)2⋅4H2O, 0.5 mM MgSO4⋅7H2O, 0.25 mM KH2(PO4), 11.6 µM H3BO3, 4.6 µM MnCl2⋅4H2O, 0.19 µM ZnSO4⋅7H2O, 0.12 µM Na2MoO4⋅2H2O, 0.08 µM CuSO4⋅5H2O and 10 µM Fe(III)-Ethane-1,2-diyldinitrilo tetraacetic acid (EDTA). Then, the branches were divided into a control group and N stress group. Each treatment consisted of three biological replicates (three plants). Plants in the control group were cultured in the normal Hoagland medium, while plants in the N stress group were cultured in a medium without N (1.25 mM KCl, 1.25 mM CaCl2, 0.5 mM MgSO4⋅7H2O, 0.25 mM KH2(PO4), 11.6 µM H3BO3, 4.6 µM MnCl2⋅4H2O, 0.19 µM ZnSO4⋅7H2O, 0.12 µM Na2MoO4⋅2H2O, 0.08 µM CuSO4⋅5H2O and 10 µM Fe(III)-EDTA)) for 30 days. The growth medium was refreshed every 3 days. The culturing conditions were light 16 h, dark 8 h and temperature 25 °C. In order to reduce the influence of the environment, planting pots were regularly rotated. At the end of the treatment, undamaged, fully unfolded newly sprouted leaves were harvested and stored at −80 °C for the Solexa profiling of miRNAs and mRNAs.
Measurements of photosynthetic responses
Leaf gas exchange was determined simultaneously with measurements of chlorophyll fluorescence using the open gas exchange system Li-6400 (LI-COR Inc., Lincoln, NE, USA) and an attached LED light source (6400-02) in a climatronic phytotron, as described by He et al. (2011). Photosynthesis was induced with saturating light (1500 μmol m−2 s−1) and 400 ± 5 μmol mol−1 CO2 surrounding the leaf. Leaf temperature was maintained at 25 °C, and the relative air humidity was ∼50% in all measurements. The net photosynthetic rate (Pn) and variable and maximum fluorescence (Fv/Fm) were measured, as previously described (Flexas et al. 2002).
Measurements of chlorophyll responses
Samples for chlorophyll determination were taken from leaves using a 0.8-cm-diameter cork borer and weighted quickly in clean preweighted glass vials, after which 5 ml of 80% acetone was added to these samples. The leaf material was bleached and decanted, as described by Linchenthaler and Wellburn (1983). The optical density was read at λ = 663, 646 and 470 nm by a spectrophotometer (Spectronic Genesys-5, Milton Roy, New York, USA) using 80% acetone as a blank. Contents of chlorophyll a and chlorophyll b (μg g−1) were calculated using the following formulae: chlorophyll a = 12.21 OD663 − 2.81 OD646; chlorophyll b = 20.13 OD646 − 5.03 OD663 (Linchenthaler and Wellburn 1983).
Assays of antioxidant enzyme activities
A total of 100 mg of the N-starved and control samples was collected from three individual plants and weighed. The activities of superoxide dismutase (SOD), catalase (CAT) and glutamine synthetase (GS) were measured with corresponding kits (S0102, S0051 and S0055, respectively, Beyotime, Beijing, China). The peroxidase (POD) activity was measured with a plant POD assay kit (A084-3, Nanjing Jiancheng Bioengineering Institute, Nanjing, China). Reactive oxygen species (ROS) were examined with a plant ROS ELISA kit (BH8990, Boyao, Shanghai, China). The adenosine triphosphate (ATP) concentration was measured with a plant ATP ELISA kit (ml091201, MLBio, Shanghai, China). All examinations were carried out according to the manufacturers’ instructions.
Measurements of N and carbon responses
Newly sprouted leaves of plants stressed for 3 months were harvested and divided into three groups, dried at 80 °C until the weight was constant and ground through a 20-mesh screen. Then, 1 g of each sample was analyzed for total N via Dumas combustion using a LECO FP-428 Determinator (LECO Corporation, St Joseph, MO, USA), and 1 g of each sample was analyzed for the total organic carbon according to the method described by Cavani et al. (2003).
RNA extraction, Solexa sequencing, read processing and sequence alignment
Total RNA was extracted with TRIzol Reagent (Invitrogen, San Diego, CA, USA) according to the manufacturer’s instruction. The mRNA libraries were constructed with NEBNext® Ultra™ RNA Library Prep Kit (NEB, CA, USA). Briefly, mRNA was purified using oligo(dT) magnetic beads and fragmented, followed by cDNA synthesis with random hexamers. The products then underwent end repair, adapter ligation and gel purification (2% tris base, acetic acid and EDTA gel electrophoresis) to isolate 200-nt fragments. Gel bands containing cDNA were purified using the QIAquick Gel Extraction Kit (Qiagen, Shanghai, China), and DNA was amplified by polymerase chain reaction (PCR). The program was 94 °C, 2 min, followed by 15 cycles of 94 °C, 15 s; 62 °C, 30 s; 72 °C, 30 s, and then hold at 72 °C for 10 min, after which the products were stored at 4 °C. The libraries were quantified using an Agilent Bioanalyzer 2100 (Agilent Technologies, Inc., Santa Clara, CA, USA). Each library was sequenced using an Illumina HiSeq™ 2000 platform (Illumina, San Diego, CA, USA), generating 50-nt paired-end reads. The miRNA library was established with TruSeq Small RNA Library Prep Kit (RS-930-1020, Illumine, Shenzhen, China). Briefly, 18- to 30-nt RNAs were isolated with 15% tetrabutylurea gels, then 3′ and 5′ adapters were ligated, followed by reverse transcription (RT)-PCR amplification. The program was 98 °C, 30 s, followed by 12 cycles of 98 °C, 10 s; 60 °C, 30 s; 72 °C, 30 s, and then hold at 72 °C for 10 min, after which the products were electrophoresed with 6% polyacrylamide gel electrophoresis to isolate 136- to 148-nt fragments. Each library was quantified and sequenced, similarly to the mRNA library. After data processing, raw reads were quality-controlled by removing 3′ adaptor/primer sequences, empty reads and low-quality reads. At the same time, Q30 (read accuracy higher than 99.9%) and the guanine and cytidine-content were calculated. The filtered high-quality reads were aligned against the poplar genome (Populus trichocarpa v3.0, ftp://ftp.jgi-psf.org/pub/compgen/phytozome/v9.0/Ptrichocarpa/) using TopHat 2.0.9, which uses Bowtie for alignment (Trapnell et al. 2012). Mismatch of no more than 1 bp was taken into account for the differences between species. Clean reads mapped to reference sequences from multiple genes were filtered. The remaining clean reads were assembled into transcripts and their relative abundances were estimated as fragments per kilobase of exon per million fragments mapped using the Cufflinks software (Trapnell et al. 2012). Pair comparisons were used to analyze the normalized data from the four types of samples (NIC, N stress-insensitive clone in the control group; NSC, N stress-sensitive clone in the control group; NIS, N stress-insensitive clone in the N stress group; and NSS, N stress-sensitive clone in the N stress group). Statistical significances of the identified, differentially expressed genes were tested using a rigorous algorithm described previously (San Lucas et al. 2012). The genes were taken to be differentially expressed when P < 0.05.
miRNA target prediction
The prediction of miRNA targets was performed with psRobot (v1.2) web-based software. Such miRNA–mRNA target expression pairs were chosen that were considered to have significant expression after respective comparisons, as described above. Then, the expression regulation networks of the selected pairs were constructed by defining the target pair interaction between miRNA and its target gene. Each expression network was further merged with the respective biological network, which was constructed from the Reactome Functional Interaction containing all mRNA genes resulting from the same expression set. The biological network of the miRNA–mRNA target plus the first-degree neighbor of the mRNA target were selected as the miRNA-targeted gene regulatory network. Pathway and gene ontology (GO) term enrichment was further performed, as stated below.
Determination of GO categories
We performed GO analyses to determine the functions of differentially expressed genes in our sequencing data according to the key functional classification of the National Center for Biotechnology Information. Generally, the Fisher’s exact test and the χ2 test were applied to classify GO categories, and the false discovery rates (FDR, FDR = 1 – Nk/T) were calculated to correct P-values (Nk refers to the number of Fisher’s test P-values less than the χ2 test P-values). The enrichment Re was given by: Re = (nf/n)/(Nf/N) for significant categories (Nf is the number of differentially expressed genes within a particular category, n is the total number of genes within the same category, nf is the number of differentially expressed genes in the entire sequencing data and N is the total number of sequenced genes).
Kyoto Encyclopedia of Genes and Genomes pathway analyses
Pathway annotations of differentially expressed genes were obtained from Kyoto Encyclopedia of Genes and Genomes (KEGG) (http://www.genome.jp/kegg/). Pathway categories with FDR <0.01 were marked. The enrichment of significant pathways was given by: enrichment = (ng/na)/(Ng/Na), which enabled us to locate more significant pathways (ng is the number of differentially expressed genes within a particular pathway; na is the total number of genes within the same pathway; Ng is the number of differentially expressed genes, which have at least one pathway annotation and Na is the number of genes, which have at least one pathway annotation in the entire sequencing).
Reverse transcription and real-time quantitative PCR
Expression levels of specific mRNAs were validated by real-time RT-PCR. Briefly, cDNAs were reverse transcribed from RNA samples using SuperScript III reverse transcriptase (Life Technologies, Gaithersburg, MD, USA). Then, quantitative PCR (qPCR) was performed using a 7500 Fast PCR machine (Life Technologies) with Taq DNA polymerase and SYBR green I nucleic A reagents (Life Technologies). The quantification of miRNAs was conducted by the qPCR method, as described by Varkonyi-Gasic et al. (2007). The expression levels were quantified using methods (Li et al. 2012). Primers used in the study are listed in Table S1 available as Supplementary Data at Tree Physiology Online. The overall correlation analysis between qRT-PCR and RNA-seq or miRNA-seq was conducted as in Yu et al. (2014).
Statistical analysis
Physiological data were analyzed using SPSS 18.0 (SPSS Inc., Chicago, IL, USA). Differences were considered as statistically significant at the P < 0.05 level.
Results
Physiological differences under N stress
After N stress for 30 days, photosynthetic responses (Pn and Fv/Fm), N and carbon contents (total carbon and total N), chlorophyll contents (Chla/b and total chlorophyll (TC)) and physiological traits (total protein, POD, CAT, SOD, GS, ATP and ROS) were measured in the control and N stress groups of Populus. Under normal conditions, no significant differences in Pn, Fv/Fm, Chla/b and TC concentrations were detected between Nanlin 1388 and Nanlin 895 (Table 1). Under N stress, Pn and Fv/Fm did not change in Nanlin 1388, while they decreased dramatically in Nanlin 895 (P < 0.05). Among chlorophyll responses, Chla/b and TC decreased significantly in both Nanlin 1388 and Nanlin 895 under N stress, but differences between the clones were not statistically significant (P < 0.05, Table 1).
Table 1.
Photosynthetic differences in responses to N stress in two Populus clones. Different letters indicate statistically significant differences between treatments (means ± SE, n = 3) at P < 0.05 according to Duncan multiple range tests. Pn, net photosynthesis rate; Fv/Fm, variable and maximum fluorescence; Chla/b, chlorophyll a/b ratio; TC, total chlorophyll content.
| Pn (μmol m−2 s−1) | Fv/Fm | Chla/b | TC (mg g−1 FW) | |
|---|---|---|---|---|
| Control | ||||
| Nanlin 1388 | 8.74 ± 0.35a | 0.82 ± 0.002a | 2.75 ± 0.20a | 3.00 ± 0.05a |
| Nanlin 895 | 8.68 ± 0.43a | 0.81 ± 0.003a | 2.68 ± 0.06a | 3.29 ± 0.05a |
| N stress | ||||
| Nanlin 1388 | 9.13 ± 0.36a | 0.80 ± 0.004a | 2.35 ± 0.12b | 1.82 ± 0.15b |
| Nanlin 895 | 5.29 ± 0.16b | 0.77 ± 0.015b | 2.25 ± 0.10b | 1.68 ± 0.11b |
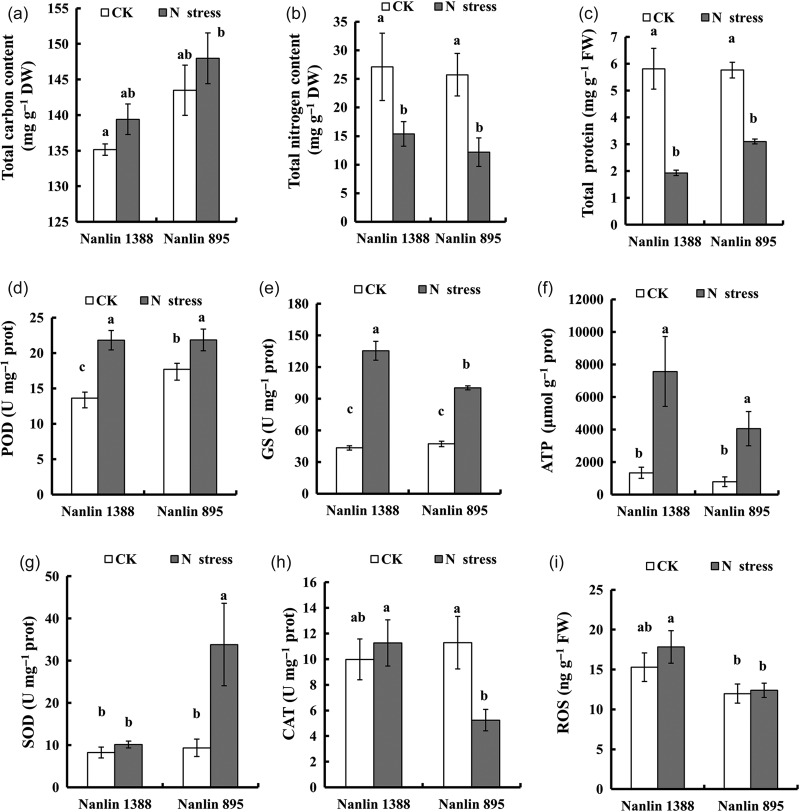
Under normal conditions, physiological traits were similar, except for POD, which showed a higher activity in Nanlin 895 than in Nanlin 1388. Under N stress, the total carbon content slightly increased in both clones, but the changes were not statistically significant (Figure 1a). The total N content decreased in both clones under N stress when compared with the control (Figure 1b). Among physiological responses, the total protein concentration decreased in both clones under N stress. Peroxidase, GS and ATP increased in both clones under N stress, SOD increased in Nanlin 895 under N stress and CAT decreased in Nanlin 895 under N stress (P < 0.05, Figure 1c–h). Reactive oxygen species did not change in Nanlin 1388, but it decreased significantly in Nanlin 895 under N stress (Figure 1i).
Figure 1.
Physiological clonal differences under N stress in P. euramericana. (a and b) Differences in N and carbon responses between Nanlin 1388 and Nanlin 895. (c–i) Physiological responses. POD, peroxidase; GS, glutamine synthetase; ATP, adenosine triphosphate; SOD, superoxide dismutase; CAT, catalase; ROS, reactive oxygen species; CK, normal growth condition; N stress, nitrogen stress.
Deep sequencing of miRNAs and mRNAs
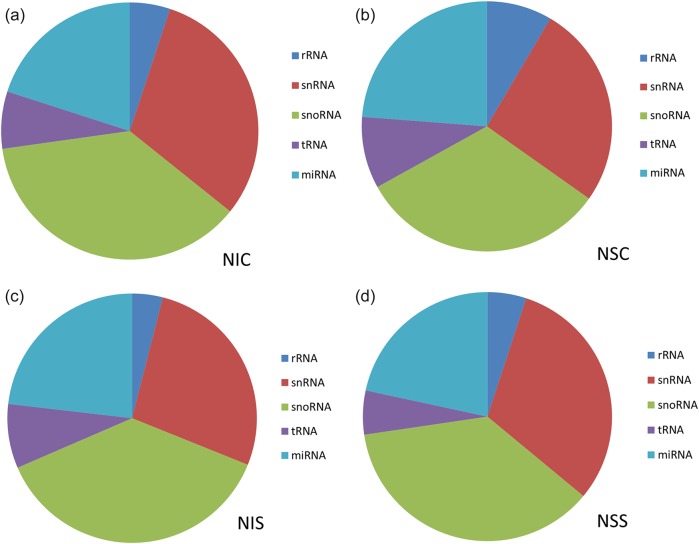
To explore potential mechanisms of plants’ responses to N stress, high-throughput sequencing was utilized to analyze miRNA and mRNA profiles in Nanlin 895 and Nanlin 1388 clones under N stress and control conditions. For small RNAs (sRNAs), >14 million reads were obtained for plants in control conditions and >15 million reads for plants exposed to N stress. Among the reads, 93.04 and 70.09%, and 67.52 and 89.91% perfectly matched the genomes of Nanlin 895 and Nanlin 1388 in control and N stress conditions, respectively (see Table S2 available as Supplementary Data at Tree Physiology Online). To assess the efficiency of deep sequencing for the detection of miRNAs, all reads were annotated and matched to rRNAs, snRNAs, snoRNAs, tRNAs and miRNAs (Figure 2 and see Tables S3 and S4 available as Supplementary Data at Tree Physiology Online).
Figure 2.
Categories of sRNAs identified in Nanlin 1388 and Nanlin 895 clones under control and N stress conditions. (a) NIC, N stress-insensitive clone Nanlin 1388 under control condition; (b) NSC, N stress-sensitive clone Nanlin 895 under control condition; (c) NIS, N stress-insensitive clone Nanlin 1388 under N stress condition; and (d) NSS, N stress-sensitive clone Nanlin 895 under N stress condition.
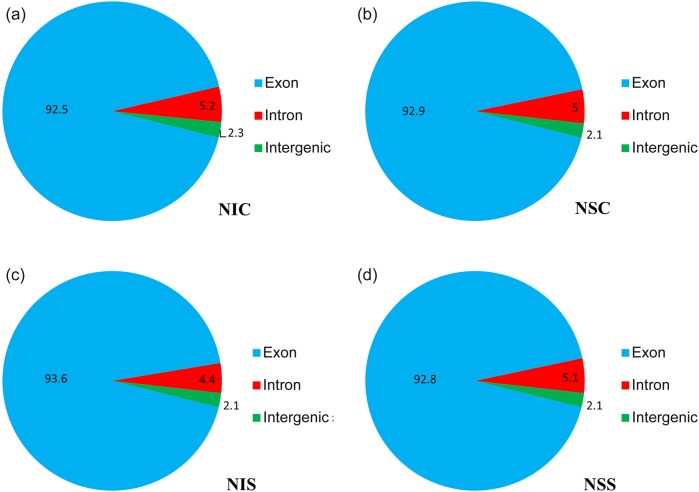
The largest proportion of sRNAs were 21 nt in length, followed by 20–23 nt, consistent with the 20–23 nt range of mature miRNAs (Figure 3). The results from the analysis for known miRNA regions in Nanlin 895 and Nanlin 1388 are shown in Table S5 available as Supplementary Data at Tree Physiology Online. For mRNAs, a total of 8,692,889 and 9,733,375 reads, and 8,870,556 and 8,267,070 reads were obtained for Nanlin 895 and Nanlin 1388 in control and N stress conditions, respectively. Among them, 88.85 and 89.03%, and 88.82 and 88.75% were mapped to the genomes of Nanlin 895 and Nanlin 1388 in control and N stress conditions, respectively (see Table S6 available as Supplementary Data at Tree Physiology Online). The coverage of mapping reads is shown in Figure 4.
Figure 3.
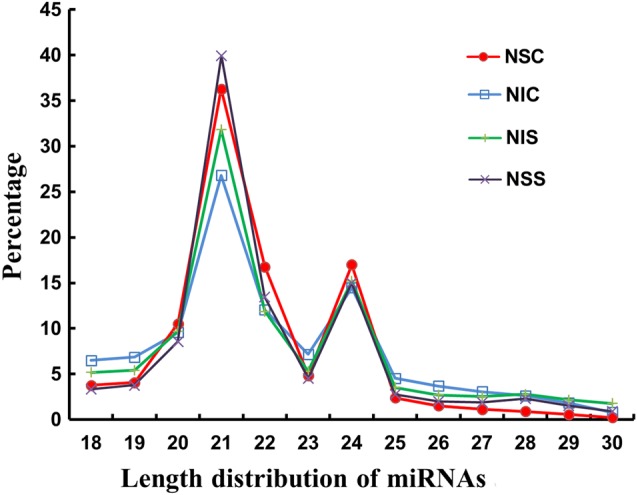
Length distribution of miRNAs in P. euramericana. NIC, N stress-insensitive clone Nanlin 1388 under control condition; NIS, N stress-insensitive clone Nanlin 1388 under N stress condition; NSC, N stress-sensitive clone Nanlin 895 under control condition; NSS, N stress-sensitive clone Nanlin 895 under N stress condition.
Figure 4.
Mapping reads coverage of mRNA sequencing in Nanlin 1388 and Nanlin 895 clones under control and N stress conditions. (a) NIC, N stress-insensitive clone Nanlin 1388 under control condition; (b) NSC, N stress-sensitive clone Nanlin 895 under control condition; (c) NIS, N stress-insensitive clone Nanlin 1388 under N stress condition; and (d) NSS, N stress-sensitive clone Nanlin 895 under N stress condition.
Overview of miRNAs and gene expression as affected by N stress
As summarized in Table 2, 110 (53 upregulated and 57 downregulated) and 122 (97 upregulated and 25 downregulated) differentially expressed miRNAs were identified in the two Populus clones in response to N stress, respectively. The populations of N stress-regulated miRNAs showed significant differences between the clones. Only 14 miRNAs (9 upregulated and 5 downregulated) were regulated in a similar manner. On the other hand, 81 (36 upregulated and 45 downregulated in the N stress-insensitive clone Nanlin 1388) and 93 (81 upregulated and 12 downregulated in the N stress-sensitive clone Nanlin 895) miRNAs showed differential expression levels in response to N stress in one clone only. In addition, there were 15 miRNAs (8 upregulated in Nanlin 1388 but downregulated in Nanlin 895, 7 downregulated in Nanlin 895 but upregulated in Nanlin 1388) that were regulated reversely in the two clones under N stress. Detailed profiles of N stress-regulated miRNAs are listed in Tables S7–S10 available as Supplementary Data at Tree Physiology Online, in which we give the names and relative expression levels of known and novel N stress-regulated miRNAs mentioned in Table 2.
Table 2.
Nitrogen stress-regulated miRNA and mRNA profiles in P. euramericana.
| miRNA |
mRNA | |||
|---|---|---|---|---|
| Previously known miRNAs | Unknown miRNAs | Total | ||
| Nanlin 1388 | ||||
| Upregulated | 25 | 28 | 53 | 231 |
| Downregulated | 51 | 6 | 57 | 98 |
| Total | 76 | 34 | 110 | 329 |
| Nanlin 895 | ||||
| Upregulated | 87 | 10 | 97 | 27 |
| Downregulated | 12 | 13 | 25 | 71 |
| Total | 99 | 23 | 122 | 98 |
| Similarly regulated in both clones | ||||
| Upregulated | 8 | 1 | 9 | 7 |
| Downregulated | 5 | 0 | 5 | 26 |
| Total | 13 | 1 | 14 | 33 |
| Selectively regulated in different clones | ||||
| Regulated in Nanlin 1388 only | ||||
| Upregulated | 15 | 21 | 36 | 221 |
| Downregulated | 39 | 6 | 45 | 72 |
| Total | 54 | 27 | 81 | 293 |
| Regulated in Nanlin 895 only | ||||
| Upregulated | 72 | 9 | 81 | 20 |
| Downregulated | 5 | 7 | 12 | 42 |
| Total | 77 | 16 | 93 | 62 |
| Reversely regulated in different clones | ||||
| Upregulated in Nanlin 1388 but downregulated in Nanlin 895 | 2 | 6 | 8 | 3 |
| Downregulated in Nanlin 1388 but upregulated in Nanlin 895 | 7 | 0 | 7 | 0 |
| Total | 9 | 6 | 15 | 0 |
Profiles of differentially expressed mRNAs under N stress were also analyzed. As shown in Table 2, 329 (231 upregulated and 98 downregulated) and 98 (27 upregulated and 71 downregulated) mRNAs were found to be regulated by N stress in Nanlin 1388 or Nanlin 895 clones, respectively. Among them, only 33 (7 upregulated and 26 downregulated) were regulated similarly in the two clones, but 293 (221 upregulated and 72 downregulated) and 62 (20 upregulated and 42 downregulated) were regulated only in Nanlin 1388 or Nanlin 895, respectively. There were three mRNAs that were upregulated in Nanlin 1388 but downregulated in Nanlin 895 under N stress. Detailed profiles are listed in Tables S11–S14 available as Supplementary Data at Tree Physiology Online, in which we give the gene IDs, arabidopsis genome initiative annotations, function descriptions and relative expression levels of predicted N stress-regulated mRNAs mentioned in Table 2.
Quantitative RT-PCR validation of differentially expressed mRNAs and miRNAs
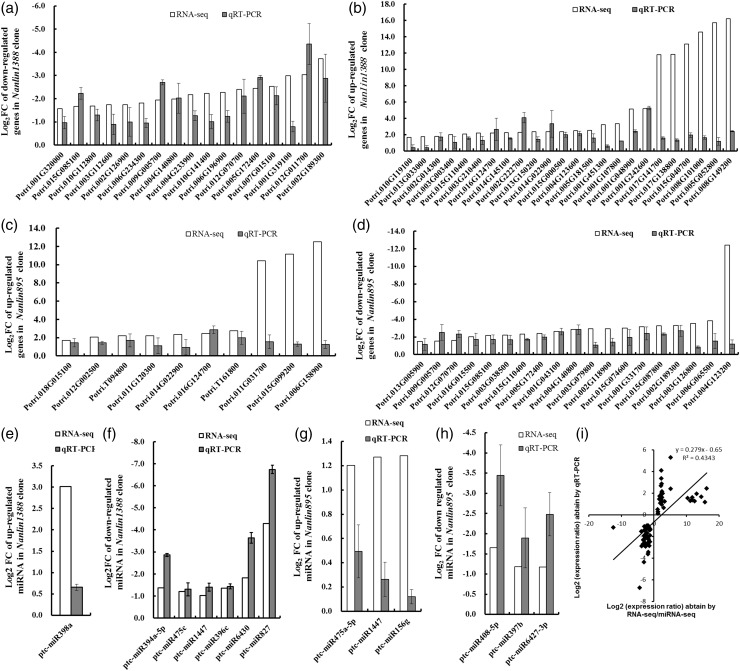
Several up- and downregulated mRNAs and miRNAs were randomly selected and their expression was determined with real-time RT-PCR. As shown in Figure 5, the results were generally consistent between sequencing and RT-PCR, although there were some genes differing in alteration degrees. A total of 75 genes (including mRNAs and miRNAs) were analyzed, and a linear regression analysis showed an overall correlation coefficient of R = 0.659 between transcript levels assayed by the two detection systems, demonstrating the reliability of the RNA-seq or miRNA-seq profiling (Figure 5i).
Figure 5.
Quantitative RT-PCR validation of differentially expressed mRNAs in P. euramericana. (a) Downregulated mRNAs in Nanlin 1388, (b) upregulated mRNAs in Nanlin 1388, (c) upregulated mRNAs in Nanlin 895, (d) downregulated mRNAs in Nanlin 895, (e) upregulated miRNAs in Nanlin 1388, (f) downregulated miRNAs in Nanlin 1388, (g) upregulated miRNAs in Nanlin 895 and (h) downregulated miRNAs in Nanlin 895. (i) Correlation of the gene expression ratios obtained from qRT-PCR and microarray data. The qRT-PCR log2 value of the expression ratio (y-axis) has been plotted against the value from the microarray (x-axis). Data were expressed as log2FC (fold change), FC value corresponding to N stress expression vs control expression.
miRNA target prediction and integration of mRNA and miRNA expression profiles
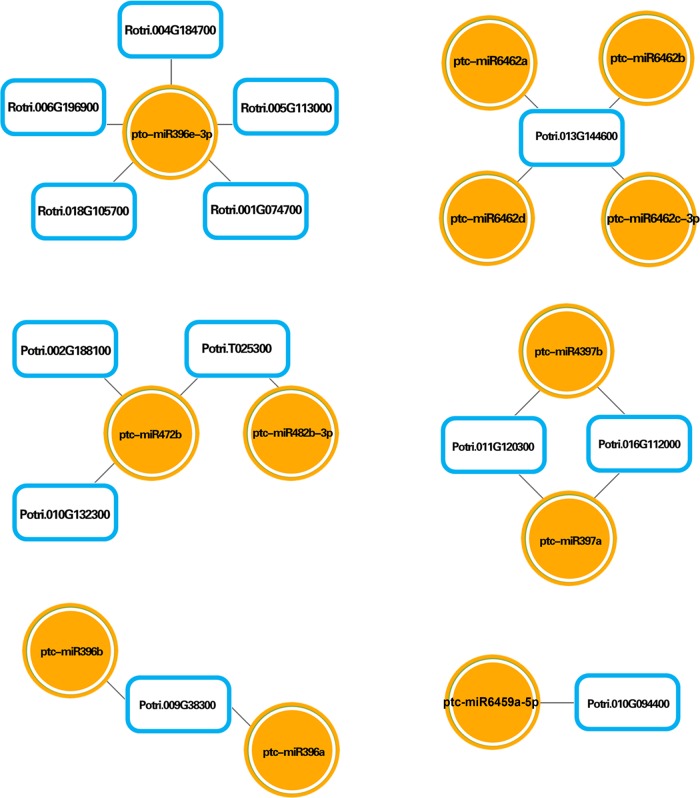
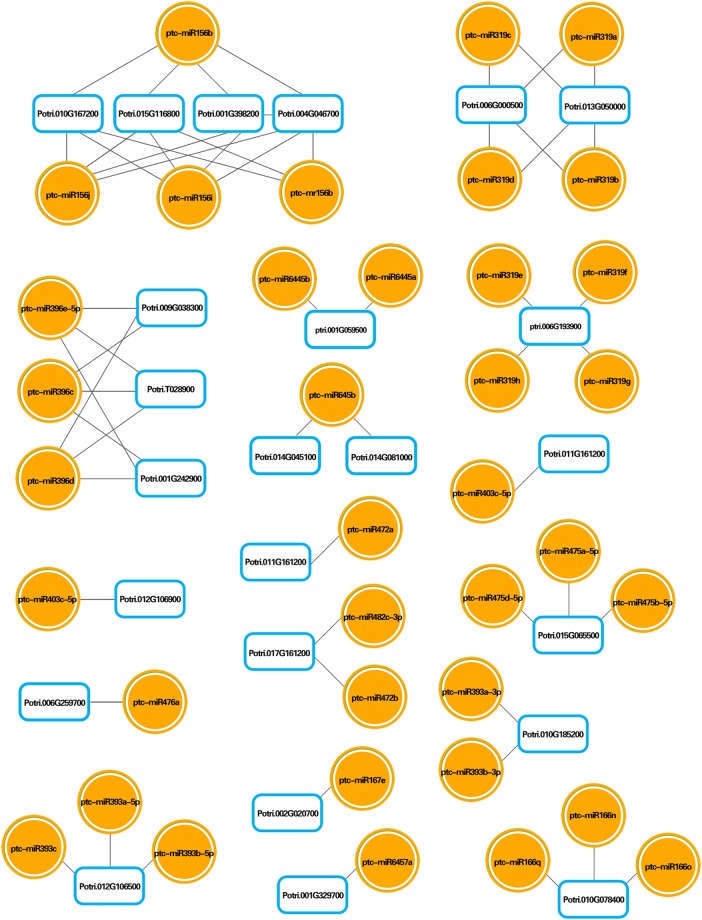
Predictions of miRNA targets, as well as an integrated analysis among differentially expressed miRNAs and mRNAs under N stress, were performed with psRobot (v1.2) web-based software. As shown in Figures 6 and 7, several integrated miRNA–mRNA networks, with correspondingly regulated miRNAs and mRNAs, were identified in both the N stress-insensitive clone Nanlin 1388 and the N stress-sensitive clone Nanlin 895. Notably, the miR396 family and its corresponding mRNAs were shown to be regulated under N stress in both clones. On the other hand, several miRNA families with their corresponding mRNAs were regulated only in one clone, mainly miR646 families in Nanlin 1388, and miR156, miR319 and miR393 families in Nanlin 895. Therefore, the profiles of differentially expressed miRNAs and mRNAs showed that under N stress, the N stress-insensitive clone Nanlin 1388 and the N stress-sensitive clone Nanlin 895 undergo different mechanisms involving various miRNA and mRNA expression changes to adapt to environmental changes.
Figure 6.
Interaction network between mRNA and miRNA expression profiles in Nanlin 1388 under N stress. Circles indicate differentially expressed miRNAs and boxes indicate differentially expressed mRNAs.
Figure 7.
Interaction network between mRNA and miRNA expression profiles in Nanlin 895 under N stress. Circles indicate differentially expressed miRNAs and boxes indicate differentially expressed mRNAs.
Gene ontology analysis of differentially expressed miRNAs and mRNAs
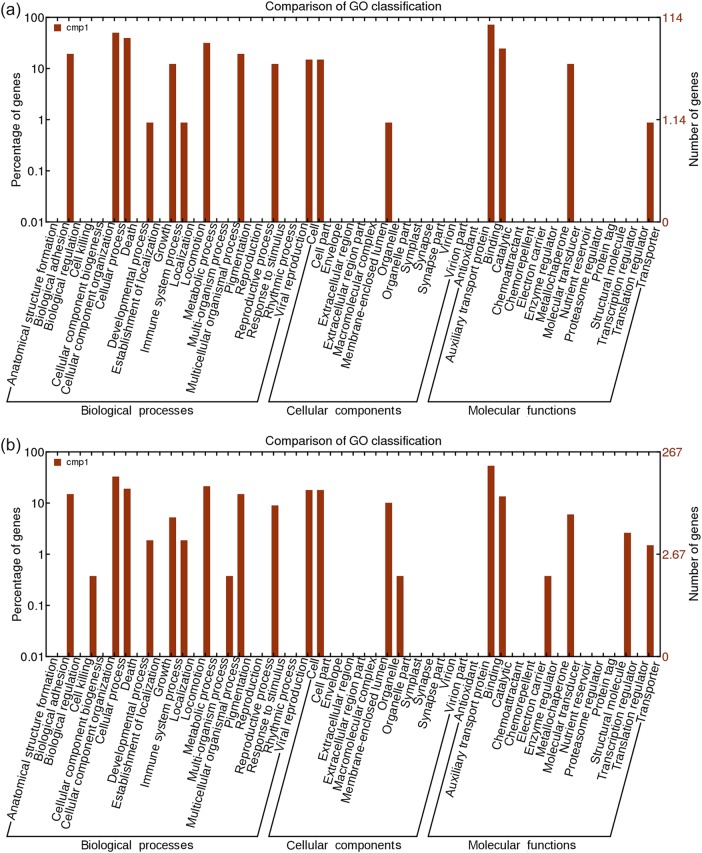
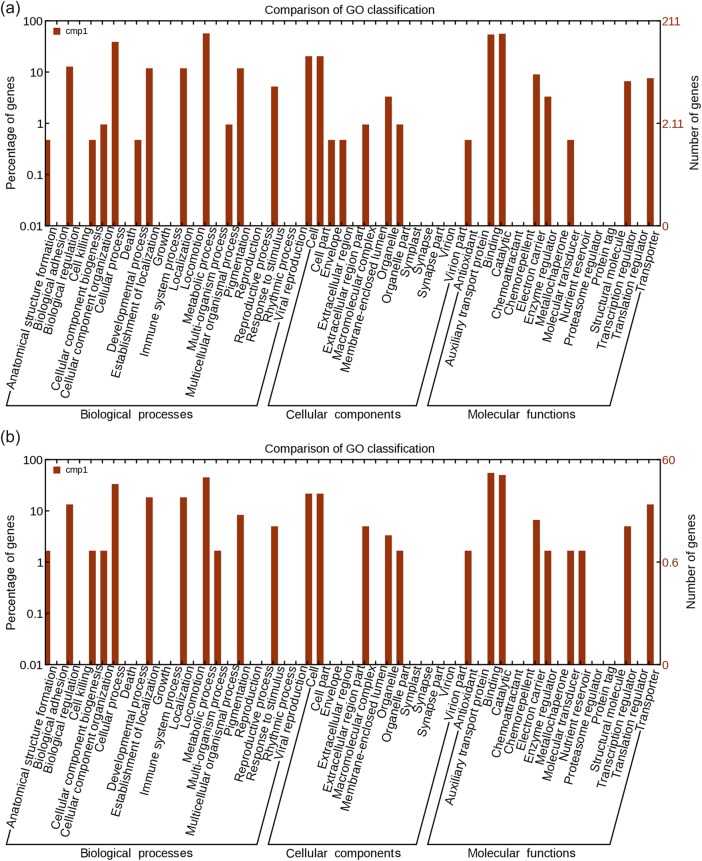
All differentially expressed genes were classified into different functional categories according to the GO project for biological processes, cellular components and molecular function. We first analyzed GO categories for downregulated target mRNAs of known upregulated miRNAs in the N stress-insensitive clone Nanlin 1388 and in the N stress-sensitive clone Nanlin 895. Most categories were shared by both clones. However, a few more predicted functions were found in Nanlin 895 (Figure 8). We also analyzed GO categories for differentially expressed mRNAs in the two contrasting Populus clones, Nanlin 1388 and Nanlin 895. Again, only a few functions were found to show clonal differences (Figure 9).
Figure 8.
Gene ontology categories of downregulated target mRNAs of known upregulated miRNAs in P. euramericana. (a) Nanlin 1388 under N stress and (b) Nanlin 895 under N stress.
Figure 9.
Gene ontology categories of differentially expressed mRNAs in P. euramericana. (a) Nanlin 1388 under N stress and (b) Nanlin 895 under N stress.
Kyoto Encyclopedia of Genes and Genomes pathway analysis of differentially expressed miRNAs and mRNAs
The KEGG pathway analysis showed that the top-rated pathways, which contain most differentially expressed mRNAs, include flavonoid biosynthesis, N metabolism, biosynthesis of secondary metabolites, chemical carcinogenesis and isoquinoline alkaloid biosynthesis in the N stress-insensitive clone Nanlin 1388, but flavonoid biosynthesis, plant hormone signal transduction, mineral absorption, and N, porphyrin and chlorophyll metabolism in the N stress-sensitive clone Nanlin 895 (Table 3). We also analyzed the pathways that contain downregulated target mRNAs of upregulated miRNAs. However, the P and Q values of the pathways were both 1 (see Table S15 available as Supplementary Data at Tree Physiology Online).
Table 3.
Top five differentially expressed mRNA pathways in P. euramericana as analyzed by KEGG.
| Clone | Map | P | Q | Name |
|---|---|---|---|---|
| Nanlin 1388 | map00941 | 5.05E−06 | 0.001556 | Flavonoid biosynthesis |
| map00910 | 0.000396232 | 0.06102 | Nitrogen metabolism | |
| map01110 | 0.002298845 | 0.218906 | Biosynthesis of secondary metabolites | |
| map05204 | 0.002842931 | 0.218906 | Chemical carcinogenesis | |
| map00950 | 0.005122167 | 0.315525 | Isoquinoline alkaloid biosynthesis | |
| Nanlin 895 | map00941 | 0.005363 | 0.680387 | Flavonoid biosynthesis |
| map04075 | 0.005379 | 0.680387 | Plant hormone signal transduction | |
| map04978 | 0.007725 | 0.680387 | Mineral absorption | |
| map00910 | 0.00957 | 0.680387 | Nitrogen metabolism | |
| map00860 | 0.011045 | 0.680387 | Porphyrin and chlorophyll metabolism |
Discussion
In the present study, expression profiles of miRNAs and mRNAs were analyzed under N stress in the N stress-insensitive clone Nanlin 1388 and in the N stress-sensitive clone Nanlin 895 and compared with those under control conditions. Differences in photosynthetic responses and oxidative stress reactions were detected between the two contrasting clones growing with or without N stress. Net photosynthetic rate, Fv/Fm and POD activities were lower in Nanlin 895 than in Nanlin 1388 under N stress (Table 1 and Figure 1). The results showed that Nanlin 895 is more sensitive to N stress than Nanlin 1388.
The high-throughput sequencing results showed that Nanlin 895 and Nanlin 1388 have significantly different miRNA and mRNA profiles, which undergo changes under N stress. In addition, an integrated analysis identified several main miRNA–mRNA networks, and GO and KEGG analyses identified several biological functions and pathways that are potentially responsible for N stress reactions in Populus clones. It has been reported that miR396 targets growth regulating factor genes, as well as bHLH74, which encodes a transcription factor in Arabidopsis (Bao et al. 2014). It has also been suggested that miR396 regulates cell proliferation and plays an essential role in leaf development (Bao et al. 2014). In recent studies on Populus tomentosa Carr., miR396a, miR396b and miR396e were found to be upregulated in response to low N stress, but miR396c was downregulated. Improved knowledge of the relationship between miRNA and target genes will increase our understanding of miRNA-mediated molecular mechanisms in Populus plants adapted to low N environments (Chen et al. 2015, Ren et al. 2015). In the present study, miR396 species and their target mRNAs were found to be similarly regulated in both N stress-sensitive and -insensitive Populus clones under N stress. These results are consistent with the presumed role of miR396 in plant growth and development.
Several miRNA–mRNA networks were found to be selectively regulated in either Nanlin 1388 or Nanlin 895. In Nanlin 895, miR156, miR319 and miR393 and their target genes were found to be regulated in a coordinated way under N stress. Recently, it was shown that miR156 targets the Squamosa promoter binding protein-like (SPL) family of transcription factors, which play critical roles in various biological processes involved in developmental transition (Gou et al. 2011). A previous study has also suggested that the miR156-SPLs-DFR pathway is regulated to adapt developmental timing in response to abiotic stress (Cui et al. 2014). The regulation of miR156 and its targeting genes in the N stress-sensitive Populus clone may also reflect the regulation of development in response to N stress.
The role of miR319 has been reported to be in the regulation of teosinte branched/cycloidea/proliferating cell factor transcription factors to regulate multiple developmental pathways, including leaf development and senescence, organ curvature and hormone biosynthesis and signaling (Nag et al. 2009). It is noticeable that TCP can be regulated by both miR396 and miR319. The miR319 network was regulated under N stress only in Nanlin 895 but not in Nanlin 1388, which suggests the existence of other unidentified targets and mechanisms for miR319.
A previous study has shown that the expression of miR393 is induced by salt stress (Gupta et al. 2014). This in turn inhibits TIR1 and AFB2 receptors, leading to downregulation of auxin signaling, which results in the repression of lateral root initiation, emergence and elongation during salinity. In addition, ROS levels and ascorbate peroxidase activities are regulated by miR393, which suggests that it has a function in adjusting redox status during salt stress. When compared with Nanlin 1388, Nanlin 895 showed greater oxidative stress responses under N stress. Furthermore, miR393 and its target mRNA were found to be regulated in a coordinated way. These results suggest that oxidative stress may play an important role in plants’ responses to environmental stress. In addition, in Nanlin 1388, miR646 and its potential target mRNA were found to be regulated in a coordinated way under N stress. At present, the function of this miRNA has not been reported. The specific regulation of this network in different genotypes may turn out to be an interesting subject for future studies.
Based on GO analyses, downregulated target mRNAs involved in cellular component biogenesis and multicellular organismal processes, located in organelles and functioning as enzyme and translation regulators of known upregulated miRNAs, were specifically regulated in the Nanlin 895 clone. Differentially expressed mRNAs, involved in developmental processes and located in the envelope and extracellular regions, were regulated in the Nanlin 1388 clone only, while mRNAs involved in metabolic processes and functioning as nutrient reservoir were regulated in Nanlin 895 only. Based on KEGG analyses, only differentially expressed mRNAs involved in pathways, such as flavonoid biosynthesis and N metabolism, were shared by the two contrasting clones.
In conclusion, using high-throughput sequencing and integrated network analysis of miRNA–mRNA networks as tools, we have identified regulated genes that may be responsible for N stress responses in Populus clones. However, the present work should be considered as a pilot study and more detailed analyses on miRNAs and mRNAs identified here would help to clarify mechanisms responsible for N stress responses in Populus trees.
Supplementary data
Supplementary data for this article are available at Tree Physiology Online.
Conflict of interest
None declared.
Funding
This work was supported by the National Key Basic Research Program of China (No. 2012CB416901), the Excellent Young Scientist Program of the National Natural Science Foundation of China (No. 31322014) and the National Natural Science Foundation of China (No. 31360576).
Supplementary Material
References
- Aung K, Lin SI, Wu CC, Huang YT, Su CL, Chiou TJ. (2006) pho2, a phosphate overaccumulator, is caused by a nonsense mutation in a microRNA399 target gene. Plant Physiol 141:1000–1011. doi:10.1104/pp.106.078063 [DOI] [PMC free article] [PubMed] [Google Scholar]
- Bai H, Euring D, Volmer K, Janz D, Polle A. (2013) The nitrate transporter (NRT) gene family in poplar. PLoS One 8:e72126 doi:10.1371/journal.pone.0072126 [DOI] [PMC free article] [PubMed] [Google Scholar]
- Bao M, Bian H, Zha Y, et al. (2014) miR396a-mediated basic helix–loop–helix transcription factor bHLH74 repression acts as a regulator for root growth in Arabidopsis seedlings. Plant Cell Physiol 55:1343–1353. doi:10.1093/pcp/pcu058 [DOI] [PubMed] [Google Scholar]
- Bari R, Datt Pant B, Stitt M, Scheible WR. (2006) PHO2, microRNA399, and PHR1 define a phosphate-signaling pathway in plants. Plant Physiol 141:988–999. doi:10.1104/pp.106.079707 [DOI] [PMC free article] [PubMed] [Google Scholar]
- Bartel DP. (2004) MicroRNAs: genomics, biogenesis, mechanism, and function. Cell 116:281–297. doi:10.1016/S0092-8674(04)00045-5 [DOI] [PubMed] [Google Scholar]
- Blow N. (2009) Transcriptomics: the digital generation. Nature 458:239–242. doi:10.1038/458239a [DOI] [PubMed] [Google Scholar]
- Bonnet E, Van de Peer Y, Rouze P. (2006) The small RNA world of plants. New Phytol 171:451–468. doi:10.1111/j.1469-8137.2006.01806.x [DOI] [PubMed] [Google Scholar]
- Buhtz A, Springer F, Chappell L, Baulcombe DC, Kehr J. (2008) Identification and characterization of small RNAs from the phloem of Brassica napus. Plant J 53:739–749. doi:10.1111/j.1365-313X.2007.03368.x [DOI] [PubMed] [Google Scholar]
- Carrington JC, Ambros V. (2003) Role of microRNAs in plant and animal development. Science 301:336–338. doi:10.1126/science.1085242 [DOI] [PubMed] [Google Scholar]
- Cavani L, Ciavatta C, Gessa C. (2003) Identification of organic matter from peat, leonardite and lignite fertilisers using humification parameters and electrofocusing. Bioresour Technol 86:45–52. doi:10.1016/S0960-8524(02)00107-4 [DOI] [PubMed] [Google Scholar]
- Cerezo M, Tillard P, Filleur S, Munos S, Daniel-Vedele F, Gojon A. (2001) Major alterations of the regulation of root uptake are associated with the mutation of Nrt2.1 and Nrt2.2 genes in Arabidopsis. Plant Physiol 127:262–271. doi:10.1104/pp.127.1.262 [DOI] [PMC free article] [PubMed] [Google Scholar]
- Chen M, Bao H, Wu Q, Wang Y. (2015) Transcriptome-wide identification of miRNA targets under nitrogen deficiency in Populus tomentosa using degradome sequencing. Int J Mol Sci 16:13937–13958. doi:10.3390/ijms160613937 [DOI] [PMC free article] [PubMed] [Google Scholar]
- Chiou TJ. (2007) The role of microRNAs in sensing nutrient stress. Plant Cell Environ 30:323–332. doi:10.1111/j.1365-3040.2007.01643.x [DOI] [PubMed] [Google Scholar]
- Chiou TJ, Aung K, Lin SI, Wu CC, Chiang SF, Su CL. (2006) Regulation of phosphate homeostasis by microRNA in Arabidopsis. Plant Cell 18:412–421. doi:10.1105/tpc.105.038943 [DOI] [PMC free article] [PubMed] [Google Scholar]
- Crawford NM, Forde BG. (2002) Molecular and developmental biology of inorganic nitrogen nutrition. Arabidopsis Book 1:e0011 doi:10.1199/tab.0011 [DOI] [PMC free article] [PubMed] [Google Scholar]
- Cui LG, Shan JX, Shi M, Gao JP, Lin HX. (2014) The miR156-SPL9-DFR pathway coordinates the relationship between development and abiotic stress tolerance in plants. Plant J 80:1108–1117. doi:10.1111/tpj.12712 [DOI] [PubMed] [Google Scholar]
- Doerner P. (2008) Phosphate starvation signaling: a threesome controls systemic P(i) homeostasis. Curr Opin Plant Biol 11:536–540. doi:10.1016/j.pbi.2008.05.006 [DOI] [PubMed] [Google Scholar]
- Flexas J, Bota J, Escalona JM, et al. (2002) Effects of drought on photosynthesis in grapevines under field conditions: an evaluation of stomatal and mesophyll limitations. Funct Plant Biol 29:461–471. doi:10.1071/PP01119 [DOI] [PubMed] [Google Scholar]
- Fodor F, Gáspár L, Morales F, Gogorcena Y, Lucena JJ, Cseh E, Kröpfl K, Abadía J, Sárvári É. (2005) Effects of two iron sources on iron and cadmium allocation in poplar (Populus alba) plants exposed to cadmium. Tree Physiol 25:1173–1180. doi:10.1093/treephys/25.9.1173 [DOI] [PubMed] [Google Scholar]
- Frink CR, Waggoner PE, Ausubel JH. (1999) Nitrogen fertilizer: retrospect and prospect. Proc Natl Acad Sci USA 96:1175–1180. doi:10.1073/pnas.96.4.1175 [DOI] [PMC free article] [PubMed] [Google Scholar]
- Fujii H, Chiou TJ, Lin SI, Aung K, Zhu JK. (2005) A miRNA involved in phosphate-starvation response in Arabidopsis. Curr Biol 15:2038–2043. doi:10.1016/j.cub.2005.10.016 [DOI] [PubMed] [Google Scholar]
- Gan H, Jiao Y, Jia J, Wang X, Li H, Shi W, Peng C, Polle A, Luo Z. (2016) Phosphorus and nitrogen physiology of two contrasting poplar genotypes when exposed to phosphorus and/or nitrogen starvation. Tree Physiol 36:22–38. [DOI] [PubMed] [Google Scholar]
- Gazzarrini S, Lejay L, Gojon A, Ninnemann O, Frommer WB, von Wiren N. (1999) Three functional transporters for constitutive, diurnally regulated, and starvation-induced uptake of ammonium into Arabidopsis roots. Plant Cell 11:937–948. doi:10.1105/tpc.11.5.937 [DOI] [PMC free article] [PubMed] [Google Scholar]
- Good AG, Shrawat AK, Muench DG. (2004) Can less yield more? Is reducing nutrient input into the environment compatible with maintaining crop production? Trends Plant Sci 9:597–605. doi:10.1016/j.tplants.2004.10.008 [DOI] [PubMed] [Google Scholar]
- Gou JY, Felippes FF, Liu CJ, Weigel D, Wang JW. (2011) Negative regulation of anthocyanin biosynthesis in Arabidopsis by a miR156-targeted SPL transcription factor. Plant Cell 23:1512–1522. doi:10.1105/tpc.111.084525 [DOI] [PMC free article] [PubMed] [Google Scholar]
- Gupta OP, Meena NL, Sharma I, Sharma P. (2014) Differential regulation of microRNAs in response to osmotic, salt and cold stresses in wheat. Mol Biol Rep 41:4623–4629. doi:10.1007/s11033-014-3333-0 [DOI] [PubMed] [Google Scholar]
- He J, Qin J, Long L, et al. (2011) Net cadmium flux and accumulation reveal tissue-specific oxidative stress and detoxification in Populus × canescens. Physiol Plant 143:50–63. doi:10.1111/j.1399-3054.2011.01487.x [DOI] [PubMed] [Google Scholar]
- Hsieh LC, Lin SI, Shih ACC, Chen JW, Lin WY, Tseng CY, Li WH, Chiou TJ. (2009) Uncovering small RNA-mediated responses to phosphate deficiency in Arabidopsis by deep sequencing. Plant Physiol 151:2120–2132. doi:10.1104/pp.109.147280 [DOI] [PMC free article] [PubMed] [Google Scholar]
- Jones-Rhoades MW, Bartel DP, Bartel B. (2006) MicroRNAs and their regulatory roles in plants. Annu Rev Plant Biol 57:19–53. doi:10.1146/annurev.arplant.57.032905.105218 [DOI] [PubMed] [Google Scholar]
- Lee RC, Feinbaum RL, Ambros V. (1993) The C. elegans heterochronic gene lin-4 encodes small RNAs with antisense complementarity to lin-14. Cell 75:843–854. doi:10.1016/0092-8674(93)90529-Y [DOI] [PubMed] [Google Scholar]
- Li X, Yu E, Fan C, Zhang C, Fu T, Zhou Y. (2012) Developmental, cytological and transcriptional analysis of autotetraploid Arabidopsis. Planta 236:579–596. doi:10.1007/s00425-012-1629-7 [DOI] [PubMed] [Google Scholar]
- Linchenthaler HR, Wellburn AR. (1983) Determinations of total carotenoids and chlorophylls a and b of leaf extracts in different solvents. Biochem Soc Trans 11:591–592. [Google Scholar]
- Mallory AC, Vaucheret H. (2006) Functions of microRNAs and related small RNAs in plants. Nat Genet 38(Suppl):S31–S36. doi:10.1038/ng1791 [DOI] [PubMed] [Google Scholar]
- Mamashita T, Larocque GR, DesRochers A, Beaulieu J, Thomas BR, Mosseler A, Major J, Sidders D. (2015) Short-term growth and morphological responses to nitrogen availability and plant density in hybrid poplars and willows. Biomass Bioenergy 81:88–97. doi:10.1016/j.biombioe.2015.06.003 [Google Scholar]
- Morrissy AS, Morin RD, Delaney A, Zeng T, McDonald H, Jones S, Zhao Y, Hirst M, Marra MA. (2009) Next-generation tag sequencing for cancer gene expression profiling. Genome Res 19:1825–1835. doi:10.1101/gr.094482.109 [DOI] [PMC free article] [PubMed] [Google Scholar]
- Nag A, King S, Jack T. (2009) miR319a targeting of TCP4 is critical for petal growth and development in Arabidopsis. Proc Natl Acad Sci USA 106:22534–22539. doi:10.1073/pnas.0908718106 [DOI] [PMC free article] [PubMed] [Google Scholar]
- Pant BD, Musialak-Lange M, Nuc P, May P, Buhtz A, Kehr J, Walther D, Scheible WR. (2009) Identification of nutrient-responsive Arabidopsis and rapeseed microRNAs by comprehensive real-time polymerase chain reaction profiling and small RNA sequencing. Plant Physiol 150:1541–1555. doi:10.1104/pp.109.139139 [DOI] [PMC free article] [PubMed] [Google Scholar]
- Plett D, Toubia J, Garnett T, Tester M, Kaiser BN, Baumann U. (2010) Dichotomy in the NRT gene families of dicots and grass species. PLoS One 5:e15289 doi:10.1371/journal.pone.0015289 [DOI] [PMC free article] [PubMed] [Google Scholar]
- Ren Y, Sun F, Hou J, Chen L, Zhang Y, Kang X, Wang Y. (2015) Differential profiling analysis of miRNAs reveals a regulatory role in low N stress response of Populus. Funct Integr Genomics 15:93–105. doi:10.1007/s10142-014-0408-x [DOI] [PubMed] [Google Scholar]
- San Lucas FA, Wang G, Scheet P, Peng B. (2012) Integrated annotation and analysis of genetic variants from next-generation sequencing studies with variant tools. Bioinformatics 28:421–422. doi:10.1093/bioinformatics/btr667 [DOI] [PMC free article] [PubMed] [Google Scholar]
- Stitt M. (1999) Nitrate regulation of metabolism and growth. Curr Opin Plant Biol 2:178–186. doi:10.1016/S1369-5266(99)80033-8 [DOI] [PubMed] [Google Scholar]
- Sunkar R, Kapoor A, Zhu JK. (2006) Posttranscriptional induction of two Cu/Zn superoxide dismutase genes in Arabidopsis is mediated by downregulation of miR398 and important for oxidative stress tolerance. Plant Cell 18:2051–2065. doi:10.1105/tpc.106.041673 [DOI] [PMC free article] [PubMed] [Google Scholar]
- Sunkar R, Chinnusamy V, Zhu J, Zhu JK. (2007) Small RNAs as big players in plant abiotic stress responses and nutrient deprivation. Trends Plant Sci 12:301–309. doi:10.1016/j.tplants.2007.05.001 [DOI] [PubMed] [Google Scholar]
- Trapnell C, Roberts A, Goff L, et al. (2012) Differential gene and transcript expression analysis of RNA-seq experiments with TopHat and Cufflinks. Nat Protoc 7:562–578. doi:10.1038/nprot.2012.016 [DOI] [PMC free article] [PubMed] [Google Scholar]
- Varkonyi-Gasic E, Wu R, Wood M, Walton EF, Hellens RP. (2007) Protocol: a highly sensitive RT-PCR method for detection and quantification of microRNAs. Plant Methods 3:1–12. doi:10.1186/1746-4811-3-12 [DOI] [PMC free article] [PubMed] [Google Scholar]
- Vidal EA, Gutiérrez RA. (2008) A systems view of nitrogen nutrient and metabolite responses in Arabidopsis. Curr Opin Plant Biol 11:521–529. doi:10.1016/j.pbi.2008.07.003 [DOI] [PubMed] [Google Scholar]
- Yu E, Fan C, Yang Q, Li X, Wan B, Dong Y, Wang X, Zhou Y. (2014) Identification of heat responsive genes in Brassica napus siliques at the seed-filling stage through transcriptional profiling. PLoS One 9:e101914 doi:10.1371/journal.pone.0101914 [DOI] [PMC free article] [PubMed] [Google Scholar]
- Zhang B, Pan X, Cobb GP, Anderson TA. (2006) Plant microRNA: a small regulatory molecule with big impact. Dev Biol 289:3–16. doi:10.1016/j.ydbio.2005.10.036 [DOI] [PubMed] [Google Scholar]
- Zhang S, Jiang H, Zhao H, Korpelainen H, Li C. (2014) Sexually different physiological responses of Populus cathayana to nitrogen and phosphorus deficiencies. Tree Physiol 34:343–354. doi:10.1093/treephys/tpu025 [DOI] [PubMed] [Google Scholar]
Associated Data
This section collects any data citations, data availability statements, or supplementary materials included in this article.


