

Abstract
Objective
Evaluation of a dietary Na reduction trial in a community setting.
Design
Community-based randomized trial. Ten-week nutrition intervention activities focused on lifestyle modification to decrease dietary Na intake, under the supervision of a registered dietitian. Twenty-four hour urine specimens were collected at baseline and follow-up visits to determine 24 h urinary Na excretion.
Setting
The University of Pittsburgh Center for Healthy Aging, Key to Life Nutrition Program.
Subjects
Hypertensive adults at least 65 years of age.
Results
Mean age of participants was 75 years. Twenty-four hour mean urinary Na excretion at baseline was 3174 mg/d. This reduced to 2944 mg/d (P = 0·30) and 2875 mg/d (P ≤ 0·03) at 6-and 12-month follow-ups, respectively. In a sub-sample (urine volume of ≥ 1000 ml, baseline to 12 months), mean urinary Na excretion decreased from 3220 mg/d to 2875 mg/d (P ≤ 0·02).
Conclusions
Significant reductions in mean 24 h urinary Na were reported, but results fell short of the recommended guidelines of 1500 mg/d for at-risk individuals. Our results reiterate the difficulty in implementing these guidelines in community-based programmes. More aggressive public health efforts, food industry support and health policy changes are needed to decrease Na levels in older adults to the recommended guidelines.
Keywords: Healthy ageing, Diet, Lifestyle, Urinary sodium excretion
Hypertension increases the risk for CVD, stroke and kidney disease. Reduction of salt in the diet for the prevention and treatment of hypertension predates the availability of drug therapy for the treatment of hypertension. Exclusion of salt from the diet of hypertensives was recommended as early as 1905(1). Allen and Sherrill recommended salt restriction for treatment of hypertension in 1905 and subsequently in 1922(1). The dietary treatment of hypertension received a big boost with the introduction of the rice diet by Kempner in 1944(1). Grollman documented that the low salt level of the diet was the primary determinant for the decrease in blood pressure. In the 1950s, it was recognized that in spite of the benefits of reducing salt intake on blood pressure levels, it was difficult to implement such a diet and there was substantial variation in response to reduced salt intake(2). Furthermore, it was recognized that measurement of the dietary intake of Na was very difficult and that only 24 h urinary excretion provided a reasonable estimate of dietary intake(2,3). Dahl noted that the average daily US intake of salt in the 1950s was between 5 and 15 g. He estimated that human consumption only needed to be between 100 and 400 mg NaCl/d(4).
Na is an essential nutrient in the human body used for maintaining cell homeostasis by regulating extracellular fluid. A small amount of natural Na is found in virtually all foods, with greater amounts added during processing or during the cooking process. On average, Americans consume much higher amounts than is physiologically needed. Minimum daily requirements to replace necessary losses have been estimated at 115 mg; however the recommended safe minimum level for adults is set at 500 mg to accommodate varying levels of activity and environmental conditions(5,6). Excess dietary Na causes retention of Na and water, an increase in venous tone, peripheral resistance and central (but not total) blood volume, and higher blood pressure; it also increases left ventricular mass and cardiovascular morbidity(7–9). For decades, there has been sufficient evidence from clinical trials demonstrating that non-pharmacological interventions including Na reduction are effective not only in decreasing blood pressure and preventing hypertension, but also in decreasing left ventricular mass(10) and reducing cardiovascular morbidity(11–17).
The 2005 Dietary Guidelines for Americans and the Institute of Medicine recommended an Na intake of ≤2300 mg/d for ‘normal’ individuals and ≤1500 mg/d for individuals considered at increased risk (individuals with hypertension, blacks, middle-aged and older adults)(18,19). Consuming Na in greater than recommended amounts is considered a risk factor for increasing blood pressure(20–23). Past trials comparing behavioural interventions have provided scientific evidence that lifestyle modifications such as reducing dietary Na intake to recommended levels can result in blood pressure reduction and prevention of hypertension(12–16,24).
The Dietary Approaches to Stop Hypertension (DASH) trial was a landmark study for Na intervention in which participants were randomly assigned to one of three diets, each containing 3000 mg Na/d with a 500 mg daily discretionary Na allowance. Participants had a mean age of 44, 45 and 44 years for the control diet, the fruits and vegetables diet and the combination DASH diet, respectively(24,25). The DASH diet is high in fruits, vegetables, low-fat dairy products, whole grains, poultry, fish and nuts. This diet is also low in saturated fats, red meat, sweets and sugar-containing beverages(25). All foods were provided for the 11-week intervention and participants were advised not to consume any ‘outside’ foods. All three groups experienced blood pressure reduction. The DASH diet group showed the greatest average reduction in systolic blood pressure (SBP; 6 mmHg) and a 3 mmHg reduction in diastolic blood pressure (DBP). This reduction was even greater when stratified for persons with stage 1 hypertension (average reduction in SBP and DBP of 11 mmHg and 6 mmHg, respectively)(24).
Accurately capturing dietary Na intake from all sources poses a considerable challenge. Collecting dietary Na intake through food questionnaires is often riddled with under-reporting(26,27). The preferred methodology involves the use of 24 h urinary Na excretion to obtain reliable values. Under normal conditions, approximately 93 % of dietary Na is excreted through the urine, with minimal losses through faeces and sweat. Daily Na retention is approximately 3·4 % or 7·4 mmol(28,29).
Salt reduction is often recommended for older individuals, especially those with hypertension, congestive heart failure and renal disease. There is, however, little objective evidence of the success of reducing salt intake, especially in the long term, as measured by changes in urinary Na excretion among free-living individuals. How much of a reduction in Na in the urine is obtainable in the community by providing nutritional counselling as compared with the reduction that may be obtained in a more rigorous, clinical trial setting? To answer this question, we examined the effects of implementing prevention guidelines for older individuals, the ‘10 Keys’™ to Healthy Aging. We evaluated the effects of the dietary recommendations to reduce salt intake among hypertensives. The study did not measure the effects on blood pressure nor compare individuals who did or did not receive the dietary advice. Clinical trials have clearly documented the benefits of salt reduction on blood pressure levels and therefore it would be redundant to repeat this, as such trials have also compared the effects of the dietary intervention v. no intervention. The present study was restricted to individuals living in their homes in the community. Many of the participants were either widows or widowers or had a disabled spouse who would be ineligible for the study.
Experimental methods
Study background
The 10 Keys to Healthy Aging, a core demonstration programme of the Center for Healthy Aging (a Centers for Disease Control and Prevention research centre) of the University of Pittsburgh, was a community study of the implementation of prevention programme guidelines in the elderly. This programme was designed to advocate preventive services in ten key areas and to monitor whether changes in health behaviours occurred. The keys are based on epidemiological, clinical and laboratory studies of the major diseases associated with morbidity, mortality and disability, and were developed in 2001 by experts in ageing from the University of Pittsburgh and around the country. The 10 Keys are:
1. Control SBP to <140 mmHg (optimal <120 mmHg);
2. Stop smoking;
3. Participate in cancer screenings;
4. Get regular immunizations;
5. Regulate blood glucose (fasting <100 mg/dl);
6. Lower LDL cholesterol to <100 mg/dl;
7. Be physically active;
8. Prevent bone loss and muscle weakness;
9. Maintain social contact;
10. Combat depression.
Men and women aged ≥65 years, with no significant disability, were the population of interest. The 2000 US Census Bureau reports that the city of McKeesport, Pennsylvania, which was the site of the community-based randomized trial, had 21 % of adults aged 65 and above. Residents reported a mean retirement income of $US 9355 along with a mean social security income of $US 10 904. Approximately 12·1 % of residents aged ≥65 years were living at or below the poverty level. The surrounding Allegheny County, Pennsylvania, has 18 % of adults aged 65 and above; the second highest proportion of older adults in a US urban county(30). All participants in this population were eligible for the above programme. Participants were then randomized to a more intensive lifestyle intervention, including both diet (i.e. low salt intake) and exercise, or to the 10 Keys alone.
Recruitment of participants
A detailed description of the recruitment process has been published elsewhere(31).
Potentially eligible volunteers underwent pre-screening in the form of a telephone interview. If eligible for the programme, informed consent was obtained and three successive health assessment visits were scheduled. The first visit scheduled was the home visit, in which health counsellors travelled to the individuals' home to conduct the health assessment. These individuals were then scheduled for two ‘centre’ visits no more than one month apart. Transportation was arranged if needed or parking was validated. Health assessments ranged from 0·5 to 1·5 h in length. Following the completion of all health assessments, eligible and willing individuals were randomized by household into one of two groups: (i) Group 1, receiving a brief education and counselling intervention (BECI); or (ii) Group 2, receiving a brief education and counselling intervention that also included a physical activity programme for all participants and a dietary intervention for individuals with hypertension (BECI-plus). The advantage of two groups is that it makes it possible to compare a brief and less costly intervention (Group 1) with a more costly and intensive one (Group 2). Health status and physical function of all volunteers in both groups were reassessed bi-annually for 24 months.
Interventions
All participants received the same brief education and counselling intervention component designed to educate about the 10 Keys, to encourage adherence to age-appropriate screening procedures and vaccinations, and to work towards the reduction of specific health risk factors. As part of this intervention, each participant was given a ‘Prevention in Practice Report’ which summarized his/her status regarding each of the 10 Keys goals (Fig. 1). As the study continued, the 10 Keys goals were modified slightly to reflect changing preventive standards for serum glucose or lipid levels(32,33).
Fig. 1. Prevention in Practice Report.
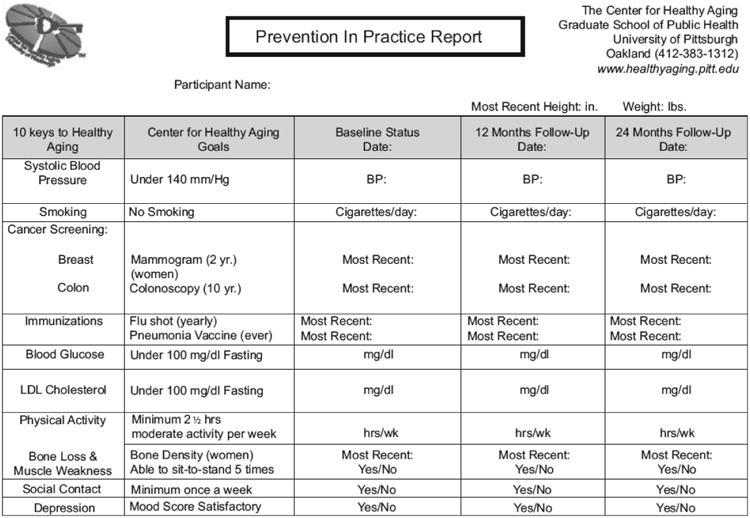
Each participant met individually with a health counsellor every six months to review his/her Prevention in Practice Report. They identified the Keys that required attention and developed an action plan, including strategies such as knowledge acquisition, skills development, social support, self-monitoring and relapse prevention. This plan was discussed and modified via follow-up telephone calls with one of the study's health counsellors at least every three months. Participants were encouraged to take the Prevention in Practice Report to their physicians and solicit their support in addressing these goals. Monthly calls were made to participants with concerning (but non-emergent) findings such as elevated blood pressure (SBP > 160 mmHg)(34) or blood glucose (>130 mg/dl)(35), a positive depression screening score (CESD > 16)(36), an absence of physical activity(37) or any current smoking behaviour. These calls helped ensure that appropriate medical follow-up was sought, provided support for behaviour change, and disseminated information on community resources that could potentially assist with recommended behaviour changes. Participants without a primary care physician were encouraged to make a physician appointment, and were given physician names and contact information from the local medical society and hospital. Those with difficulty obtaining or adhering to prescribed medications were provided information on prescription medication benefits and adherence strategies. Counselling calls continued on a monthly basis until active issues were resolved, and then reduced to approximately every three months for the remainder of the programme.
Individuals randomized to BECI-plus also received a physical activity intervention (the Key to Life Exercise Intervention) and, for those with a history of hypertension, a dietary Na nutritional intervention (the Key to Life Nutrition Program). For purposes of the current paper we discuss the Key to Life Nutrition Program only.
The Key to Life Nutrition Program was a 10-week, intensive dietary intervention, based on the DASH trials(15,24), which aimed to translate Na reduction approaches proved in randomized controlled trails into a community setting. The programme was limited to hypertensives only in the healthy lifestyle arm (Group 2). This intervention focused on educating individuals to reduce dietary Na by increasing the intake of fruits and vegetables, low-fat dairy products and whole grains, and decreasing the intake of processed foods and salt. This education was delivered in group sessions, facilitated by a registered dietitian. Weight loss was recommended only when BMI was ≥30 kg/m2.
The nutrition counselling was firmly grounded in behaviour theory, specifically behaviour modification and social learning theory(38–40). Participants were introduced to numerous self-management approaches such as self-monitoring, food label reading, goal setting, budgeting and problem solving. After ten initial weekly sessions, monthly follow-up sessions focused on maintaining motivation and adherence.
All interventions were conducted by health counsellors with at least a bachelor's level training in health education, nutrition or exercise science, with standardized training in research assessment methods and behaviour change techniques(40). Additional health counsellor training in behaviour change methodology was provided by the University of Pittsburgh faculty affiliated with the project.
Target population
Hypertension was defined as SBP ≥ 140 mmHg or on blood pressure medications.
Assessment of dietary sodium
Those who agreed to participate were asked to collect a 24 h urine specimen at baseline and at successive centre visits (6 and 12 months). Efforts were taken to minimize participant burden associated with urine collection. To help improve completeness of the 24 h urine, volunteers were contacted and instructions for collection were reviewed.
While multiple collections over several days will improve the accuracy and reliability of urinary Na measures, data for the present study are based upon a single determination owing to the feasibility of expecting older adults to collect multiple 24 h urines for a community-based intervention.
A separate analysis was done using data from a sub-sample of our hypertensive group, which included seventy-seven participants who had a 24 h urine collection volume of ≥1000 ml. We chose 1000 ml since this represents a more normal kidney output for adults aged ≥65 years. The mean urine volume at baseline was 1956 ml compared with 1985 ml at the 12-month follow-up visit. In this sub-sample, comparison was done between baseline and 12-month follow-up data.
Analyses
Twenty-four hour urinary Na excretion was measured by Quest Diagnostics Incorporated (Madison, NJ, USA) using ion-specific electrode methodology. Specimen results were reported as millimoles, which were then converted to milligrams of Na. This conversion was calculated as 1 mmol = 23 mg dietary Na. Matched paired t tests were run using the SPSS statistical software package version 15·0 (SPSS Inc., Chicago, IL, USA) to assess differences in urinary Na at baseline and consecutive follow-ups.
Results
Baseline characteristics for participants are reported in Table 1. A total of 115 participants who met the established criteria for hypertension at baseline were randomized to the healthy lifestyle group (Group 2) and completed the 24 h urine collections. Average age was 75·1 (sd 5·3) years.
Table 1. Baseline characteristics for persons with hypertension* in the lifestyle and nutrition intervention group (n 115): University of Pittsburgh Center for Healthy Aging, Key to Life Nutrition Program.
| Characteristic | n | % |
|---|---|---|
| Gender | ||
| Male | 43 | 37·4 |
| Female | 72 | 62·6 |
| Race | ||
| White/Caucasian | 96 | 83·5 |
| Black/African-American | 19 | 16·5 |
| Marital status | ||
| Single | 3 | 2·6 |
| Married | 66 | 57·4 |
| Divorced/separated | 4 | 3·5 |
| Widowed | 42 | 36·5 |
| Education level | ||
| Less than high school | 7 | 6·1 |
| High school | 57 | 49·6 |
| Some college | 16 | 13·9 |
| College graduate | 20 | 17·4 |
| Technical school | 2 | 1·7 |
| Other | 3 | 2·6 |
| Length of residence in western PA | ||
| 1–3 years | 0 | 0 |
| >3 years | 115 | 100·0 |
Mean age of the participants was 75·1 (sd 5·3) years.
Table 2 reports 24 h urinary Na excretion in persons with hypertension at baseline, 6 months and 12 months. At baseline, mean urinary Na was 3128 mg/d (136 mmol/d). Comparing baseline and 6-month follow-up tests (103 matched pairs), the mean urinary Na dropped to 2990 mg/d (130 mmol/d) at the 6-month follow up. This 138 mg/d (6 mmol/d; 95 % CI –5·74, 8·10 mmol/d) reduction was not statistically significant (P = 0·30). When comparing baseline results with the 12-month follow-up (ninety matched pairs), there was a 299 mg/d (13 mmol/d; 95 % CI 1·16, 25·40 mmol/d) reduction in urinary Na excretion. This observed decrease was significant (P = 0·03). Mean urinary Na was reduced to 2875 mg/d (125 mmol/d).
Table 2. Urinary sodium excretion in persons with hypertension in the lifestyle and nutrition intervention group: University of Pittsburgh Center for Healthy Aging, Key to Life Nutrition Program.
| Urinary Na excretion | Change from baseline (mmol/24 h) | ||||
|---|---|---|---|---|---|
|
|
|
||||
| mmol/24 h | mg/24 h | Mean | 95% CI | P value* | |
| Baseline (n 115) | 136 | 3128 | |||
| 6 months (n 103) | 130 | 2990 | −6 | −5·74, 8·10 | 0·30 |
| 12 months (n 90) | 125 | 2875 | −13 | 1·16, 25·40 | 0·03 |
P value calculated using a matched paired t test, indicating statistical significance of the change in urinary Na from baseline to each of the follow-up points.
Table 3 refers to the sub-sample of our hypertensive group, and compares seventy-seven individuals at baseline and 12-month follow-up who had a 24 h urine collection volume of ≥ 1000 ml. The mean urine volume at baseline was 1956 ml compared with 1985 ml at the 12-month follow-up visit. When comparing urinary Na excretion at baseline and 12-month follow-up using a matched paired t test, mean urinary Na was 3220 mg/d (140 mmol/d) at baseline and decreased to 2875 mg/d (125 mmol/d) at the 12-month follow-up. This decrease of 345 mg/d (15 mmol/d; 95 % CI 3·02, 27·76 mmol/d) in urinary Na excretion was significant (P = 0·02).
Table 3. Urinary sodium excretion in a sub-sample of the hypertensive group with 24 h urine volume ≥1000 ml: University of Pittsburgh Center for Healthy Aging, Key to Life Nutrition Program.
| Urinary Na excretion | Change from baseline (mmol/24 h) | |||||
|---|---|---|---|---|---|---|
|
|
|
|||||
| Mean urine volume (ml/24 h) | mmol/24 h | mg/24 h | Mean | 95% CI | P value* | |
| Baseline (n 77) | 1956 | 140 | 3220 | |||
| 12 months (n 77) | 1985 | 125 | 2875 | −15 | 3·02, 27·76 | 0·02 |
P value calculated using a matched paired t test, indicating statistical significance of the change in urinary Na from baseline to each of the follow-up points.
Discussion
In our demonstration programme changes in 24 h urinary Na excretion that occurred in persons with hypertension assigned to the Key to Life Nutrition Program intervention were significant, but fell short of the Institute of Medicine and the 2005 Dietary Guidelines recommendations (1500 mg Na/d) for this population. Our results reiterate how difficult it is to translate these recommended actions into community programmes. It is very unlikely that meeting Na reduction guidelines (i.e. 1500 mg/d) is obtainable, especially among at-risk older individuals with hypertension(18).
Numerous trials have demonstrated the beneficial effects and importance of reducing dietary Na to reduce blood pressure and ultimately heart disease and stroke(12–16). Past Na reduction trials (Table 4) have concluded that it is possible to use non-pharmacological approaches to reduce blood pressure and prevent hypertension in older adults.
Table 4. Comparison of long-term sodium reduction trials.
| Study | Reference | Study design | Age of participants (years) | Urinary Na reduction (based on 24 h urinary Na excretion) | Duration |
|---|---|---|---|---|---|
| Center for Healthy Aging (present study) | – | Community-based randomized trial | 75·1 (sd 5·3) | 13 mmol (299 mg) | 12 months |
| PREMIER Clinical Trial | Appel et al. (2003)(12) | Randomized trial | 50·0 (sd 8·9) | Advice only group: 20·6 mmol (474 mg) | 6 months |
| Established diet group: 31·6 mmol (726 mg) | |||||
| Established + DASH diet group: 32·6 mmol (750 mg) | |||||
| Trial of Nonpharmacologic Interventions (TONE) | Appel et al. (2001)(16) | Randomized trial | 65·8 (sd 4·6) | Reduced Na group: 45 mmol (1035 mg) | 36 months |
| Trials of Hypertension Prevention II (TOHP II) | Cook et al. (1998)(21) | Randomized trial | 44 | Na reduction group: 35 mmol (805 mg) | 36 months |
| Combined group: 21 mmol (483 mg) | |||||
| Minnesota Mount Sinai Hypertension Trial (MSHT) | Grimm et al. (1988)(46) | Randomized double-masked trial | 58 | 55·3 mmol (1271 mg) | 12 weeks |
The DASH trial results described above (average reductions in SBP and DBP of 6 mmHg and 3 mmHg, respectively; even greater when stratified for persons with stage 1 hypertension: average reductions in SBP and DBP of 11 mmHg and 6 mmHg, respectively(24)) sparked interest to investigate further how the DASH diet could be utilized for blood pressure control and hypertension prevention, and led to the DASH-Sodium trial, a randomized controlled trial that assessed the effects of multiple Na levels on hypertensive adults. Mean age was 47 years for the DASH diet and 49 years for the control diet. Utilizing a crossover design participants received controlled feedings with specific Na levels of 3000, 2400 and 1500 mg/d for 30 d. Results showed blood pressure reduction at all of the Na levels, but the most effective group was the DASH diet combined with Na reduction to 1500 mg/d. This group had an average reduction of 8·9 mmHg/4·5 mmHg for SBP/DBP. The reduction was greatest in persons with hypertension, who showed a reduction of 11·5 mmHg/5·7 mmHg for SBP/DBP. Persons considered normotensive also had a reduction of 7·1 mmHg/3·7 mmHg for SBP/DBP(15).
In the PREMIER multi-centre clinical trial, adults with a mean age of 50 years and above-optimal blood pressure were selected to one of three lifestyle interventions. This trial assessed if a randomized controlled trial intervention could be translated with the same outcomes to the ‘real world’. Blood pressure reductions observed in the DASH diet group for SBP/DBP were 11·1 mmHg/5·1 mmHg, respectively. After group stratification (hypertensives and non-hypertensives) reductions were 14·2 mmHg/7·4 mmHg and 9·2 mmHg/5·8 mmHg, respectively(12). At 18 months, 24 h urinary Na excretion decreased by 5·6 mmol in the group given advice only, by 18·4 mmol in the group given traditional dietary recommendations for blood pressure lowering including lower Na intake and by 24 mmol in the group following the traditional low-salt plus DASH diet. There was a substantial increase in urinary Na between 6 and 18 months in the PREMIER trial. These results of the PREMIER trial are not very different from those in the current study, i.e. 15 mmol in the current study (Table 3), 18·4 mmol in the traditional low-salt diet in PREMIER and 24 mmol in the traditional low-salt plus DASH diet(41).
The mean age of participants in the Trial of Non-pharmacologic Interventions in the Elderly (TONE) was 66·5 years. The intervention assessed if a non-pharmacological intervention could take the place of antihypertensive medication. Na reduction goals for the intervention were 80 mmol (1840 mg) or less and were assessed through a 24 h urinary Na analysis. Long-term results (36 months) for this trial demonstrated the effectiveness and sustainability of Na reduction on blood pressure, with a reduction of 4·3 mmHg/2·0 mmHg for SBP/DBP. The results also focused attention on the fact that non-pharmacological therapy can be used to control hypertension in older adults without the need for medication(16).
In the Treatment of Mild Hypertension Study (TOMHS), the mean age of the participants was 54 years. The study concluded that lifestyle interventions along with pharmacological therapy in persons with stage 1 hypertension can be effective in reducing blood pressure. The long-term result for the lifestyle intervention group was a reduction of 10·6 mmHg/8·1 mmHg in SBP/DBP. This group also reported long-term success with 74 %, 70 % and 59 % of participants at follow-up years 2, 3 and 4, respectively, maintaining blood pressure control without the use of medications(14).
The Trials of Hypertension Prevention (TOHP I and II) demonstrated that blood pressure can be significantly reduced through Na reduction and weight loss. TOHP Phase I tested the feasibility and efficacy of multiple lifestyle interventions. Results from this trial spurred greater interest and TOHP Phase II tested the efficacy of two non-pharmacological interventions, weight loss, Na reduction and their combination, to decrease blood pressure. Mean age was 44 years, and the results of Phase II showed that early interventions alone and in combination were effective in decreasing blood pressure in the long term (48 months)(13).
It has recently been reported among participants randomized in the TOHP I (n 744) and TOHP II (n 2382) low-salt diet v. control that there was a 25 % reduction in cardiovascular events in the low-Na arm: relative risk = 0·75 (95 % CI 0·57, 0·99), P = 0·04. These results were not affected by weight change. Na reduction may have reduced the long-term risks of cardiovascular events in that study(11).
Study limitations
It is very difficult to reduce the salt intake of individuals by counselling alone, as described in the present study as well as from clinical trials. For example, at 18 months in the PREMIER trial, much of the reduction in salt intake was lost. The TOHP trial had only a modest effect on salt reduction although possibly even this small reduction was associated with a long-term reduction in cardiovascular events. The basic problem is the large amount of salt in the food supply, especially added to many foods. Individuals do not recognize the large amount of salt in processed food, which makes it very difficult to reduce their salt intake. A better approach is probably to treat excess salt as a common source epidemic and to reduce the amount of Na in the food chain. There would still be substantial within-individual variations in response to decreases in salt in the diet in relation to lowering of blood pressure and perhaps cardiovascular risk. Furthermore, other dietary approaches such as in the DASH diet, i.e. high-K diet, changes in protein and fat, can also affect blood pressure and enhance the low Na intake. As noted, Dahl has estimated that only about 0·5 g of salt is needed in the diet(4). Risks of too low salt intake are probably extremely small.
The Food Standards Agency (similar to the US Food and Drug Administration) in the UK embarked on a major public health campaign to encourage food manufacturers to reduce Na levels in 2003. Presently reductions can be observed across the board. The Federation of Bakers has reduced salt levels by as much as 30 %, and the Association of Cereal Manufacturers reported a 33 % reduction in salt levels between 1998 and 2005. The Food and Drink Federation have reduced the salt content of soups and sauces by 30 %. Manufactures such as Heinz and Kraft have reduced salt in manufacturing; Heinz claims to have implemented a reduction of 11–18 % and Kraft has reduced Na in snack products by a third. The Food Standards Agency published revised salt reduction targets for 2012 in May 2009. The new targets focus on eighty categories of foods and are more challenging than the previous 2010 targets to reduce salt intake to 6 g daily(42).
Conclusion
By imposing more strict policy legislation and with the gradual reduction of Na in food manufacturing, the population would be able to slowly decrease its acquired taste for salt, without altering the taste of foods(43). This would allow long-term reductions in Na, decreasing the risk for age-related blood pressure increase or hypertension and reducing strokes and CVD morbidity and mortality(17).
In contrast, in the USA between 1994 and 2004, despite manufacturing industry attempts at Na reduction, the average Na content in foods increased by 6 %(44). Without truly aggressive public health efforts, support from the food industry and health policy changes, the levels of Na reduction needed to help reduce blood pressure will be out of reach in the USA.
Recently, the American Medical Association and other agencies have recommended a reduction of Na in the food chain. Efforts are being made in several states in the USA also to mandate a reduction in salt in the food chain.
The large amount of salt added during the manufacturing process of foods has been implicated as a factor contributing to the difficulty of maintaining a long-term dietary Na intake reduction of 100 mmol/2300 mg or even 50 mmol/1200 mg per day for at-risk populations(45). This decrease is not feasible because of the large amount of salt added during the manufacturing process of foods. The above studies show it is possible to reduce Na intake in a controlled environment, but our study showed the increased difficulty of reducing dietary Na intake in older adults in the real world.
Acknowledgments
Sources of funding: The study was funded by the Centers for Disease Control and Prevention Cooperative Agreement U48 DP000025-04, ‘Health Promotion and Disease Prevention Research Center’.
The Center for Healthy Aging would like to thank all of its volunteers, partner organizations, as well as the Center for Healthy Aging staff and students, for their assistance and support.
Footnotes
Conflicts of interest: None declared.
Author contributions: J.F.R. and L.H.K. conceived the study hypothesis. J.F.R. and R.B. were responsible for data analysis. J.F.R. wrote the manuscript. N.C.M., C.M.B., K.W., A.B.N., M.T.L., K.M. and S.M.A. edited the manuscript. The manuscript was revised by J.F.R. Final approval of the manuscript was given by L.H.K.
Ethical approval: 010866, The Center for Healthy Aging, University of Pittsburgh, Institutional Research Board.
References
- 1.Grollman A. Low-salt diet in the treatment of hypertension. In: Moyer JH, editor. Hypertension: The First Hahnemann Symposium on Hypertensive Disease. Philadelphia, PA: W.B. Saunders Company; 1959. pp. 510–512. [Google Scholar]
- 2.Meneely GR. The role of salt and diuretics in the therapy of hypertension. In: Moyer JH, editor. Hypertension: The First Hahnemann Symposium on Hypertensive Disease. Philadelphia, PA: W.B. Saunders Company; 1959. pp. 505–510. [Google Scholar]
- 3.Meneely GR. The effect of salt and other electrolytes in hypertension. In: Moyer JH, editor. Hypertension: The First Hahnemann Symposium on Hypertensive Disease. Philadelphia, PA: W.B. Saunders Company; 1959. pp. 250–261. [Google Scholar]
- 4.Dahl LK. Sodium as an etiologic factor in hypertension. In: Moyer JH, editor. Hypertension: The First Hahnemann Symposium on Hypertensive Disease. Philadelphia, PA: W.B. Saunders Company; 1959. pp. 262–268. [Google Scholar]
- 5.Denton D. The Hunger for Salt; An Anthropological, Physiological and Medical Analysis. New York: Springer-Verlag; 1982. [Google Scholar]
- 6.Stipanuk M. Biochemical and Physiological Aspects of Human Nutrition. Philadelphia, PA: W.B. Saunders Company; 2000. [Google Scholar]
- 7.Tuomilehto J, Jousilahti P, Rastenyte D, Moltchanov V, Tanskanen A, Pietinen P. Urinary sodium excretion and cardiovascular mortality in Finland: a prospective study. Lancet. 2001;357:848–851. doi: 10.1016/S0140-6736(00)04199-4. [DOI] [PubMed] [Google Scholar]
- 8.Kare M, Fregly M, Bernard R, editors. Biological and Behavioral Aspects of Salt Intake. New York: Academic Press; 1980. [Google Scholar]
- 9.Pinto E. Blood pressure and ageing. Postgrad Med J. 2007;83:109–114. doi: 10.1136/pgmj.2006.048371. [DOI] [PMC free article] [PubMed] [Google Scholar]
- 10.Jula AM, Karanko HM. Effects on left ventricular hypertrophy of long-term nonpharmacological treatment with sodium restriction in mild to moderate essential hypertension. Circulation. 1994;89:1023–1031. doi: 10.1161/01.cir.89.3.1023. [DOI] [PubMed] [Google Scholar]
- 11.Cook NR, Cutler JA, Obarzanek E, Buring JE, Rexrode KM, Kumanyika SK, Appel LJ, Whelton PK. Long term effects of dietary sodium reduction on cardiovascular disease outcomes: observational follow-up of the Trials of Hypertension Prevention (TOHP) BMJ. 2007;334:885–888. doi: 10.1136/bmj.39147.604896.55. [DOI] [PMC free article] [PubMed] [Google Scholar]
- 12.Appel LJ, Champagne CM, Harsha DW, et al. Writing Group of the PREMIER Collaborative Research Group. Effects of comprehensive lifestyle modification on blood pressure control: main results of the PREMIER clinical trial. JAMA. 2003;289:2083–2093. doi: 10.1001/jama.289.16.2083. [DOI] [PubMed] [Google Scholar]
- 13.Anon. Effects of weight loss and sodium reduction intervention on blood pressure and hypertension incidence in overweight people with high-normal blood pressure. The Trials of Hypertension Prevention, phase II. The Trials of Hypertension Prevention Collaborative Research Group. Arch Intern Med. 1997;157:657–667. [PubMed] [Google Scholar]
- 14.Elmer PJ, Grimm R, Jr, Laing B, et al. Lifestyle intervention: results of the Treatment of Mild Hypertension Study (TOMHS) Prev Med. 1995;24:378–388. doi: 10.1006/pmed.1995.1062. [DOI] [PubMed] [Google Scholar]
- 15.Sacks FM, Svetkey LP, Vollmer WM, et al. Effects on blood pressure of reduced dietary sodium and the Dietary Approaches to Stop Hypertension (DASH) diet. DASH-Sodium Collaborative Research Group. N Engl J Med. 2001;344:3–10. doi: 10.1056/NEJM200101043440101. [DOI] [PubMed] [Google Scholar]
- 16.Appel LJ, Espeland MA, Easter L, Wilson AC, Folmar S, Lacy CR. Effects of reduced sodium intake on hypertension control in older individuals: results from the Trial of Nonpharmacologic Interventions in the Elderly (TONE) Arch Intern Med. 2001;161:685–693. doi: 10.1001/archinte.161.5.685. [DOI] [PubMed] [Google Scholar]
- 17.Chobanian AV, Bakris GL, Black HR, et al. National Heart, Lung, and Blood Institute Joint National Committee on Prevention, Detection, Evaluation, and Treatment of High Blood Pressure; National High Blood Pressure Education Program Coordinating Committee. The Seventh Report of the Joint National Committee on Prevention, Detection, Evaluation, and Treatment of High Blood Pressure: the JNC 7 report. JAMA. 2003;289:2560–2572. doi: 10.1001/jama.289.19.2560. [DOI] [PubMed] [Google Scholar]
- 18.US Department of Health and Human Services & US Department of Agriculture. Dietary Guidelines for Americans, 2005. 6th. Washington, DC: US Government Printing Office; 2005. [Google Scholar]
- 19.Food and Nutrition Board Institute of Medicine. Dietary Reference Intakes for Water, Potassium, Sodium, Chloride, and Sulfate. Washington, DC: National Academies Press; 2005. [Google Scholar]
- 20.Elliott P, Stamler J, Nichols R, Dyer AR, Stamler R, Kesteloot H, Marmot G. Intersalt revisited: further analyses of 24 hour sodium excretion and blood pressure within and across populations. Intersalt Cooperative Research Group. BMJ. 1996;312:1249–1253. doi: 10.1136/bmj.312.7041.1249. [DOI] [PMC free article] [PubMed] [Google Scholar]
- 21.Cook NR, Kumanyika SK, Cutler JA. Effect of change in sodium excretion on change in blood pressure corrected for measurement error. The Trials of Hypertension Prevention, Phase I. Am J Epidemiol. 1998;148:431–444. doi: 10.1093/oxfordjournals.aje.a009668. [DOI] [PubMed] [Google Scholar]
- 22.Khaw KT, Barrett-Connor E. The association between blood pressure, age, and dietary sodium and potassium: a population study. Circulation. 1988;77:53–61. doi: 10.1161/01.cir.77.1.53. [DOI] [PubMed] [Google Scholar]
- 23.Dyer AR, Elliott P, Shipley M. Urinary electrolyte excretion in 24 hours and blood pressure in the INTERSALT Study. II. Estimates of electrolyte–blood pressure associations corrected for regression dilution bias. The INTERSALT Cooperative Research Group. Am J Epidemiol. 1994;139:940–951. doi: 10.1093/oxfordjournals.aje.a117100. [DOI] [PubMed] [Google Scholar]
- 24.Appel LJ, Moore TJ, Obarzanek E, et al. A clinical trial of the effects of dietary patterns on blood pressure. DASH Collaborative Research Group. N Engl J Med. 1997;336:1117–1124. doi: 10.1056/NEJM199704173361601. [DOI] [PubMed] [Google Scholar]
- 25.Karanja N, Erlinger TP, Pao-Hwa L, Miller ER, 3rd, Bray GA. The DASH diet for high blood pressure: from clinical trial to dinner table. Cleve Clin J Med. 2004;71:745–753. doi: 10.3949/ccjm.71.9.745. [DOI] [PubMed] [Google Scholar]
- 26.Moses C, editor. Sodium in Medicine and Health. Baltimore, MD: Reese Press, Inc; 1980. [Google Scholar]
- 27.Espeland MA, Kumanyika S, Wilson AC, Reboussin DM, Easter L, Self M, Robertson J, Brown WM, McFarlane M TONE Cooperative Research Group. Statistical issues in analyzing 24-hour dietary recall and 24-hour urine collection data for sodium and potassium intakes. Am J Epidemiol. 2001;153:996–1006. doi: 10.1093/aje/153.10.996. [DOI] [PubMed] [Google Scholar]
- 28.Sanchez-Castillo CP, Branch WJ, James WP. A test of the validity of the lithium-marker technique for monitoring dietary sources of salt in man. Clin Sci (Lond) 1987;72:87–94. doi: 10.1042/cs0720087. [DOI] [PubMed] [Google Scholar]
- 29.Liu K, Stamler J. Assessment of sodium intake in epidemiological studies on blood pressure. Ann Clin Res. 1984;16(43):49–54. [PubMed] [Google Scholar]
- 30.US Census Bureau. McKeesport City, Pennsylvania: 2000. [accessed July 2008]. Census 2000 Summary File. http://factfinder.census.gov/servlet/SAFFFacts?_event=&geo_id=16000US4246256&_geoContext=01000US%7C04000US42%7C16000US4246256&_street=&_county=McKeesport&_cityTown=McKeesport&_state=04000US42&_zip=&_lang=en&_sse=on&ActiveGeoDiv=geoSelect&_useEV=&pctxt=fph&pgsl=160&_submenuId=factsheet_1&ds_name=ACS_2007_3YR_SAFF&_ci_nbr=null&qr_name=null®=null%3Anull&_keyword=&_industry. [Google Scholar]
- 31.Newman A, Bayles CM, McTigue K, Williams K, Robare JF, Taylor CA, Albert SM, Kuller LH. The 10 Keys to Healthy Aging: findings from an innovative prevention program in the community. J Aging Health. 2009 doi: 10.1177/0898264310363772. In the Press. [DOI] [PMC free article] [PubMed] [Google Scholar]
- 32.Genuth S, Alberti KG, Bennett P, et al. Expert Committee on the Diagnosis and Classification of Diabetes Mellitus. Follow-up report on the diagnosis of diabetes mellitus. Diabetes Care. 2003;26:3160–3167. doi: 10.2337/diacare.26.11.3160. [DOI] [PubMed] [Google Scholar]
- 33.National Cholesterol Education Program (NCEP) Expert Panel on Detection, Evaluation, and Treatment of High Blood Cholesterol in Adults (Adult Treatment Panel III) Third Report of the National Cholesterol Education Program (NCEP) Expert Panel on Detection Evaluation, and Treatment of High Blood Cholesterol in Adults (Adult Treatment Panel III) final report. Circulation. 2002;106:3143–3421. [PubMed] [Google Scholar]
- 34.Chobanian AV, Bakris GL, Black HR, et al. Joint National Committee on Prevention, Detection, Evaluation, and Treatment of High Blood Pressure. National Heart, Lung, and Blood Institute; National High Blood Pressure Education Program Coordinating Committee. Seventh report of the Joint National Committee on Prevention, Detection, Evaluation, and Treatment of High Blood Pressure. Hypertension. 2003;42:1206–1252. doi: 10.1161/01.HYP.0000107251.49515.c2. [DOI] [PubMed] [Google Scholar]
- 35.Expert Committee on the Diagnosis and Classification of Diabetes Mellitus. Report of the expert committee on the diagnosis and classification of diabetes mellitus. Diabetes Care. 2003;26(1):S5–S20. doi: 10.2337/diacare.26.2007.s5. [DOI] [PubMed] [Google Scholar]
- 36.American Geriatrics Society & American Association for Geriatric Psychiatry. Recommendations for policies in support of quality mental health care in US nursing homes. J Am Geriatr Soc. 2003;51:1299–1304. doi: 10.1046/j.1532-5415.2003.51416.x. [DOI] [PubMed] [Google Scholar]
- 37.Nelson ME, Rejeski WJ, Blair SN, Duncan PW, Judge JO, King AC, Macera CA, Castaneda-Sceppa C American College of Sports Medicine; American Heart Association. Physical activity and public health in older adults: recommendation from the American College of Sports Medicine and the American Heart Association. Circulation. 2007;116:1094–1105. doi: 10.1161/CIRCULATIONAHA.107.185650. [DOI] [PubMed] [Google Scholar]
- 38.Bandura A, Adams NE, Beyer J. Cognitive processes mediating behavioral change. J Pers Soc Psychol. 1977;35:125–139. doi: 10.1037//0022-3514.35.3.125. [DOI] [PubMed] [Google Scholar]
- 39.Bandura A. Self-efficacy: toward a unifying theory of behavioral change. Psychol Rev. 1977;84:191–215. doi: 10.1037//0033-295x.84.2.191. [DOI] [PubMed] [Google Scholar]
- 40.Botelho RJ, Skinner H. Motivating change in health behavior. Implications for health promotion and disease prevention. Prim Care. 1995;22:565–589. [PubMed] [Google Scholar]
- 41.Elmer PJ, Obarzanek E, Vollmer WM, et al. PREMIER Collaborative Research Group. Effects of comprehensive lifestyle modification on diet, weight, physical fitness, and blood pressure control: 18-month results of a randomized trial. Ann Intern Med. 2006;144:485–495. doi: 10.7326/0003-4819-144-7-200604040-00007. [DOI] [PubMed] [Google Scholar]
- 42.Food Standards Agency. New salt reduction targets published as part of FSA campaign to reduce salt in our diets. [accessed September 2009];2006 http://www.food.gov.uk/news/pressreleases/2006/mar/targets.
- 43.Bertino M, Beauchamp GK, Engelman K. Long-term reduction in dietary sodium alters the taste of salt. Am J Clin Nutr. 1982;36:1134–1144. doi: 10.1093/ajcn/36.6.1134. [DOI] [PubMed] [Google Scholar]
- 44.Jacobson MF. Salt: The Forgotten Killer. Washington, DC: Center for Science in the Public Interest; 2005. [Google Scholar]
- 45.Kuller L. Salt and blood pressure. Population and individual perspectives. Am J Hypertens. 1997;10:29S–36S. [PubMed] [Google Scholar]
- 46.Grimm RH, Kofron PM, Neaton JD, Svendsen KH, Elmer PJ, Holland L, Witte LJ, Clearman D, Prineas RJ. Effect of potassium supplementation combined with dietary sodium reduction on blood pressure in men taking antihypertensive medication. J Hypertens. 1988;(6):S591–S593. doi: 10.1097/00004872-198812040-00185. [DOI] [PubMed] [Google Scholar]