

Automated and clinical assessments of breast density showed similar positive associations with breast cancer risk but differed up to 14% in the classification of women with dense breasts.
Abstract
Purpose
To compare the classification of breast density with two automated methods, Volpara (version 1.5.0; Matakina Technology, Wellington, New Zealand) and Quantra (version 2.0; Hologic, Bedford, Mass), with clinical Breast Imaging Reporting and Data System (BI-RADS) density classifications and to examine associations of these measures with breast cancer risk.
Materials and Methods
In this study, 1911 patients with breast cancer and 4170 control subjects matched for age, race, examination date, and mammography machine were evaluated. Participants underwent mammography at Mayo Clinic or one of four sites within the San Francisco Mammography Registry between 2006 and 2012 and provided informed consent or a waiver for research, in compliance with HIPAA regulations and institutional review board approval. Digital mammograms were retrieved a mean of 2.1 years (range, 6 months to 6 years) before cancer diagnosis, with the corresponding clinical BI-RADS density classifications, and Volpara and Quantra density estimates were generated. Agreement was assessed with weighted κ statistics among control subjects. Breast cancer associations were evaluated with conditional logistic regression, adjusted for age and body mass index. Odds ratios, C statistics, and 95% confidence intervals (CIs) were estimated.
Results
Agreement between clinical BI-RADS density classifications and Volpara and Quantra BI-RADS estimates was moderate, with κ values of 0.57 (95% CI: 0.55, 0.59) and 0.46 (95% CI: 0.44, 0.47), respectively. Differences of up to 14% in dense tissue classification were found, with Volpara classifying 51% of women as having dense breasts, Quantra classifying 37%, and clinical BI-RADS assessment used to classify 43%. Clinical and automated measures showed similar breast cancer associations; odds ratios for extremely dense breasts versus scattered fibroglandular densities were 1.8 (95% CI: 1.5, 2.2), 1.9 (95% CI: 1.5, 2.5), and 2.3 (95% CI: 1.9, 2.8) for Volpara, Quantra, and BI-RADS classifications, respectively. Clinical BI-RADS assessment showed better discrimination of case status (C = 0.60; 95% CI: 0.58, 0.61) than did Volpara (C = 0.58; 95% CI: 0.56, 0.59) and Quantra (C = 0.56; 95% CI: 0.54, 0.58) BI-RADS classifications.
Conclusion
Automated and clinical assessments of breast density are similarly associated with breast cancer risk but differ up to 14% in the classification of women with dense breasts. This could have substantial effects on clinical practice patterns.
© RSNA, 2015
Introduction
Mammographic breast density has been shown to be a major risk factor for breast cancer (1–3) and inversely related to the sensitivity of mammographic screening (4). The breast density measure historically used in clinical practice is the Breast Imaging Reporting and Data System (BI-RADS) (5,6), which is generally determined by radiologists and consists of four categories of increasing densities. Approximately 9% of women have almost entirely fatty breasts (BI-RADS category 1), 40% have scattered fibroglandular densities (BI-RADS category 2), 45% have heterogeneously dense breasts (BI-RADS category 3), and 6% have extremely dense breasts (BI-RADS category 4) (5). Dense breasts are defined as BI-RADS density categories 3 or 4. Thus, approximately 50% of the population who undergo mammography, or an estimated 27 million U.S. women, have been categorized as having dense breasts (7).
Dense breasts contribute to the delayed detection of breast cancer because of the masking of tumors by dense tissue. Mammographic sensitivity for women with almost entirely fatty breasts ranges from 81% to 93%, compared with 57% to 71% for those with extremely dense breasts (8,9). Breast density has also been shown to be a major risk factor for breast cancer (1–3,10–12) when assessed on mammograms in the years prior to breast cancer diagnosis (2,3,13). Women with extremely dense breasts have a three- to fivefold increased risk of breast cancer relative to those with almost entirely fatty breasts (3,10,14). For these reasons, 24 U.S. state governments have passed legislation mandating that women with dense breasts be notified of their breast density and the implications for tumor masking and cancer risk. Those with dense breasts are advised to discuss supplemental screening studies with their health care provider (15,16).
Full-field digital mammography (FFDM) has largely replaced film mammography because of its superior image quality (4,17) and its data archiving and retrieval advantages. Currently, two commercially available volumetric density measures for FFDM, Volpara (version 1.5.0, Matakina Technology, Wellington, New Zealand) and Quantra (version 2.0; Hologic, Bedford, Mass), are being used in clinical practice. Although these commercial systems have shown correlation with BI-RADS density categories and risk of breast cancer (18–22), their effect on clinical practice and risk association by using mammograms obtained prior to the time of cancer diagnosis is not clear.
The purpose of this study was to compare the classification of breast density by two automated methods, Volpara and Quantra, with clinical BI-RADS density on FFDM images and to examine associations of these measures with breast cancer risk.
Materials and Methods
Study Population
The participating studies included two retrospective case-control studies nested within large breast screening practices at the Mayo Clinic, Rochester, Minn, and one of four sites within the San Francisco Mammography Registry, for a total of 1911 patients with breast cancer and 4170 control subjects. Passive permission was obtained from participants at the San Francisco Mammography Registry facilities at the time of each mammographic examination for general research studies involving mammography. At Mayo Clinic, because of the retrospective nature of this study, a waiver of informed consent and Health Insurance Portability and Accountability Act authorization from the participants was approved by the institutional review board. However, we only included individuals who had not refused permission to use their medical records for research (according to Minnesota Research Authorization) (23). Both studies had clinical risk factor data, BI-RADS density, and raw or “for processing” FFDM screening mammograms acquired with Selenia (Hologic) machines at least 6 months prior to receipt of the cancer diagnosis (or the corresponding date for control subjects). Each study was approved by the relevant institutional review boards and was compliant with the Health Insurance Portability and Accountability Act.
San Francisco Mammography Registry study.—Since 2006, FFDM images have been obtained from four facilities, which serves as the underlying screening mammography cohort (1). Incident breast cancer cases reported to the California Cancer Registry from January 2007 through November 2012 (n = 1474) with a screening FFDM examination at least 6 months prior to the time of diagnosis were included. Approximately two control subjects (n = 2945) without prior breast cancer were matched to each case on the basis of age, race, FFDM examination date, imaging machine, and facility.
Mayo Clinic study.—From April 2008 through December 2012, there were 49 501 women from the tristate region of Minnesota, Iowa, and Wisconsin who underwent an FFDM examination, which served as the underlying cohort. Incident breast cancers from this region reported to the Mayo Clinic tumor registry through December 2012 (n = 437) were eligible. Approximately three control subjects (n = 1225) without prior breast cancer were matched to each patient with breast cancer on the basis of age, race, state of residence, FFDM examination date, and imaging machine.
Breast Density Measures
Clinical assessment.—BI-RADS density classification was recorded by radiologists on screening FFDM images as part of routine clinical practice. Radiologists classified density for each mammographic examination into one of four categories, as defined in the BI-RADS lexicon, fourth edition (5), the standard for clinical practice over the time the mammograms were assessed (2006–2012). This rating has shown moderate interobserver reliability (24).
Volpara and Quantra.—Volpara and Quantra are fully automated methods for assessing volumetric breast density that use the measured breast thickness and x-ray attenuations on the raw or “for processing” image to create estimates of dense and nondense tissue volume for each pixel. Summing the dense pixel volumes provides total dense volume (DV). Dividing DV by total breast volume and multiplying by 100 defines volumetric percentage density (VPD). Each system uses proprietary algorithms to calculate breast thickness and determine dense tissue volume (25,26). For example, Quantra sums the maximum for each measure from the two breasts rather than averaging each breast as done with Volpara, resulting in different scales for each. Cut points are applied by both manufacturers to fractionate their VPD into four categories, which are analogous to BI-RADS categories. The Volpara BI-RADS–like categories are defined as category 1, less than 4.5% VPD; category 2, 4.5%–7.49% VPD; category 3, 7.5%–15.49% VPD; and category 4, at least 15.5% VPD (26). The Quantra BI-RADS–like category outputs of 1–4 are relative to an established reference population, but the exact cut-point thresholds are not specified (21,25). For this study, we used the DV, VPD, and BI-RADS–like category output from the vendor-specific software per woman, incorporating all four views, as done in the clinical setting. Fifty images were randomly selected from control subjects at Mayo Clinic, and deidentified “raw” images from the earliest examination were sent to the University of California, San Francisco, for evaluation of Volpara and Quantra measures. Concordance between all automated density measures was evaluated.
Statistical Methods
Relationships between automated measurements from the two platforms were evaluated graphically in patients with breast cancer and control subjects by using Pearson correlation coefficients. Agreement between the clinical BI-RADS measures and automated BI-RADS–like measures was assessed and interpreted (27) with weighted κ statistics by using linear weighting, which takes into account the ordered categories. κ values were interpreted as follows: 0.20 or less, poor agreement; 0.21–0.40, fair agreement; 0.41–0.60, moderate agreement; 0.61–0.80, good agreement; and 0.81–1.00, very good agreement (27). Percentage agreement between automated BI-RADS–like analogs and clinical BI-RADS measures was summarized within each clinical BI-RADS category. κ statistics were compared across 5000 bootstrap samples to assess significance.
Conditional logistic regression was used to account for the matching and to examine breast cancer and density associations. Breast cancer associations were examined with BI-RADS classifications and automated analogs, as well as log-transformed continuous automated measures (per standard deviation) and quintiles, for ease of presentation of DV and VPD. Associations were summarized with odds ratios (ORs) and 95% confidence intervals (CIs) and with areas under the receiver operating characteristic curve, or C statistics, which accounted for the matched study design. Body mass index (BMI) (continuous measures), parity (nulliparous vs parous), first-degree family history of breast cancer, and postmenopausal hormonal therapy at the time of mammography (in postmenopausal women only) were evaluated as potential confounders by assessing the magnitude of change in OR after including each factor in the model. A bootstrap approach was used to compare differences in breast cancer associations among the density measures. For the BI-RADS comparisons, ORs associated with each of the density categories were estimated and compared with the corresponding estimates from each of the BI-RADS–like measures. We used the second category as a reference to allow for estimations of risk in the low and high categories, and since it is the most prevalent category, it resulted in stable estimates. For quintiles of VPD and DV, ORs from an ordinal model were compared. C statistics were also compared between each pair of density measures. Within-bootstrap comparisons were aggregated across 5000 bootstrap samples to quantify differences between estimates and to test for statistical significance. Analyses were performed by using SAS software version 9.3 (SAS Institute, Cary, NC). Two-sided statistical tests were used, and P values less than .05 were considered to indicate a statistically significant difference.
Results
Characteristics of the combined case-control study of 1911 patients with breast cancer and 4170 control subjects are described in Table 1. For patients, there was a mean of 2.1 years between acquisition of the mammograms on which density was assessed and the date of breast cancer diagnosis, with 92% of patients undergoing mammography more than 1 year prior to receiving a diagnosis of cancer. Most cases (72%) were invasive cancers. As expected, patients were more likely than control subjects to have a family history of breast cancer, lower parity rate, and current use of postmenopausal hormone therapy. Further, the patients with breast cancer were more likely than control subjects to have higher breast density by all assessment methods (Table 1). Results were not markedly different when analyzed according to study cohort (Table E1 [online]); therefore, combined results are presented. Further, the comparison of 50 images between sites resulted in perfect concordance of all automated density estimates. The distributions of the continuous Volpara and Quantra volumetric measures for all 4170 control subjects are shown in Figure 1. The median VPD was 7.7% for Volpara and 10.1% for Quantra, with similar interquartile ranges of 7.1–15.1. There were a larger number of women with low VPD (<5%) on the basis of the Volpara classification versus the Quantra classification (23% vs 8%, respectively), but a similar proportion (5%) had extremely high VPD (>25%) (Fig 1a, 1b). The distributions were generally similar for the DV estimates (Fig 1c, 1d). Figure E1 (online) shows the correlation between methods for VPD (Fig E1a [online]) and DV (Fig E1b [online]), illustrating a shift up, especially at lower values for Quantra VPD compared with Volpara VPD. The correlations between the two continuous methods were slightly lower for VPD (0.74 for patients and 0.78 for control subjects) than DV (0.84 for case and 0.81 for control subjects) or total volume (0.99 for both).
Table 1.
Characteristics and Breast Density Measures in the Combined Population according to Patients with Breast Cancer and Control Subject Status
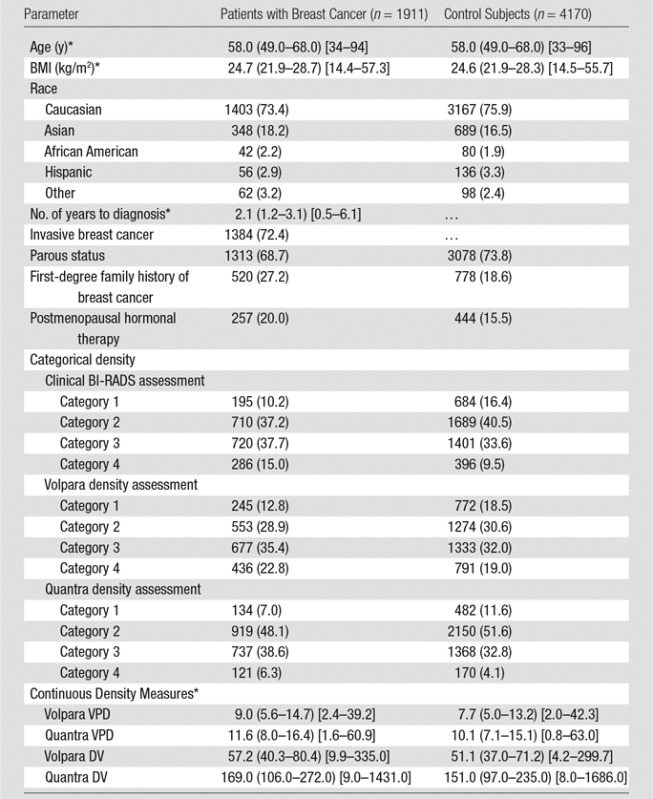
Note.—Unless indicated otherwise, data are the number of participants, with percentages in parentheses.
*Data are median values, with interquartile ranges in parentheses and ranges in brackets.
Figure 1a:

Graphs show distributions of volumetric density measures (VPD [PD] and DV) with Quantra and Volpara algorithms for control subjects. (a) VPD for Volpara (median, 7.7; interquartile range, 5.0–13.2), (b) VPD for Quantra (median, 10.1; interquartile range, 7.1–15.1, (c) DV for Volpara (median, 51.1; interquartile range, 37.0–71.2, and (d) DV for Quantra (median, 151; interquartile range, 97–235) are shown. IQR = interquartile range.
Figure 1b:

Graphs show distributions of volumetric density measures (VPD [PD] and DV) with Quantra and Volpara algorithms for control subjects. (a) VPD for Volpara (median, 7.7; interquartile range, 5.0–13.2), (b) VPD for Quantra (median, 10.1; interquartile range, 7.1–15.1, (c) DV for Volpara (median, 51.1; interquartile range, 37.0–71.2, and (d) DV for Quantra (median, 151; interquartile range, 97–235) are shown. IQR = interquartile range.
Figure 1c:

Graphs show distributions of volumetric density measures (VPD [PD] and DV) with Quantra and Volpara algorithms for control subjects. (a) VPD for Volpara (median, 7.7; interquartile range, 5.0–13.2), (b) VPD for Quantra (median, 10.1; interquartile range, 7.1–15.1, (c) DV for Volpara (median, 51.1; interquartile range, 37.0–71.2, and (d) DV for Quantra (median, 151; interquartile range, 97–235) are shown. IQR = interquartile range.
Figure 1d:

Graphs show distributions of volumetric density measures (VPD [PD] and DV) with Quantra and Volpara algorithms for control subjects. (a) VPD for Volpara (median, 7.7; interquartile range, 5.0–13.2), (b) VPD for Quantra (median, 10.1; interquartile range, 7.1–15.1, (c) DV for Volpara (median, 51.1; interquartile range, 37.0–71.2, and (d) DV for Quantra (median, 151; interquartile range, 97–235) are shown. IQR = interquartile range.
Classification according to Clinical BI-RADS Density Assessment and Volpara and Quantra Measures
We examined percentage agreement and concordance (by using weighted κ statistics) for two density classifications, dense (category 3 or 4) and nondense (category 1 or 2), as well as the four-categories of BI-RADS density. The number of control subjects classified as having dense breasts was 1797 of 4170 (43%) by using the clinical BI-RADS density assessment, 2124 of 4170 (51%) by using Volpara, and 1538 of 4170 (37%) by using Quantra. Of those classified as having dense breasts with the clinical BI-RADS assessment, 88% were also classified as having dense breasts by Volpara, and 70% had dense breasts according to Quantra. For the nondense group as assessed with clinical BI-RADS assessment, Volpara classified 77% of patients as having nondense breasts, and Quantra classified 88% as having nondense breasts (Fig E2 [online]). Agreement between the dense and nondense classifications of the BI-RADS–like measures with clinical BI-RADS assessment was higher for Volpara (κ = 0.64, 95% CI: 0.61, 0.66) than for Quantra (κ = 0.59, 95% CI: 0.57, 0.62) (P = .002).
We next examined the four Volpara and Quantra predefined BI-RADS–like categories that result from the automated programs within specific clinical BI-RADS categories (Fig 2a). Of control subjects in BI-RADS category 1, 65% and 30% were classified into the same category by Volpara and Quantra, respectively. For the other categories, the percentage agreements of the automated Volpara and Quantra assessments with clinical BI-RADS assessment were 50% and 70% for BI-RADS category 2, 55% and 60% for BI-RADS category 3, and 84% and 25% for BI-RADS category 4, respectively. Within each clinical BI-RADS category, Quantra resulted in greater numbers of women in the middle two density categories, while Volpara resulted in greater numbers in the two extreme categories. Further, Volpara assigned more women to the two extreme categories when compared with clinical BI-RADS assessment (Fig 2a, Table 2). Results were similar among the patients (Fig 2b). The agreement (weighted κ values) across the four categories of the clinical BI-RADS assessment and Volpara and Quantra measures were all found to be moderate, similar to the results of the binary dense versus nondense assessments. The agreement between clinical BI-RADS and Volpara categories (κ = 0.57, 95% CI: 0.55, 0.59) was higher than agreement between clinical BI-RADS and Quantra measures (κ = 0.46, 95% CI: 0.44, 0.47).
Figure 2a:

(a) Graph shows the distribution of control subjects according to Volpara and Quantra density categories within each clinical BI-RADS density category. (b) Graph shows the distribution of patients with breast cancer according to Volpara and Quantra density categories within each clinical BI-RADS density category. The bars outlined in black note the cells that are consistent with the clinical BI-RADS density estimate.
Table 2.
Classification of Dense Tissue among All Control Subjects (n = 4170) according to Clinical BI-RADS Density Assessment and Volpara and Quantra BI-RADS–like Density Assessment
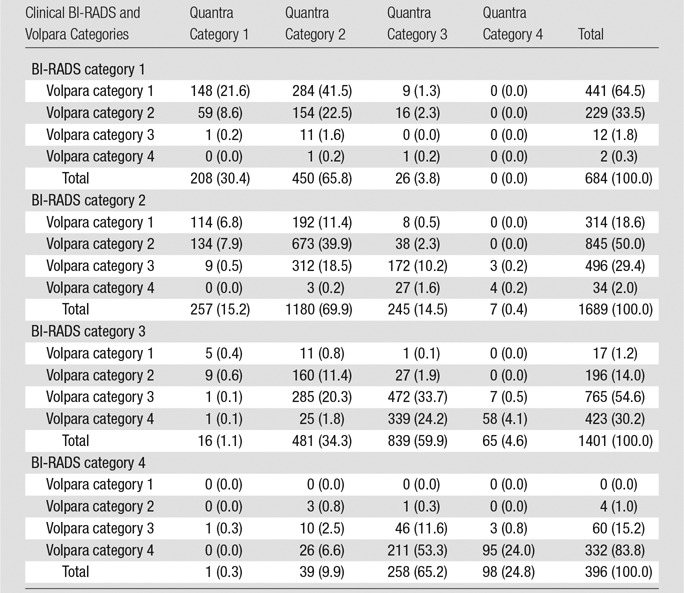
Note.—Data are number of participants, with percentages in parentheses.
Figure 2b:

(a) Graph shows the distribution of control subjects according to Volpara and Quantra density categories within each clinical BI-RADS density category. (b) Graph shows the distribution of patients with breast cancer according to Volpara and Quantra density categories within each clinical BI-RADS density category. The bars outlined in black note the cells that are consistent with the clinical BI-RADS density estimate.
Risk Associations
There were positive and similar associations between all BI-RADS density assessments and breast cancer risk (Fig 3). By using BI-RADS category 2 as the reference, there was a 1.8-fold (95% CI: 1.5, 2.2), 1.9-fold (95% CI: 1.5, 2.5), and 2.3-fold (95% CI: 1.9, 2.8) increased risk for women in the highest BI-RADS density category as assessed with Volpara, Quantra, and clinical assessment, respectively. Similarly, those in the lowest BI-RADS density category had a reduced risk of breast cancer (OR, 0.65 [95% CI: 0.54, 0.78] for Volpara, 0.66 [95% CI: 0.53, 0.82] for Quantra, and 0.58 [95% CI: 0.48, 0.70] for clinical BI-RADS assessment). The positive associations with breast cancer risk for all methods persisted with adjustment for age, BMI, family history of breast cancer, parity, and postmenopausal hormone therapy (Fig E3 [online]). The three methods also had similar discrimination between patients with breast cancer and control subjects, with a slightly higher C statistic of 0.60 (95% CI: 0.58, 0.61) for clinical BI-RADS assessment than for Volpara (C statistic, 0.58; 95% CI: 0.56, 0.59; P = .03) and Quantra (C statistic, 0.56; 95% CI: 0.54, 0.58; P < .001), although the CIs had some overlap.
Figure 3:

Chart shows the association of clinical BI-RADS density assessment and automated density measures (BI-RADS–like categories, DV, and VPD [PD]) with breast cancer risk ORs and 95% CIs adjusted for age and BMI. (DV was not adjusted for BMI.)
The continuous measures, including estimates per 1 standard deviation, as well as quintiles of DV and VPD for Volpara and Quantra, also showed positive associations with breast cancer risk (Fig 3, Fig E3 [online]; Table 3). The ORs per standard deviation for VPD with both Volpara and Quantra were stronger than those seen with DV (OR, 1.5 per standard deviation for VPD and 1.3 per standard deviation for DV for Volpara [P < .001]; OR, 1.3 per standard deviation of VPD and 1.2 per standard deviation for DV for Quantra [P = .002]). Findings were similar for quintiles (Fig 3). The C statistics did not differ for Volpara VPD versus DV measures (Table 3) but were somewhat higher for Quantra VPD versus DV measures (C statistics, 0.57 for VPD and 0.55 for DV; P = .07 [continuous measures] and P = .01 [quintiles], respectively; Table 3). Further, there were expected associations seen between the continuous automated volumetric measures and age, BMI, parity, family history, and postmenopausal hormonal therapy (Table E2 [online]). Other than age and BMI, none of the variables were found to confound the density and breast cancer associations (Table E3 [online]).
Table 3.
Association of Continuous Automated Density Measures (VPD and DV) with Breast Cancer Risk
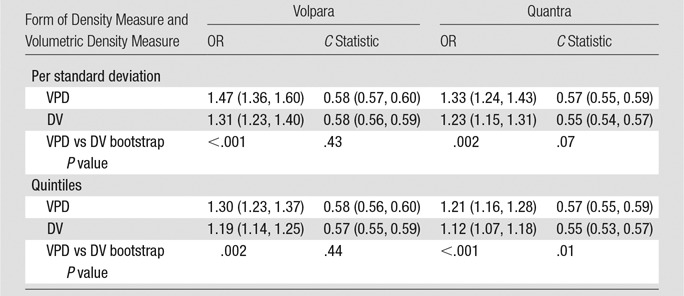
Note.—Numbers in parentheses are 95% CIs. Density measures were analyzed as continuous measures (per standard deviation) and across quintiles. OR and 95% CI values were adjusted for age and BMI. The C statistic was calculated with age and BMI included in each model.
Discussion
We found differences of up to 14% in the proportion of women classified as having dense breasts with the various methods, with Volpara classifying 51% of women as having dense breasts, Quantra classifying 37%, and clinical BI-RADS assessment used to classify 43%. These differences have implications for the numbers of women who have discussions with providers about supplemental screening. We also found Volpara and Quantra automated density methods to be positively associated with future breast cancer risk, with VPD showing stronger associations than DV. BI-RADS–like measures resulting from the automated programs showed similar associations with breast cancer but had slightly lower discrimination of risk compared with clinical BI-RADS density assessment, although CIs overlapped.
Two smaller case-control studies in which density was assessed on contralateral mammograms at the time of cancer diagnosis yielded positive associations of automated density measures with risk (21,22). Eng et al (21) found a stronger association of quintiles of Volpara VPD with breast cancer compared with Quantra (OR of 8.3 vs 3.9 for fifth vs first quintiles, respectively), while we found lower but positive risk estimates when using quintiles of density (OR, 2.6 with Volpara and 2.0 with Quantra). In both studies, attenuated associations with DV were found. Eng et al (21) did not evaluate BI-RADS–like categories. The different magnitude of risk estimates between our studies could be due to the sample size (400 patients with breast cancer in their study vs 1900 in our study), with different proportions of control subjects with “dense” breasts (9% in the study of Eng et al [21] vs 37% in our study) or measurement of breast density at the time of cancer diagnosis versus breast density data collected in the years prior to the cancer diagnosis (3). Park et al evaluated VPD with Volpara as a risk factor among Korean women (n = 677 cases) and found associations of similar magnitude to those in our study among postmenopausal women (22). Brand et al (28) found VPD and DV, estimated with Volpara on mammograms a median of 22 days from cancer diagnosis, to be associated with breast cancer in a cohort study, with 206 incident cases (28). The magnitude of risk between the highest and lowest quartiles of VPD in the study of Brand et al was similar to ours (OR of 2.9 and 2.8, respectively) (28).
In our study, we found only moderate agreement between the two automated methods and clinical BI-RADS assessment (κ values ranging from 0.46 to 0.57). Further, the correlation between quintiles of continuous VPD and DV assessed with the automated measures ranged from 0.78 to 0.84. In other studies, investigators also compared the automated assessments to clinical measures and each other with similar findings (19,20,29,30). Currently, it is not possible to determine which method most accurately reflects “true” breast density and should be used to guide clinical decision making. In the clinical setting, breast density has traditionally been determined by means of visual assessment, which demonstrates moderate interobserver agreement (18–20). Both Volpara and Quantra are absolutely reproducible and on repeat mammographic examinations showed the lowest within-breast density variability of the methods evaluated (31). Further, Volpara and Quantra volumetric estimates have been shown to correlate with density measurements obtained with magnetic resonance (MR) imaging (32).
Our results suggest that both automated methods and visual assessment are associated with breast cancer risk, but the methods differ with regard to the proportions of women defined as having dense breasts. This has several implications for the clinical setting. First, it will result in differences in the numbers of women who receive information about having dense breasts. Supplemental screening studies such as ultrasonography, MR imaging, and molecular breast imaging may be offered to these women (15,16). Although clinical BI-RADS density can be used to identify women at high risk of interval cancer by using the Breast Cancer Surveillance Consortium risk calculator (8), the ability of automated methods to allow prediction of the risk of interval cancer is not yet known. Thus, the method used to define “dense breasts” could have a substantial effect on practice patterns. Second, on the basis of results from our study, it would be essential to use the same automated density measurement method to assess individual longitudinal changes. This will be especially important if breast density is used as a surrogate marker for treatment response. For example, reductions in density with tamoxifen therapy have been associated with reduced risk of primary breast cancer (33) recurrence and mortality (34,35).
There are several limitations of this study, including the fact that we were unable to address which measure is most relevant for defining tumor masking, which is an important question to be addressed in future studies. Additionally, the clinical BI-RADS density assessments in this study were conducted by using definitions from the fourth BI-RADS edition (6), which has subsequently been replaced by the fifth edition, which attempts to put more emphasis on the tumor-masking effect of dense tissue. In our study, we purposely used the clinical assessment recorded at the time of primary interpretation for comparison with the automated measures, and as such, we did not evaluate the inter- or intraobserver variability of the clinical density assessment. Further, it was beyond the scope of our study to examine the contribution of other risk factors, including detailed family history, on the breast density and breast cancer association. Finally, clinical BI-RADS density assessment is a Mammography Quality Standards Act requirement in the United States but is not used consistently in other countries, which limits the ability to use this measure in risk models internationally.
In summary, automated and clinical assessments of breast density showed similar positive associations with breast cancer risk but differ up to 14% in the classification of women with dense breasts, which is important to consider in clinical practice. Further, the clinical BI-RADS density assessment showed similar, if not improved, discrimination for breast cancer risk compared with the Volpara and Quantra automated measures.
Advances in Knowledge
■ Breast Imaging Reporting and Data System (BI-RADS)–like density categories (1, fatty; 2, scattered fibroglandular density; 3, heterogeneously dense; and 4, extremely dense) determined by the automated methods Volpara (version 1.5.0; Matakina Technology, Wellington, New Zealand) and Quantra (version 2.0; Hologic, Bedford, Mass) and radiologist assessment are positively associated with breast cancer risk, with 1.8-, 1.9-, and 2.3-fold increased risk, respectively, with extremely dense versus scattered fibroglandular density categories.
■ The association with breast cancer risk was stronger by using volumetric percentage density (VPD) than dense volume with Volpara and Quantra, which suggests that this metric is more appropriate in clinical practice for risk assessment.
■ We found moderate agreement between density categories assigned by Volpara and Quantra and clinical BI-RADS assessments, resulting in differences up to 14% in the proportion of women defined as having dense breasts.
Implications for Patient Care
■ The method used to define dense breasts could have a substantial effect on supplemental screening recommendations and breast cancer risk assessment.
■ When assessing individual longitudinal changes in density, it is important to use the same automated density measurement system.
SUPPLEMENTAL FIGURES
Acknowledgments
Acknowledgments
We acknowledge the many study participants who enabled this research.
Received June 13, 2015; revision requested July 27; revision received September 16; accepted September 29; final version accepted October 16.
This research was supported by the National Institutes of Health (grants P50 CA116201, R01 CA97396, R01CA177150, P01 CA154292, HHSN261201100031C, and UL1 TR000135).
Disclosures of Conflicts of Interest: K.R.B. disclosed no relevant relationships. C.G.S. disclosed no relevant relationships. L.M. disclosed no relevant relationships. A.P.M. disclosed no relevant relationships. M.R.J. disclosed no relevant relationships. D.H.W. disclosed no relevant relationships. F.F.W. disclosed no relevant relationships. S.M. disclosed no relevant relationships. C.B.H. Activities related to the present article: disclosed no relevant relationships. Activities not related to the present article: author received payment from Gamma Medica for patents and royalties. Other relationships: disclosed no relevant relationships. A.D.N. disclosed no relevant relationships. J.H. Activities related to the present article: disclosed no relevant relationships. Activities not related to the present article: author has U.S. patents approved and pending. Other relationships: disclosed no relevant relationships. J.S. disclosed no relevant relationships. V.S.P. disclosed no relevant relationships. K.K. disclosed no relevant relationships. C.M.V. Activities related to the present article: disclosed no relevant relationships. Activities not related to the present article: author has stock and/or stock options in medical device companies. Other relationships: disclosed no relevant relationships.
Abbreviations:
- BI-RADS
- Breast Imaging Reporting and Data System
- BMI
- body mass index
- CI
- confidence interval
- DV
- dense volume
- FFDM
- full-field digital mammography
- OR
- odds ratio
- VPD
- volumetric percentage density
References
- 1.Bertrand KA, Tamimi RM, Scott CG, et al. Mammographic density and risk of breast cancer by age and tumor characteristics. Breast Cancer Res 2013;15(6):R104. [DOI] [PMC free article] [PubMed] [Google Scholar]
- 2.Vachon CM, Pankratz VS, Scott CG, et al. Longitudinal trends in mammographic percent density and breast cancer risk. Cancer Epidemiol Biomarkers Prev 2007;16(5):921–928. [DOI] [PubMed] [Google Scholar]
- 3.Boyd NF, Guo H, Martin LJ, et al. Mammographic density and the risk and detection of breast cancer. N Engl J Med 2007;356(3):227–236. [DOI] [PubMed] [Google Scholar]
- 4.Kerlikowske K, Hubbard RA, Miglioretti DL, et al. Comparative effectiveness of digital versus film-screen mammography in community practice in the United States: a cohort study. Ann Intern Med 2011;155(8):493–502. [DOI] [PMC free article] [PubMed] [Google Scholar]
- 5.American College of Radiology . The American College of Radiology Breast Imaging Reporting and Data System (BI-RADS). 4th ed. Reston, Va: American College of Radiology, 2003. [Google Scholar]
- 6.Sickles EA, D’Orsi CJ, Bassett LW, et al. ACR BI-RADS Mammography. In: ACR BI-RADS Atlas, Breast Imaging Reporting and Data System. 5th ed. Reston, Va: American College of Radiology, 2013. [Google Scholar]
- 7.Sprague BL, Gangnon RE, Burt V, et al. Prevalence of mammographically dense breasts in the United States. J Natl Cancer Inst 2014;106(10):dju255. [DOI] [PMC free article] [PubMed] [Google Scholar]
- 8.Kerlikowske K, Zhu W, Tosteson AN, et al. Identifying women with dense breasts at high risk for interval cancer: a cohort study. Ann Intern Med 2015;162(10):673–681. [DOI] [PMC free article] [PubMed] [Google Scholar]
- 9.Kolb TM, Lichy J, Newhouse JH. Comparison of the performance of screening mammography, physical examination, and breast US and evaluation of factors that influence them: an analysis of 27,825 patient evaluations. Radiology 2002;225(1):165–175. [DOI] [PubMed] [Google Scholar]
- 10.McCormack VA, Highnam R, Perry N, dos Santos Silva I. Comparison of a new and existing method of mammographic density measurement: intramethod reliability and associations with known risk factors. Cancer Epidemiol Biomarkers Prev 2007;16(6):1148–1154. [DOI] [PMC free article] [PubMed] [Google Scholar]
- 11.Ursin G, Ma H, Wu AH, et al. Mammographic density and breast cancer in three ethnic groups. Cancer Epidemiol Biomarkers Prev 2003;12(4):332–338. [PubMed] [Google Scholar]
- 12.Maskarinec G, Meng L. A case-control study of mammographic densities in Hawaii. Breast Cancer Res Treat 2000;63(2):153–161. [DOI] [PubMed] [Google Scholar]
- 13.Byrne C, Schairer C, Wolfe J, et al. Mammographic features and breast cancer risk: effects with time, age, and menopause status. J Natl Cancer Inst 1995;87(21):1622–1629. [DOI] [PubMed] [Google Scholar]
- 14.Cummings SR, Tice JA, Bauer S, et al. Prevention of breast cancer in postmenopausal women: approaches to estimating and reducing risk. J Natl Cancer Inst 2009;101(6):384–398. [DOI] [PMC free article] [PubMed] [Google Scholar]
- 15.Vachon CM, Ghosh K, Brandt KR. Mammographic density: potential as a risk factor and surrogate marker in the clinical setting. Curr Breast Cancer Rep 2013;5(3):183–193. [Google Scholar]
- 16.Wang AT, Vachon CM, Brandt KR, Ghosh K. Breast density and breast cancer risk: a practical review. Mayo Clin Proc 2014;89(4):548–557. [DOI] [PubMed] [Google Scholar]
- 17.Pisano ED, Gatsonis C, Hendrick E, et al. Diagnostic performance of digital versus film mammography for breast-cancer screening. N Engl J Med 2005;353(17):1773–1783. [DOI] [PubMed] [Google Scholar]
- 18.Ciatto S, Bernardi D, Calabrese M, et al. A first evaluation of breast radiological density assessment by QUANTRA software as compared to visual classification. Breast 2012;21(4):503–506. [DOI] [PubMed] [Google Scholar]
- 19.Lee HN, Sohn YM, Han KH. Comparison of mammographic density estimation by Volpara software with radiologists’ visual assessment: analysis of clinical-radiologic factors affecting discrepancy between them. Acta Radiol 2015;56(9):1061–1068. [DOI] [PubMed] [Google Scholar]
- 20.Gweon HM, Youk JH, Kim JA, Son EJ. Radiologist assessment of breast density by BI-RADS categories versus fully automated volumetric assessment. AJR Am J Roentgenol 2013;201(3):692–697. [DOI] [PubMed] [Google Scholar]
- 21.Eng A, Gallant Z, Shepherd J, et al. Digital mammographic density and breast cancer risk: a case-control study of six alternative density assessment methods. Breast Cancer Res 2014;16(5):439. [DOI] [PMC free article] [PubMed] [Google Scholar]
- 22.Park IH, Ko K, Joo J, et al. High volumetric breast density predicts risk for breast cancer in postmenopausal, but not premenopausal, Korean Women. Ann Surg Oncol 2014;21(13):4124–4132. [DOI] [PubMed] [Google Scholar]
- 23.St Sauver JL, Grossardt BR, Yawn BP, et al. Data resource profile: the Rochester Epidemiology Project (REP) medical records-linkage system. Int J Epidemiol 2012;41(6):1614–1624. [DOI] [PMC free article] [PubMed] [Google Scholar]
- 24.Berg WA, Campassi C, Langenberg P, Sexton MJ. Breast Imaging Reporting and Data System: inter- and intraobserver variability in feature analysis and final assessment. AJR Am J Roentgenol 2000;174(6):1769–1777. [DOI] [PubMed] [Google Scholar]
- 25.Inc Hologic. Understanding Quantra 2.0 User Manual - MAN-02004 Rev 002. Bedford, Mass: Hologic, 2012. [Google Scholar]
- 26.Volpara Solutions from Matakina Technology . Volpara Density User Manual Version 1.5.11. Wellington, New Zealand: Volpara Solutions, 2013. [Google Scholar]
- 27.Landis JR, Koch GG. The measurement of observer agreement for categorical data. Biometrics 1977;33(1):159–174. [PubMed] [Google Scholar]
- 28.Brand JS, Czene K, Shepherd JA, et al. Automated measurement of volumetric mammographic density: a tool for widespread breast cancer risk assessment. Cancer Epidemiol Biomarkers Prev 2014;23(9):1764–1772. [DOI] [PubMed] [Google Scholar]
- 29.Morrish OW, Tucker L, Black R, Willsher P, Duffy SW, Gilbert FJ. Mammographic breast density: comparison of methods for quantitative evaluation. Radiology 2015;275(2):356–365. [DOI] [PubMed] [Google Scholar]
- 30.Schmachtenberg C, Hammann-Kloss S, Bick U, Engelken F. Intraindividual comparison of two methods of volumetric breast composition assessment. Acad Radiol 2015;22(4):447–452. [DOI] [PubMed] [Google Scholar]
- 31.Alonzo-Proulx O, Mawdsley GE, Patrie JT, Yaffe MJ, Harvey JA. Reliability of automated breast density measurements. Radiology 2015;275(2):366–376. [DOI] [PubMed] [Google Scholar]
- 32.Wang J, Azziz A, Fan B, et al. Agreement of mammographic measures of volumetric breast density to MRI. PLoS One 2013;8(12):e81653. [DOI] [PMC free article] [PubMed] [Google Scholar]
- 33.Cuzick J, Warwick J, Pinney E, Warren RM, Duffy SW. Tamoxifen and breast density in women at increased risk of breast cancer. J Natl Cancer Inst 2004;96(8):621–628. [DOI] [PubMed] [Google Scholar]
- 34.Nyante SJ, Sherman ME, Pfeiffer RM, et al. Prognostic significance of mammographic density change after initiation of tamoxifen for ER-positive breast cancer. J Natl Cancer Inst 2015;107(3):dju425. [DOI] [PMC free article] [PubMed] [Google Scholar]
- 35.Kim J, Han W, Moon HG, et al. Breast density change as a predictive surrogate for response to adjuvant endocrine therapy in hormone receptor positive breast cancer. Breast Cancer Res 2012;14(4):R102. [DOI] [PMC free article] [PubMed] [Google Scholar]
Associated Data
This section collects any data citations, data availability statements, or supplementary materials included in this article.