

ABSTRACT
Off-rates of proteins from the DNA double helix are widely considered to be dependent only on the interactions inside the initially bound protein-DNA complex and not on the concentration of nearby molecules. However, a number of recent single-DNA experiments have shown off-rates that depend on solution protein concentration, or “facilitated dissociation.” Here, we demonstrate that this effect occurs for the major Escherichia coli nucleoid protein Fis on isolated bacterial chromosomes. We isolated E. coli nucleoids and showed that dissociation of green fluorescent protein (GFP)-Fis is controlled by solution Fis concentration and exhibits an “exchange” rate constant (kexch) of ≈104 M−1 s−1, comparable to the rate observed in single-DNA experiments. We also show that this effect is strongly salt dependent. Our results establish that facilitated dissociation can be observed in vitro on chromosomes assembled in vivo.
IMPORTANCE Bacteria are important model systems for the study of gene regulation and chromosome dynamics, both of which fundamentally depend on the kinetics of binding and unbinding of proteins to DNA. In experiments on isolated E. coli chromosomes, this study showed that the prolific transcription factor and chromosome packaging protein Fis displays a strong dependence of its off-rate from the bacterial chromosome on Fis concentration, similar to that observed in in vitro experiments. Therefore, the free cellular DNA-binding protein concentration can strongly affect lifetimes of proteins bound to the chromosome and must be taken into account in quantitative considerations of gene regulation. These results have particularly profound implications for transcription factors where DNA binding lifetimes can be a critical determinant of regulatory function.
INTRODUCTION
All aspects of chromosome dynamics involve the binding and unbinding of proteins from the DNA double helix. The rate of binding for a given species of protein to a location along a DNA is usually controlled by concentration of that species, but it is widely assumed that unbinding times, or equivalently off-rates, are controlled by the strength of interactions inside the DNA-protein complex and are independent of other nearby molecules in the nucleoplasm (1). However, this picture has been challenged by a number of recent in vitro experiments which have shown off-rates of proteins from duplex DNA that depend on bulk protein concentrations (2–5). Similar effects have been observed for single-stranded DNA (ssDNA)-binding proteins (6, 7), antibody-ligand binding (8), and ssDNA-ssDNA interactions (9).
A straightforward explanation for this effect is that macroscopic dissociation (complete dissociation followed by diffusive motion of a protein to a location far away from the initial binding site) occurs via one or more partially dissociated intermediate (“microdissociated”) states. A protein in bulk solution could impact dissociation events in a variety of ways (5, 9). This interaction can affect the rate of macroscopic dissociation of the original protein, for example, by having the second “invading” protein “block” rebinding of the first protein (5, 10, 11). Alternatively, both the initially bound and invading proteins might bind at adjacent sites, with the second protein accelerating the off-rate of the first protein via allosteric interactions (12). In either case, formation of a transient ternary complex (initially bound protein plus DNA site plus invading protein) may lead to appreciable increases in off-rates as the bulk protein concentration is increased. In the molecularly crowded cell interior, the rates of replacement of proteins on DNA may well be very different from what might be predicted from dilute-solution studies of binding kinetics, a fact that may help reconcile observations of rapid turnover on DNA in vivo but slower kinetics observed in vitro (13–17).
An example of a protein with this property is the major bacterial nucleoid protein Fis, which has been observed to have an off-rate (koff) dependent on bulk Fis concentration (c), increasing as koff = koff,0 + kexch c for bulk Fis concentrations below 50 nM (5). The exchange rate constant (kexch) was found to be 6 × 10⁴ M−1 s−1, describing the increase of off-rate from the zero-concentration level (koff,0) of ≈1 × 10⁻³ s−1 to about four times that amount at a bulk Fis concentration of 50 nM (5). Fis concentrations in vivo vary widely with growth conditions but are in the 10 to 50 μM range during fast growth (18, 19), suggesting an unbound Fis concentration of at least 100 nM, sufficient to strongly increase the Fis off-rate from its zero-concentration value. Furthermore, given the possibility for facilitated dissociation to be driven by other species of protein (e.g., by HU as observed in vitro [5]), the off-rate of Fis or other DNA-binding proteins may be even more strongly perturbed in vivo.
We were curious as to whether facilitated dissociation is operative on chromosomes, given that they contain high densities of protein mixtures bound along DNA in heterogeneous complexes. One might imagine that protein-DNA complexes assembled in vivo might show little or no facilitated dissociation, or perhaps a qualitatively different level of facilitated dissociation, given the wildly differing concentrations and heterogeneous distributions of protein in the cell along the chromosome compared to conditions for in vitro experiments on protein-DNA interactions (5). This study examined this question via experiments aimed at directly observing facilitated dissociation of DNA-binding proteins from bacterial chromosomes isolated from rapidly growing cells. In short, we isolated nucleoids from Escherichia coli cells modified to express a green fluorescent protein (GFP) fusion of Fis (14). Osmotic shock (20, 21) was used to release the nucleoid, which avoids detergents that can destabilize proteins bound to DNA (22, 23) and which is optimal for maintaining in vivo nucleoid organization (20). We monitored the dynamics of the GFP-Fis fluorescence as a function of time in the presence of varied concentrations of bulk nonfluorescent wild-type Fis (WT Fis) protein, the heterotypic nucleoid protein HU, and varied salt concentrations.
MATERIALS AND METHODS
Bacterial strain expressing GFP-Fis protein.
All experiments used E. coli strain FRAG1B (F− rha thi gal lacZam PN25/tetR PlacIq/lacI Spr), which contains a constitutively expressed chromosomal lacI gene and the wild-type chromosomal fis gene. FRAG1B cells were transformed with plasmid pZE12-GFP-fis carrying an isopropyl-β-d-thiogalactopyranoside (IPTG)-inducible GFP-Fis gene fusion and ampicillin resistance (14). The ectopically expressed GFP-Fis gene construct enables controlled constitutive amounts of fluorescently tagged Fis to be synthesized in addition to native Fis. In brief, enhanced GFP (eGFP) (F64L S65T) is inserted between amino acid residues 5 and 6 within the unstructured N-terminal peptide segment of Fis located on the opposite end of the polypeptide from the DNA-binding region.
DNA binding properties of GFP-Fis are very similar to those of WT Fis in vitro (5); furthermore, GFP-Fis has been observed to promote transcriptional activation (proP P2 promoter [24]), Hin-catalyzed site-specific DNA inversion (25), and phage lambda excision (26) in vivo. The behavior of GFP-Fis in the bacterial strain studied has been examined in some detail previously (14). The fis gene is autoregulated, leading to a reduction in WT Fis production as GFP-Fis is produced, which keeps the total WT Fis plus GFP-Fis concentration nearly constant (see Fig. S1 of reference 14). No impact of induction of GFP-Fis on cell growth rate was observed in that study (see Fig. S2 of reference 14) at the GFP-Fis induction levels used in this study.
Cells were grown in LB plus 50 μg/ml of ampicillin from a single colony overnight at 30°C, diluted 1:1,000 into fresh medium, induced with 0.5 mM IPTG, and harvested at an optical density at 600 nm (OD600) of 0.1 for nucleoid isolation and microscopy. Under these culture conditions, we have measured about 1,500 dimers per cell of GFP-Fis, which constituted about 7.5% of the total cellular Fis concentration for the strain studied here (see Fig. S1 of reference 14). In a small number of DNA visualization experiments, 0.1 μg/ml of 4′,6-diamidino-2-phenylindole (DAPI) was also added to the culture following dilution.
Nucleoid isolation by osmotic shock.
Cells were diluted 1:4 in chilled LB (∼107 cells per ml) and then centrifuged for 5 min at 10,000 rpm. The cell pellet was resuspended in 500 μl of sucrose buffer (0.58 M sucrose, 10 mM Na2HPO4/NaH2PO4 buffer [pH 7.4] [NaPi], 10 mM EDTA, 100 mM NaCl) at 4°C. Five microliters of a freshly dissolved chicken egg white lysozyme solution (5 mg/ml) was then added, giving a final lysozyme concentration of 50 μg/ml. After 5 min of incubation on ice, a drop (5 μl) of cells in the lysis buffer was transferred onto a microscope coverslip (35x50-1) on which a 25-mm-diameter rubber O ring was affixed using wax. The prepared sample was then fixed on the microscope stage using Scotch tape and then covered with a microscope glass.
Next, a field of view with a few cells adhered to the glass surface was chosen for imaging. Following the protocol used by Wegner et al. (21), cells were incubated with lysozyme for less than 10 min. Osmotic shock was applied within 5 min of transferring the cells onto the microscope slide by gently adding 500 μl of hypotonic buffer (10 mM NaCl) into the well, resulting in a 100-fold dilution of the cells (21). While some cells were spherical before hypotonic treatment, many rounded up only after addition of hypotonic buffer. Experiments using an alternate hypotonic buffer with adjusted pH (10 mM NaCl, 20 mM HEPES [pH 7.5] [27]) gave similar results. In a subset of experiments, we increased the final concentration of NaCl to 100 mM after a 5-min osmotic shock treatment by gently adding 500 μl of 200 mM NaCl solution to the sample.
Protein exchange reactions.
In protein exchange experiments, osmotic shock treatment in the hypotonic buffer was followed by addition of 500 μl of protein dilution buffer (20 mM HEPES [pH 7.6], 0.1 mM EDTA, 5% glycerol, and 0.5 mg/ml of bovine serum albumin [BSA], plus NaCl and Fis as required) to the well. Fis was added to the dilution buffer from a 1-mg/ml (∼40 μm) stock and mixed by gently pipetting up and down a few times, immediately before addition of the buffer to the sample. Experiments using E. coli HU protein instead of Fis (see the supplemental material) were carried out in a similar manner. Fis and HU proteins were purified as described in reference 5.
We note that the hypotonic buffer contains 10 mM NaCl and that our Fis stocks (>0.5 to 1.0 mg/ml) were stored in high salt to prevent precipitation (20 mM HEPES [pH 7.5], 1 M NaCl, 50% glycerol, 1 mM dithiothreitol [DTT], 0.1 mM EDTA). We corrected for this by adjusting the NaCl concentration of the protein dilution buffer, depending on the degree of protein dilution in the experiment, so as to obtain either a 20 mM or 100 mM final NaCl concentration.
We note that in vivo, one finds mainly K+ at roughly 200 mM and glutamate at ∼100 mM (28), while in the present study, NaCl was used. However, on the basis of prior studies, we expect little difference in Fis-DNA binding interactions in buffers containing potassium glutamate or NaCl at these concentrations (29). A small number of experiments were carried out with NaCl replaced by potassium glutamate (see the supplemental material) to test this hypothesis.
Microscopy and image analysis.
Spheroplasts and isolated nucleoids were imaged using a high-resolution wide-field fluorescence microscope (Olympus model IX81 with a 100×/1.45 numerical aperture [NA] objective, a 1.6× magnifier lens, and an ImagEM electron-multiplied charge-coupled device camera [Hamamatsu]), with a resultant 100-nm pixel size. A mercury lamp (EXFO X-Cite 120) was used for fluorescence illumination; fluorescence images were acquired with a 0.5-s exposure time.
To avoid photobleaching, after applying osmotic shock, focusing was done by finding the glass surface using bright-field differential interference contrast (DIC) microscopy and then adjusting the objective to move the image plane 2 to 3 μm above the glass. Fluorescence images were acquired and analyzed using Slidebook software (Olympus). Nucleoid diameter and fluorescence intensity measurements were done using ImageJ software (NIH). The nucleoid diameter was determined via measurement of the greater of the full widths at half-maximum in x and y axis line profiles, using an image with focal plane through the center of the nucleoid. Total intensity of the nucleoids (and the same area in the background) versus time was measured in a stack of (time-lapse) images. Fluorescence intensity versus time (total intensity after background subtraction) was then plotted and fitted to exponential decays using ImageJ.
We note that use of wide-field microscopy collects light from above and below the focal plane with rather similar efficiencies to collection in the focal plane, with the difference that light from out of the focal plane is not in focus. This is helpful for our measurements, since as long as the nucleoids are well separated from one another, and we integrate light intensity over a sufficiently large region, we are able to quantify fluorescence from the entire nucleoid. In test experiments, we found that the measured fluorescence intensity was insensitive to focal plane position over a 10-μm focal plane change.
RESULTS
Isolation and visualization of nucleoids.
Cells were incubated in lysis buffer containing lysozyme and became osmotically sensitive spheroplasts (Fig. 1A). Spheroplasts were then transferred into a 1-ml well on a microscope slide to which they adhered, allowing addition of buffer while particular cells were observed. Immersion of the spheroplasts in 10 mM NaCl hypotonic solution resulted in their rupturing and release of the nucleoid (Fig. 1B). The GFP-Fis protein on the nucleoids permitted them to be observed before and after release from spheroplasts (Fig. 1). In most cases, nucleoids remained adhered to the glass microscope slide, most likely via connections by cell envelope remnants, and were not washed away by gentle removal and addition of buffer into the well.
FIG 1.

Nucleoid isolation by osmotic shock. (A) DIC and fluorescence images of a cell adhered to the coverslip that has become spherical (spheroplasts) and osmotically sensitive via lysozyme treatment. (B) The released nucleoid expanded, reaching a stable size of about 4 μm in 10 mM salt. (C) The same nucleoid as in panel B, after a shift to 100 mM salt, swelled an additional 1.5-fold over the state shown in panel B. (D) Average size of the nucleoid before and after release (n = 11). (E and F) Fluorescence images of the glass surface underneath the nucleoid in the two salt concentrations, showing the appearance of fluorescent puncta in the high salt concentration that are possibly dissociated GFP-Fis or clusters of Fis associated with regions of the nucleoid adhering to the glass surface. (G and H) Fluorescence images of the same nucleoids as in panels B and C stained with DAPI, showing that the GFP-Fis and DAPI-DNA distributions are similar. Scale bars are 5 μm.
Nucleoids displayed an abrupt expansion upon release, followed by a slow expansion to a stable size within about 5 min. There was some variation in shape and size of the nucleoids, but they typically underwent a 2- to 3-fold expansion in diameter into a globule structure with an equilibrium diameter of approximately 4 μm (Fig. 1B). Following this initial expansion, nucleoids were very stable and retained their size and shape for hours (in another study, nucleoids were reported to be stable for several days [30]).
Although some substructures were observed as variations in the fluorescence intensity, liberated nucleoids were relatively homogeneous, with no apparent coiled structure resembling ones observed in vivo (14, 31). Fluorescence images of the nucleoids before and after release showed a large drop in the fluorescence intensity (40 to 50%). We assume that there is some amount of GFP-Fis loss upon nucleoid extraction but a precise quantitative estimate of this is problematic, as we have found the GFP-Fis molecular brightness to depend on buffer conditions and is likely different in vivo from in our isolation buffer.
The isolated nucleoids in low-salt buffer (10 mM NaCl) were shifted back to buffer with univalent ion concentration (100 mM NaCl) comparable to that found in vivo, via addition of the protein dilution buffer. As shown in Fig. 1C, they swelled slightly (1.5-fold), but again, retained a stable diameter that was half of the random-walk estimate of relaxed size of the nucleoid DNA (approximate of ≈12 μm for a 4.6-Mb circular DNA with a length [L] of 1,500 μm and segment length [b] of 0.1 μm). Upon the increase in salt concentration, fluorescent puncta appeared on the nearby glass surface (Fig. 1E and F), which may have been a result of dissociation of some GFP-Fis from the chromosome during this transition and which possibly contributed to the small expansion. Alternately, these small puncta may be clusters of GFP-Fis still bound to the nucleoid adherent to the coverslip. More expanded nucleoids in high salt were generally observed to have multiple-lobed structures (Fig. 1C) that may reflect the replication or segregation state of the chromosome (21).
We carried out a small number of experiments in which the DNA dye DAPI was added to the dilution buffer, which allowed us to simultaneously visualize GFP-Fis and the DNA content on the nucleoid. Figure 1G and H show a DAPI image of the same nucleoids as those in Fig. 1B and C visualized by GFP-Fis fluorescence, demonstrating that the GFP-Fis is present over the same diameter region as the DNA.
Fis in solution facilitates dissociation of GFP-Fis from isolated nucleoids.
In order to investigate facilitated dissociation of Fis for the whole chromosome, isolated nucleoids were exposed to 500 nM WT Fis. Subsequently, only two fluorescence images were acquired so as to minimize photobleaching: one immediately following addition of protein and another one 20 min later. It should be noted that there was a short interval, 30 to 60 s, between addition of protein and acquisition of the first image, which was consistent throughout the experiments.
Fluorescence images showed a large drop in fluorescence intensity over the 1,200-s interval (Fig. 2A), indicating the effect of WT Fis in solution on dissociation of GFP-Fis bound to the chromosome. To verify that the dissociation was not due to washing the protein by adding buffer, the same experiment was repeated with protein-free buffer, with which no reduction in fluorescence intensity was observed (Fig. 2B). Repeating the experiment for a lower protein concentration of 50 nM and measuring the normalized total fluorescence intensity in all three cases (Fig. 2C) indicated that dissociation of GFP-Fis bound to the chromosome was affected by WT Fis in solution in a concentration-dependent manner. In similar experiments with the 100 NaCl replaced by 100 mM potassium glutamate (a salt physiochemically more similar to that found in vivo than NaCl), we observed the same facilitated dissociation effect, indicating that it was not specific to NaCl-containing buffer (see Fig. S1 in the supplemental material).
FIG 2.
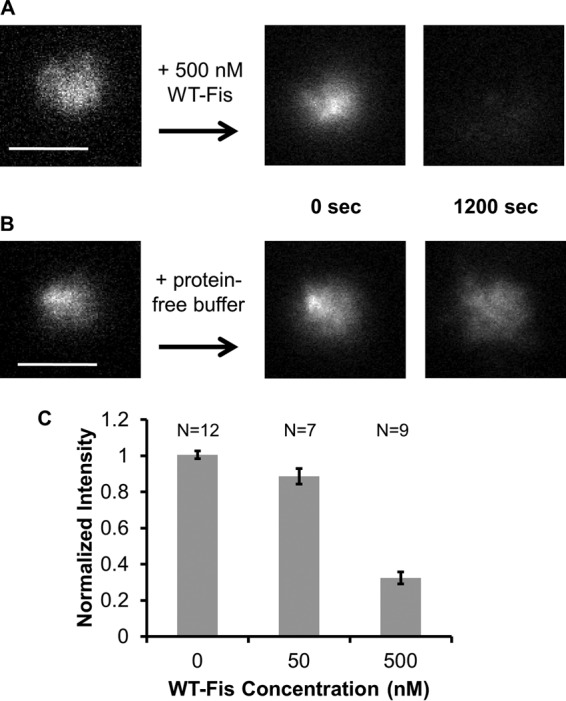
Facilitated dissociation of proteins from isolated nucleoids. Isolated GFP-Fis-labeled nucleoids were exposed to 500 nM WT Fis in 100 mM NaCl buffer (A) and protein-free 100 mM NaCl buffer (B). A large drop in fluorescence intensity was observed only in the case of 500 nM WT Fis. (C) Fluorescence intensity was measured after 20 min of incubation of nucleoids with protein-free buffer and 50 and 500 nM WT Fis, showing no protein dissociation for protein-free buffer and increased reduction of fluorescence with increased protein concentration. Scale bars are 5 μm.
We carried out a small number of experiments in which instead of WT Fis, E. coli HU protein was introduced (see Fig. S2 in the supplemental material). We observed that HU was able to accelerate GFP-Fis dissociation, albeit with a weaker concentration dependence than for WT Fis, in accord with behavior seen previously (5). Thus, heterotypic (structurally different) DNA-binding proteins can facilitate dissociation of protein-DNA complexes, as has been observed in single-DNA experiments (5).
Dynamics of facilitated dissociation of GFP-Fis.
To examine the dynamics of facilitated dissociation of GFP-Fis, after introduction of WT Fis in 100 mM NaCl buffer isolated onto nucleoids, fluorescence images were acquired at 30-s intervals for 20 min. These images were analyzed by measuring the total fluorescence intensity of the GFP-Fis-labeled nucleoids at each time point. A series of experiments were carried out for a range of WT Fis concentrations (0 to 400 nM). The raw fluorescence intensity profiles over the 20-min time course showed faster dissociation with increasing protein concentration (Fig. 3A; n = 5, 4, 2, 3, and 4 for 0, 50, 100, 200, and 400 nM, respectively); all data are normalized to the fluorescence level at the zero time point.
FIG 3.

Fis exchange time courses. (A) Concentration-dependent decrease in fluorescence intensity at 100 mM NaCl for a range of WT Fis concentrations. Fluorescence reduction at 0 nM was due to bleaching, from which the bleaching rate was obtained via an exponential fit to the 0 nM data (solid black line through 0 nM data points). (B) Same intensity profiles, corrected for bleaching. Curves were fit to exponential decay with offset to obtain exchange rates (n = 5, 4, 2, 3, and 4 for 0, 50, 100, 200, and 400 nM, respectively).
Having established that when WT Fis was not introduced into the sample, the level of GFP-Fis bound to chromosome stayed almost constant during the time course of our experiment (Fig. 2C), we concluded that the observed decrease in fluorescence intensity for the 0 nM WT Fis time course (Fig. 3A) was due to photobleaching. Fitting the 0 nM data by a monoexponential decay, (Fig. 3A, solid curve), gave the rate of bleaching in terms of a decay constant (λ) of (9.4 ± 1.4) × 10−4 s−1. This was used to correct for photobleaching via the equation
where I(t) is the measured intensity and Ic(t) is the bleaching-corrected intensity at time t. The corrected curves showed decaying intensity profiles, with a gradual reduction of the final fluorescence level (Fig. 3B). Intensity profiles were well fit by a monoexponential decay with offset, from which dissociation rates were obtained.
The average rate for each concentration was obtained from the average of fits to data sets from multiple experiments. Plotting the average rates as a function of protein concentration showed a nearly linear behavior for concentrations up to 200 nM and then saturation to a nearly constant rate at higher protein concentrations. The slope of the linear regime can be interpreted as an exchange reaction rate constant (kexch) (26); for Fig. 4, a linear fit up to 200 nM yields a kexch of (5.7 ± 1.1) × 104 M−1 s−1. The measured exchange rate constant for the whole chromosome agrees remarkably well with the value measured for a single DNA by Graham et al. (5). Thus, facilitated dissociation of proteins occurs on the E. coli chromosome with kinetics similar to those observed in single-DNA experiments.
FIG 4.
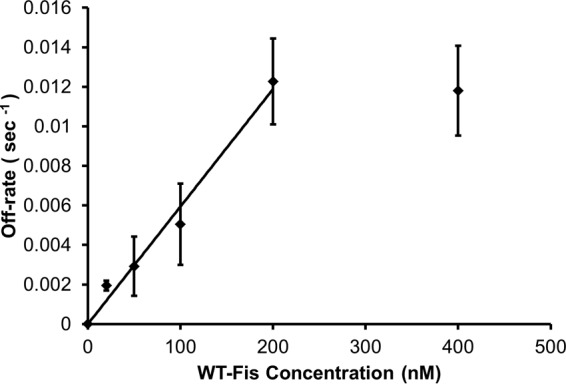
Fis exchange rates as function of WT Fis concentration in 100 mM NaCl buffer. Rates were obtained from the curve fits in Fig. 3. Data error is standard error (n = 5, 3, 4, 2, 3, and 4 for 0, 25, 50, 100, 200, and 400 nM, respectively). The initial linear behavior is fit by a rate constant (slope) of (5.7 ± 1.1) × 104 M−1 s−1 (straight line fit to first 5 data points).
Decreased salt concentration reduces the rate of facilitated dissociation.
A possible physical origin of the exchange reactions observed by Graham et al. has been proposed to be “microdissociation” events, whereby a protein loses some or all of its interactions with its binding site but remains near the DNA due to partial binding (11) or perhaps to longer-ranged electrostatic interactions (10, 32). In the absence of solution-phase protein, it is likely that the partially dissociated protein rebinds to the DNA. However, if a protein molecule is nearby the transiently opened binding site, it might replace the original protein. Recent theoretical work has explained this exchange reaction by taking into account the dimeric structure of Fis, which may allow partial dissociation of one side of a Fis dimer from a binding site, where a second protein from solution could bind (11).
The rate of these partial dissociations is related to the energy associated with DNA-protein contacts as well as long-range electrostatic interactions, which tend to become weaker with increased salt concentration. Therefore, one might expect to see the exchange reaction rate become slower with decreased salt concentration.
In order to examine the effect of salt on the exchange reaction, time course measurements were carried out at a lower salt concentration, 20 mM NaCl. Accelerated dissociation with increasing WT Fis concentration was again observed, but only for protein concentrations above 200 nM (Fig. 5A); for concentrations lower than 200 nM, essentially no dissociation was observed. To obtain the dissociation rates, curves were corrected for photobleaching (Fig. 5B) in the same manner as in the 100 mM NaCl case (we note that the photobleaching in the 20 mM NaCl was significantly less than that measured for 100 mM NaCl; in general, we noticed higher brightness and photostability of GFP at lower salt).
FIG 5.

Fis exchange kinetics in 20 mM NaCl buffer. (A) Concentration-dependent decrease in fluorescence intensity at 20 mM NaCl for a range of WT Fis concentrations. No exchange was observed for WT Fis concentrations up to 200 nM. (B) Same intensity profiles, corrected for bleaching. (C) Linear relationship between exchange rates and WT Fis concentration in 20 mM NaCl buffer and for WT Fis concentrations higher than 200 nM. Data error is standard error (n = 3 for each concentration). The linear region fits to a rate of (1.2 ± 0.2) × 104 M−1 s−1 (straight line fit to last 4 data points).
In the 20 mM NaCl case, we found that the photobleaching-corrected curves were well fit by a monoexponential decay with offset, from which dissociation rates were obtained. Plotting the off-rates as a function of concentration averaged over 10 experiments showed zero off-rate at low concentrations, followed by a linear relationship (Fig. 5C) from which an exchange rate constant (kexch) of (1.2 ± 0.3) × 104 M−1 s−1 was obtained. Comparing this rate constant with the one measured at a higher salt concentration (100 mM NaCl) indicates that the rate of reaction is roughly proportional to the salt concentration.
DISCUSSION
Facilitated dissociation in vitro, ex vivo, and in vivo.
The experiments in this study revealed that GFP-Fis remained stably bound to the chromosome in protein-free solution for long times, yet strikingly fast dissociation was triggered by the presence of Fis in solution. This facilitated dissociation effect had been observed previously in vitro on extended λ-DNA molecules (10, 32). The experiments in this study establish that a similar effect with remarkably similar kinetic rate (kexch ≈ 104 M−1 s−1 for 100 mM NaCl) occurs for folded chromosomes isolated from E. coli cells.
A major question is whether similar facilitated dissociation occurs in vivo. Our results suggest that in the molecularly crowded cell interior, the rates of replacement of proteins on DNA could well be orders of magnitude faster than what might be predicted from dilute-solution studies of binding kinetics. This may reconcile observations of surprisingly rapid turnover of proteins bound to DNA in vivo (13–15, 17) or other apparent inconsistencies between in vivo and in vitro dissociation rates (16). In the case of Fis, fluorescence recovery after photobleaching (FRAP) experiments with live E. coli cells indicate that GFP-Fis bound to the nucleoid has a binding lifetime of approximately 40 s (14), far shorter than the lifetime observed in this study for a nucleoid isolated to protein-free solution (Fig. 3, 0 nM data). In vivo, there is a high concentration of DNA-binding protein, and in particular the total concentration of Fis in a rapidly growing E. coli cell is roughly 30 to 50 μM (14, 18, 19), suggesting that the free Fis concentration should be at least as high as in the range of a few hundred nanomoles per liter. Notably, for GFP-Fis in the presence of WT Fis in solution, a 40-s binding lifetime is obtained for about 400 nM WT Fis (Fig. 4), roughly consistent with the unbound Fis concentration one would expect inside the cell. Of course, other free DNA-binding proteins may contribute to the net off-rate in vivo (e.g., HU; see the supplemental material, particularly Fig. S2); precisely quantifying this is a subject for future work.
Single-molecule experiments have shown that protein-facilitated dissociation of bound proteins from DNA is not limited to homotypic interactions (5), with HU and even eukaryotic chromatin high-mobility group B (HMGB) proteins observed to accelerate dissociation of Fis bound to DNA. Our observation that HU can accelerate dissociation of Fis from isolated nucleoids (see the supplemental material, particularly Fig. S2) suggests that the off-rate of Fis (and potentially other nucleoid proteins) might be accelerated in vivo beyond the level due to Fis-Fis exchange alone. The abundant nucleoid proteins, whose cellular levels vary with growth conditions (19), may therefore strongly influence dynamics of protein-DNA interactions on chromosomes, including protein-DNA search rates (1, 33, 34). Shifts in nucleoid protein concentration could provide a general mechanism to trigger rapid rearrangement of transcription factors and therefore reprogramming of transcriptional regulation. For example, during a nutrient upshift, cellular Fis levels can increase from being a minor constituent to the most abundant DNA binding protein in an E. coli cell in less than a cell cycle (18, 35). The rapid rise in Fis dimers may lead to global restructuring of the chromosome landscape through facilitated dissociation of existing proteins, in addition to effects mediated by direct binding to available sites by the nascent proteins.
We note that in accord with this general picture, the E. coli CueR transcription factor has recently been reported to exhibit binding lifetime changes in vivo in response to growth rate and its own cellular concentration (36). Quantitative understanding of the DNA binding dynamics of specific transcription factors like CueR will also likely require consideration of the free fraction of the abundant nucleoid proteins, such as Fis and HU.
Molecular mechanism of Fis-facilitated dissociation of Fis from the nucleoid.
The initial, nearly linear concentration dependence of Fis-facilitated dissociation of Fis (Fig. 4) is indicative of formation of a ternary complex between the initially bound Fis dimer and its DNA binding site and an additional “invading” Fis dimer from solution (hence the bulk concentration dependence). The precise molecular mechanisms are not immediately obvious from these data, but as mentioned in the introduction, at least two scenarios can be envisioned. First, “microdissociation” or partial dissociation of the bound dimer may occur, with interference or blocking of reassociation by the invading protein, as discussed previously (5, 11). An alternative scenario is formation of a ternary complex with both Fis dimers completely bound to nearby DNA locations, but with one protein destabilizing the other, for example, via allosteric interaction through the DNA itself (12). Roughly speaking, these two scenarios differ in that the first involves partial dissociation of the initially bound Fis preceding the arrival of the invader dimer, while the second does not.
It is conceivable that a fluorescence resonance energy transfer (FRET)-based single-molecule fluorescence experiment might be able to directly probe the series of binding and unbinding events that occur with sufficient temporal (millisecond to second range) and spatial (a few nanometers) resolution to directly test which of these classes of molecular mechanism are more likely. However, a possible hint about the nature of the underlying mechanism is provided by the data in Fig. 4. The initial slope of kexch, (5.7 ± 1.1) × 104 M−1 s−1, is much less than the roughly 109 M−1 s−1 expected for a diffusion-limited initial binding reaction (1). This indicates that the effect of the invader—i.e., its initial interaction with the prebound Fis-DNA complex—is rate limited not by diffusive search but rather by some other preceding reaction step, the activation of which has associated with it a probability of ∼10−4 (corresponding to an activation barrier of ∼12 kBT, where kBT = 4.1 × 10⁻²¹ J is the thermal energy per molecule at ambient temperature ~300 K) (5). This is very naturally explained in terms of a partial dissociation or other molecular reorganization that makes the Fis-DNA complex susceptible to invasion by the solution Fis dimer (5, 10, 11) and is much less easily understood in terms of diffusion-limited binding of the second dimer followed by (presumably rapid [12]) allosteric interaction.
A second hint of mechanism in Fig. 4 is provided by the final, high-concentration data point (400 nM), which suggests a high-concentration saturation of the off-rate at ∼10−2 s−1. This is indicative of the time scale associated with a rate-limiting activation step for the facilitated dissociation process, with a “waiting” time of ∼100 s. This is also more compatible with a slow activation/binding/dissociation pathway than with diffusion-limited-binding/allosteric interaction/dissociation pathway. Of course, it may be that the ternary complex has an ∼100-s lifetime preceding protein dissociation; this should be observable in a two-color single-molecule visualization experiment. While definitive data deciding which of these mechanisms (or perhaps some other mechanism) actually occurs may require millisecond/nanometer single-molecule molecular dynamics monitoring experiments, at present we favor models whereby an activation step of the Fis-DNA complex precedes interaction with the second invading protein (5, 10, 11).
Effect of salt concentration on facilitated dissociation from the nucleoid.
The effect of the salt concentration on the exchange reaction rate is reasonable, given that protein-nucleic acid interactions are highly salt dependent, with binding affinity of a protein to DNA typically decreasing quickly with increasing salt concentration. This can be explained by entropy gain associated with counterion release upon binding of a protein to DNA. The high electrostatic potential from the negatively charged DNA results in localization of counterions near the phosphates; similarly positively charged residues on a DNA-binding protein carry negative counterions near them. Binding of a protein to DNA allows release of some of the counterions into bulk solution (37). For low salt concentrations, this release is associated with a relatively large entropy increase, which reduces the free energy of the DNA-protein complex (38). For higher salt concentrations, there is less entropy gain upon binding and a reduction in affinity of the protein for DNA.
The dependence of a protein-DNA interaction free energy on salt concentration (S) can be estimated by where F0 is the free energy at a reference salt concentration (S0) and n is a constant which can be interpreted as the number of released counterions (37). The rate at which microdissociations occur is related to the energy associated with breaking DNA-protein contacts to form a state amenable to “invasion” by a second protein. For an Arrhennius-Kramers picture of thermally activated microdissociation, we write
(32); substituting for ΔF gives koff,micro(S) = koff,micro(S0) Sn, or a rate of partial dissociation that is proportional to a power of salt concentration. Finally, we suppose that the exchange rate constant is proportional to the rate at which the microdissociation occurs, giving kexch(S) = kexch(S0) (S/S0)n. This crude argument suggests that the salt dependence of the exchange rate constant (a 5-fold increase with a 5-fold increase in [NaCl] from 20 to 100 mM) corresponds to n of ≈1; i.e., that about one counterion is released to form the intermediate state. This rather small number of counterions released suggests that the intermediate state that leads to the facilitated dissociation of GFP-Fis from the nucleoid is only partially dissociated. Further experiments studying the effects of salt concentration in biochemical experiments are needed to analyze this in more detail.
Supplementary Material
ACKNOWLEDGMENTS
Work at NU was supported by a Catalyst Award from The Chicago Biomedical Consortium, funded by the Searle Funds at the Chicago Community Trust, by NSF grants DMR-1206868 and MCB-0240998, and by NIH grants GM105847 and CA193419. Work at UCLA was supported by NIH grant GM038509 (R.C.J.).
Footnotes
Supplemental material for this article may be found at http://dx.doi.org/10.1128/JB.00225-16.
REFERENCES
- 1.Halford SE, Marko JF. 2004. How do site-specific DNA-binding proteins find their targets? Nucleic Acids Res 32:3040–3052. doi: 10.1093/nar/gkh624. [DOI] [PMC free article] [PubMed] [Google Scholar]
- 2.Loparo JJ, Kulczyk AW, Richardson CC, van Oijen AM. 2011. Simultaneous single-molecule measurements of phage T7 replisome composition and function reveal the mechanism of polymerase exchange. Proc Natl Acad Sci U S A 108:3584–3589. doi: 10.1073/pnas.1018824108. [DOI] [PMC free article] [PubMed] [Google Scholar]
- 3.Joshi CP, Panda D, Martell DJ, Andoy NM, Chen TY, Gaballa A, Helmann JD, Chen P. 2012. Direct substitution and assisted dissociation pathways for turning off transcription by a MerR-family metalloregulator. Proc Natl Acad Sci U S A 109:15121–15126. doi: 10.1073/pnas.1208508109. [DOI] [PMC free article] [PubMed] [Google Scholar]
- 4.Luo Y, North JA, Rose SD, Poirier MG. 2014. Nucleosomes accelerate transcription factor dissociation. Nucleic Acids Res 42:3017–3027. doi: 10.1093/nar/gkt1319. [DOI] [PMC free article] [PubMed] [Google Scholar]
- 5.Graham JS, Johnson RC, Marko JF. 2011. Concentration-dependent exchange accelerates turnover of proteins bound to double-stranded DNA. Nucleic Acids Res 39:2249–2259. doi: 10.1093/nar/gkq1140. [DOI] [PMC free article] [PubMed] [Google Scholar]
- 6.Gibb B, Ye LF, Gergoudis SC, Kwon Y, Niu H, Sung P, Greene EC. 2014. Concentration-dependent exchange of replication protein A on single-stranded DNA revealed by single-molecule imaging. PLoS One 9:e87922. doi: 10.1371/journal.pone.0087922. [DOI] [PMC free article] [PubMed] [Google Scholar]
- 7.Kunzelmann S, Morris C, Chavda AP, Eccleston JF, Webb MR. 2010. Mechanism of interaction between single-stranded DNA binding protein and DNA. Biochemistry 49:843–852. doi: 10.1021/bi901743k. [DOI] [PMC free article] [PubMed] [Google Scholar]
- 8.Kim B, Eggel A, Tarchevskaya SS, Vogel M, Prinz H, Jardetzky TS. 2012. Accelerated disassembly of IgE–receptor complexes by a disruptive macromolecular inhibitor. Nature 491:613–617. doi: 10.1038/nature11546. [DOI] [PMC free article] [PubMed] [Google Scholar]
- 9.Paramanthan T, Reeves D, Friedman LJ, Kondev J, Gelles J. 2014. A general mechanism for competitor-induced dissociation of molecular complexes. Nat Commun 5:5207. doi: 10.1038/ncomms6207. [DOI] [PMC free article] [PubMed] [Google Scholar]
- 10.Cocco S, Marko JF, Monasson R. 2014. Stochastic ratchet mechanisms for replacement of proteins bound to DNA. Phys Rev Lett 112:238101. doi: 10.1103/PhysRevLett.112.238101. [DOI] [PMC free article] [PubMed] [Google Scholar]
- 11.Sing CE, Olvera de la Cruz M, Marko JF. 2014. Multiple-binding-site mechanism explains concentration-dependent unbinding rates of DNA-binding proteins. Nucleic Acids Res 42:3783–3791. doi: 10.1093/nar/gkt1327. [DOI] [PMC free article] [PubMed] [Google Scholar]
- 12.Kim S, Brostromer E, Xing D, Jin J, Chong S, Ge H, Wang S, Gu C, Yang L, Gao YQ, Su XD, Sun Y, Xie XS. 2013. Probing allostery through DNA. Science 339:816–819. doi: 10.1126/science.1229223. [DOI] [PMC free article] [PubMed] [Google Scholar]
- 13.Misteli T, Gunjan A, Hock R, Bustin M, Brown DT. 2000. Dynamic binding of histone H1 to chromatin in living cells. Nature 408:877–881. doi: 10.1038/35048610. [DOI] [PubMed] [Google Scholar]
- 14.Hadizadeh Yazdi N, Guet CC, Johnson RC, Marko JF. 2012. Variation of the folding and dynamics of the Escherichia coli chromosome with growth conditions. Mol Microbiol 86:1318–1333. doi: 10.1111/mmi.12071. [DOI] [PMC free article] [PubMed] [Google Scholar]
- 15.Catez F, Yang H, Tracey KJ, Reeves R, Misteli T, Bustin M. 2004. Network of dynamic interactions between histone H1 and high-mobility-group proteins in chromatin. Mol Cell Biol 24:4321–4328. doi: 10.1128/MCB.24.10.4321-4328.2004. [DOI] [PMC free article] [PubMed] [Google Scholar]
- 16.Hammar P, Wallden M, Fange D, Persson F, Baltekin O, Ullman G, Leroy P, Elf J. 2014. Direct measurement of transcription factor dissociation excludes a simple operator occupancy model for gene regulation. Nat Genet 46:405–408. doi: 10.1038/ng.2905. [DOI] [PMC free article] [PubMed] [Google Scholar]
- 17.Kumar M, Mommer MS, Sourjik V. 2010. Mobility of cytoplasmic, membrane, and DNA-binding proteins in Escherichia coli. Biophys J 98:552–559. doi: 10.1016/j.bpj.2009.11.002. [DOI] [PMC free article] [PubMed] [Google Scholar]
- 18.Ball CA, Osuna R, Ferguson KC, Johnson RC. 1992. Dramatic changes in Fis levels upon nutrient upshift in Escherichia coli. J Bacteriol 174:8043–8056. [DOI] [PMC free article] [PubMed] [Google Scholar]
- 19.Ishihama A, Kori A, Koshio E, Yamada K, Maeda H, Shimada T, Makinoshima H, Iwata A, Fujita N. 2014. Intracellular concentrations of 65 species of transcription factors with known regulatory functions in Escherichia coli. J Bacteriol 196:2718–2727. doi: 10.1128/JB.01579-14. [DOI] [PMC free article] [PubMed] [Google Scholar]
- 20.Cunha S, Odijk T, Suleymanoglu E, Woldringh CL. 2001. Isolation of the Escherichia coli nucleoid. Biochimie 83:149–154. doi: 10.1016/S0300-9084(01)01245-7. [DOI] [PubMed] [Google Scholar]
- 21.Wegner AS, Alexeeva S, Odijk T, Woldringh CL. 2012. Characterization of Escherichia coli nucleoids released by osmotic shock. J Struct Biol 178:260–269. doi: 10.1016/j.jsb.2012.03.007. [DOI] [PubMed] [Google Scholar]
- 22.Sloof P, Maagdelijn A, Boswinkel E. 1983. Folding of prokaryotic DNA. Isolation and characterization of nucleoids from Bacillus licheniformis. J Mol Biol 163:277–297. [DOI] [PubMed] [Google Scholar]
- 23.Dame RT, Dorman CJ. 2010. Bacterial chromatin. Springer, Dordrecht, the Netherlands. [Google Scholar]
- 24.McLeod SM, Xu J, Johnson RC. 2000. Coactivation of the RpoS-dependent proP P2 promoter by fis and cyclic AMP receptor protein. J Bacteriol 182:4180–4187. doi: 10.1128/JB.182.15.4180-4187.2000. [DOI] [PMC free article] [PubMed] [Google Scholar]
- 25.Johnson RC, Ball CA, Pfeffer D, Simon MI. 1988. Isolation of the gene encoding the Hin recombinational enhancer binding protein. Proc Natl Acad Sci U S A 85:3484–3488. doi: 10.1073/pnas.85.10.3484. [DOI] [PMC free article] [PubMed] [Google Scholar]
- 26.Ball CA, Johnson RC. 1991. Efficient excision of phage lambda from the Escherichia coli chromosome requires the Fis protein. J Bacteriol 173:4027–4031. [DOI] [PMC free article] [PubMed] [Google Scholar]
- 27.Pelletier J, Halvorsen K, Ha BY, Paparcone R, Sandler SJ, Woldringh CL, Wong WP, Jun S. 2012. Physical manipulation of the Escherichia coli chromosome reveals its soft nature. Proc Natl Acad Sci U S A 109:E2649–E2656. doi: 10.1073/pnas.1208689109. [DOI] [PMC free article] [PubMed] [Google Scholar]
- 28.Cayley S, Record MT Jr. 2003. Roles of cytoplasmic osmolytes, water, and crowding in the response of Escherichia coli to osmotic stress: biophysical basis of osmoprotection by glycine betaine. Biochemistry 42:12596–12609. doi: 10.1021/bi0347297. [DOI] [PubMed] [Google Scholar]
- 29.Xiao B, Zhang H, Johnson RC, Marko JF. 2011. Force-driven unbinding of proteins HU and Fis from DNA quantified using a thermodynamic Maxwell relation. Nucleic Acids Res 39:5568–5577. doi: 10.1093/nar/gkr141. [DOI] [PMC free article] [PubMed] [Google Scholar]
- 30.Cunha S, Woldringh CL, Odijk T. 2001. Polymer-mediated compaction and internal dynamics of isolated Escherichia coli nucleoids. J Struct Biol 136:53–66. doi: 10.1006/jsbi.2001.4420. [DOI] [PubMed] [Google Scholar]
- 31.Fisher JK, Bourniquel A, Witz G, Weiner B, Prentiss M, Kleckner N. 2013. Four-dimensional imaging of E. coli nucleoid organization and dynamics in living cells. Cell 153:882–895. doi: 10.1016/j.cell.2013.04.006. [DOI] [PMC free article] [PubMed] [Google Scholar]
- 32.Graham JS, Johnson RC, Marko JF. 2011. Counting proteins bound to a single DNA molecule. Biochem Biophys Res Commun 415:131–134. doi: 10.1016/j.bbrc.2011.10.029. [DOI] [PMC free article] [PubMed] [Google Scholar]
- 33.Elf J, Li GW, Xie XS. 2007. Probing transcription factor dynamics at the single-molecule level in a living cell. Science 316:1191–1194. doi: 10.1126/science.1141967. [DOI] [PMC free article] [PubMed] [Google Scholar]
- 34.Redding S, Greene EC. 2013. How do proteins locate specific targets in DNA? Chem Phys Lett 570:1–11. [DOI] [PMC free article] [PubMed] [Google Scholar]
- 35.Ali Azam T, Iwata A, Nishimura A, Ueda S, Ishihama A. 1999. Growth phase-dependent variation in protein composition of the Escherichia coli nucleoid. J Bacteriol 181:6361–6370. [DOI] [PMC free article] [PubMed] [Google Scholar]
- 36.Chen T-Y, Santiago AG, Jung W, Krzeminski L, Yang F, Martell DJ, Helmann JD, Chen P. 2015. Concentration and chromosome-organization dependent regulator unbinding from DNA for transcription regulation in living cells. Nat Commun 6:7445–7454. doi: 10.1038/ncomms8445. [DOI] [PMC free article] [PubMed] [Google Scholar]
- 37.Mascotti DP, Lohman TM. 1990. Thermodynamic extent of counterion release upon binding oligolysines to single-stranded nucleic acids. Proc Natl Acad Sci U S A 87:3142–3146. doi: 10.1073/pnas.87.8.3142. [DOI] [PMC free article] [PubMed] [Google Scholar]
- 38.Record MT Jr, Lohman ML, De Haseth P. 1976. Ion effects on ligand-nucleic acid interactions. J Mol Biol 107:145–158. doi: 10.1016/S0022-2836(76)80023-X. [DOI] [PubMed] [Google Scholar]
Associated Data
This section collects any data citations, data availability statements, or supplementary materials included in this article.