

Abstract
Background
Body weight has been increasing in the general population and is an established risk factor for hypertension, diabetes, and all-cause and cardiovascular mortality. Patients undergoing peritoneal dialysis (PD) gain weight, mainly during the first months of treatment. The aim of this study was to assess the relationship between body composition and metabolic and inflammatory status in patients undergoing PD.
Methods
This was a prospective, non-interventional study of prevalent patients receiving PD. Body composition was studied every 3 months using bioelectrical impedance (BCM®). We performed linear regression for each patient, including all BCM® measurements, to calculate annual changes in body composition. Thirty-one patients in our PD unit met the inclusion criteria.
Results
Median follow-up was 26 (range 17–27) months. Mean increase in weight was 1.8 ± 2.8 kg/year. However, BCM® analysis revealed a mean increase in fat mass of 3.0 ± 3.2 kg/year with a loss of lean mass of 2.3 ± 4.1 kg/year during follow-up. The increase in fat mass was associated with the conicity index, suggesting that increases in fat mass are based mainly on abdominal adipose tissue. Changes in fat mass were directly associated with inflammation parameters such as C-reactive protein (r = 0.382, P = 0.045) and inversely associated with high-density lipoprotein cholesterol (r=−0.50, P = 0.008).
Conclusions
Follow-up of weight and body mass index can underestimate the fat mass increase and miss lean mass loss. The increase in fat mass is associated with proinflammatory state and alteration in lipid profile.
Keywords: fat mass, inflammation, metabolic syndrome, peritoneal dialysis
Introduction
Body weight has been increasing in the general population, and obesity is now a major health problem. A recent multicentre study of the general population in Spain revealed a prevalence of obesity [body mass index (BMI) >30 kg/m2] of over 20% [1]. Moreover, obesity is an established risk factor for hypertension, metabolic syndrome, diabetes mellitus, cardiovascular disease, and all-cause and cardiovascular mortality [2, 3].
Patients undergoing peritoneal dialysis (PD) gain weight during at least the first months of treatment, mainly due to an increase in intra-abdominal fat [4]. However, survival studies in PD patients are controversial [5]. Some authors have tried to estimate lean mass based on creatinine kinetics [6], although the results are subject to limitations. Bioelectrical impedance analysis is a convenient and inexpensive technique that can estimate body composition and overhydration. It has been validated using the gold standard approach for each parameter in healthy patients and in those undergoing PD [7–10].
The availability of bioelectrical impedance spectroscopy (BIS) enables us to monitor fat and lean mass [8–10]. Most published studies on BIS in patients receiving PD analyse volume status [11, 12]. Little is known about changes in body composition in patients undergoing PD or the variables determining outcome.
The aim of this study was to assess the relationship between body composition, metabolic and inflammatory status, and progress over time in PD patients.
Materials and methods
We performed a prospective, non-interventional study of prevalent PD patients. We prospectively studied changes in body composition and the variables involved.
Patients with major amputations or pacemakers were excluded. Patients were required to complete three BIS measurements and 9 months of follow-up for inclusion. Informed consent was required prior to inclusion in the study. From June 2009 to February 2012, 31 of the patients treated with PD at our dialysis unit met the inclusion criteria. Mean age was 57.4 ± 18 years, and 54.8% were female. Mean time on PD was 11.4 ± 7 months. Median follow-up was 26 (range 17–27) months. A total of 29% of patients were on automated PD and 19.5% were using icodextrin-based solutions.
Body composition and laboratory parameters
We measured anthropometric parameters (height, weight and waist circumference) and calculated BMI. The conicity index was calculated using the equation defined by Valdez et al. [13]:
We used the Body Composition Monitor (BCM®; Fresenius Medical Care, Bad Homburg, Germany) to calculate the body composition. Several bioimpedance-based methods are available. Single-frequency bioimpedance is based on empirical equations of the resistance or impedance at 50 Hz. Bioimpedance spectroscopy by contrast offers the possibility to determine intra- and extracellular water (ECW) independently [14]. This is important to calculate the body composition irrespectively of the fluid overload. Moreover, there are different formulas to calculate ECW, intracellular water and body composition, which are non-equivalent [14–18]. Fat mass in the BCM® model has been validated against dual energy X-ray absorptiometry (DEXA) and air displacement plethysmography [8, 19, 20]. Validation models against DEXA show a mean difference of −1.1 kg [19, 20]. However, since our study analyses annual changes, this difference should not constitute a major bias.
The BCM® calculates fat and lean mass, including total amount (kg), percentage of fat and lean tissue with respect to body weight, and the fat (FTI) and lean tissue indices (adjusted for body surface, kg/m2). BCM® and other anthropometric measurements were performed after 10 min in decubitus with the peritoneal cavity empty.
Body composition was measured every 3 months, or more often if clinically necessary. A mean of 10.4 ± 3.3 BCM® measurements per patient were taken (interquartile range 9.5–12). We did a simple linear regression for each patient with every BCM® parameter to calculate its evolution over time. The b-value in a linear regression is the slope of the line that best summarizes the pattern of the data. Using the b-value we analysed the evolution over time of the previously described body composition parameters (fat mass, fat percentage, fat tissue index, hydration, etc.).
Hydration status (OH) was normalized to ECW (OH/ECW × 100) using a range of −7%, 7% to define normohydration. OH/ECW >15% is related to mortality, so we used this cut-off to define severe fluid overload as described elsewhere [11, 21, 22].
We studied glucose and lipid metabolism and inflammation parameters. All blood samples were taken at the same visit as the anthropometric and body composition measurements. The homeostatic model assessment (HOMA index) was also calculated [23]. Baseline and final values were recorded. Changes in laboratory parameters were expressed as the difference between final and initial values and adjusted according to the time of the study in years.
The Charlson comorbidity index and all details of the prescription of PD were also analysed. Peritoneal glucose absorption was calculated based on the D/Do formula. The D/Do formula we used was peritoneal absorbed glucose = (1 − D/Do)·x, where ‘x’ is the total amount of glucose infused throughout the day. The D/Do is defined by membrane transport characteristics on a standardized peritoneal equilibration test [24]; we used the mean value based on peritoneal transport characteristics (0.19, 0.32, 0.44 and 0.55 for high, high-average, low-average and low transporters, respectively) [25].
Statistical analysis
Variables were expressed as mean ± SD or percentage, as appropriate. The Kolmogorov–Smirnov test showed all variables to be normally distributed, except C-reactive protein (CRP) and the HOMA index, which were normalized using logarithms. A P-value >0.2 was required to assume a normal distribution.
Data were analysed using the chi-square test, t-test (including one-sample t-test and paired-samples t-test), Pearson correlation and linear regression. Non-parametric analyses were used to compare subgroups with fewer than 30 patients. P-values <0.05 were considered statistically significant. The statistical analysis was performed using SPSS V.17 for Windows (SPSS®, Chicago, IL, USA).
Results
Baseline data
Baseline patient characteristics are shown in Table 1.
Table 1.
Baseline characteristics
| BMI (kg/m2) | 25.1 ± 3.9 |
| Age (years) | 57.4 ± 18 |
| Male (%) | 45.2% |
| Automated PD | 29% |
| Icodextrin solutions | 19.5% |
| Peritoneal absorbed glucose (g/day) | 57 (44–101) |
| Waist circumference (cm) | 97.07 ± 11.8 |
| Conicity index | 1.33 ± 0.1 |
| Charlson comorbidity index [median (IQR)] | 2 (2–4) |
| Cholesterol [mmol/L (mg/dL)] | 5.06 ± 1.01 (195.7 ± 39.0) |
| Triglycerides [mmol/L (mg/dL)] | 1.44 ± 0.66 (127.2 ± 58.9) |
| C-reactive protein (mg/dL) [median (IQR)] | 0.32 (0.19–0.87) |
| Albumin (g/L) | 38.7 ± 3.4 |
| HOMA index [median (IQR)] | 2.4 (1.2–4.09) |
| Urine output (mL/day) [median (IQR)] | 1200 (700–2000) |
| Renal weekly Kt/V | 1.07 ± 0.77 |
| Total weekly Kt/V | 2.47 ± 0.51 |
| Fat tissue index (kg/m2) | 8.4 ± 4.0 |
| Lean tissue index (kg/m2) | 16.3 ± 3.5 |
| Overhydration (L) | 1.01 ± 2.1 |
| Extracellular water (L) | 17.01 ± 4.2 |
| Intracellular water (L) | 20.7 ± 5.8 |
| Total body water (L) | 37.7 ± 9.8 |
| Overhydration/extracellular water (%) | 4.9 ± 10.7 |
| Underhydration/normohydration/ overhydration/severe overhydration (%) |
9.7/41.9/ 38.7/9.7 |
The percentage of fat was significantly higher in women than in men (27.8 ± 8.5% versus 18.7 ± 9.6%, P = 0.011). A direct correlation was found between the FTI, age (r = 0.541, P = 0.002, Figure 1A), vintage (r = 0.496, P = 0.005), waist circumference (r = 0.654, P < 0.001) and conicity index (r = 0.653, P < 0.001, Figure 1B).
Fig. 1.

Baseline FTI correlations. FTI and age (A) and conicity index (B).
Intraperitoneal absorbed glucose was inversely associated with renal creatinine clearance (r= −0.477, P = 0.007) and renal weekly Kt/V (r= −0.489, P = 0.007) (Figure 2). Intraperitoneal glucose absorption was higher in patients using high glucose solutions (65.7 ± 43.7 mg/day versus 126.5 ± 66.5 mg/day, P = 0.008). We found no differences in glucose absorption in diabetic patients or patients using icodextrin-based solutions and no differences based on dialysate/plasma creatinine groups or vintage.
Fig. 2.

Inverse correlation between residual Kt/V and intraperitoneal glucose absorption.
Prospective analysis
Based on the annual change rates of the different body composition parameters, body weight increased during PD (mean 1.8 ± 2.8 kg/year), although the mean increase in total fat mass was 3.0 ± 3.2 kg/year and lean mass decreased significantly during this time (−2.3 ± 4.1 kg/year). The mean increase in FTI was 1.5 ± 1.6 kg/m2/year (Table 2). Moreover, significant differences were detected in most body composition parameters when only the initial and final values were compared, except in hydration status.
Table 2.
Evolution of body composition parameters
| Parameter | Baseline BIS | Final BIS | P | Annual rate of change | P |
|---|---|---|---|---|---|
| Weight (kg) | 67.6 ± 14.6 | 70.6 ± 14.1 | 0.002 | 1.8 ± 2.8 | 0.002 |
| BMI (kg/m2) | 25.1 ± 3.9 | 26.4 ± 3.8 | 0.001 | 0.7 ± 1.1 | 0.001 |
| Fat mass (kg) | 16.0 ± 7.4 | 20.8 ± 7.7 | <0.001 | 3.0 ± 3.2 | <0.001 |
| Fat tissue index (kg/m2) | 8.4 ± 4.0 | 10.8 ± 4.1 | <0.001 | 1.5 ± 1.6 | <0.001 |
| Fat percentage (%) | 23.9 ± 9.9 | 29.7 ± 10.3 | <0.001 | 3.6 ± 4.1 | <0.001 |
| Lean tissue mass (kg) | 44.4 ± 14.1 | 40.4 ± 13.9 | 0.004 | −2.3 ± 4.1 | 0.005 |
| Lean tissue index (kg/m2) | 16.3 ± 3.5 | 14.9 ± 3.7 | 0.005 | −0.8 ± 1.5 | 0.006 |
| Lean tissue percentage (%) | 65.1 ± 12.8 | 56.6 ± 14.0 | <0.001 | −4.9 ± 5.5 | <0.001 |
| Overhydration (kg) | 1.01 ± 2.1 | 1.47 ± 1.6 | N.S. | 0.06 ± 1.4 | N.S. |
| Extracellular water (L) | 17.01 ± 4.2 | 17.2 ± 4.3 | N.S. | −0.02 ± 1.1 | N.S. |
| Intracellular water (L) | 20.7 ± 5.8 | 19.7 ± 5.8 | 0.032 | −0.6 ± 1.5 | 0.044 |
| Total body water (L) | 37.7 ± 9.8 | 37.02 ± 9.7 | N.S. | −0.6 ± 1.9 | N.S. |
| Overhydration/extracellular water (%) | 4.9 ± 10.7 | 7.7 ± 7.5 | N.S. | 1.4 ± 8.6 | N.S. |
‘Annual rate of change’ describes the mean ± SD of all the patients' linear regression slopes corresponding to the different parameters. N.S., not significant.
Table 3 shows the changes in inflammatory parameters and lipid and glucose metabolism.
Table 3.
Changes in inflammation and metabolic parameters
| Delta per year | |
|---|---|
| CRP (mg/dL) | 0.05 (−0.21, 0.28) |
| ESR (mm/h) | 5.9 (−10.78, 18.26) |
| Glucose (mmol/L/year); (mg/dL/year) | 0.36 (−0.52, 2.51); 6.5 (−9.38, 45.16) |
| Hb1AC (%) | 0.0 (−0.28, 0.26) |
| Triglycerides (mmol/L/year); (mg/dL/year) | 0.04 (−0.31, 0.38); 3.6 (−27.27, 33.3) |
| Total cholesterol (mmol/L/year); (mg/dL/year) | −0.68 (−1.44, 0.27); −26.4 (−55.5, 10.5) |
| HDL cholesterol (mmol/L/year); (mg/dL/year) | −0.11 (−0.31, −0.03); −4.36 (−12.0, −1.09) |
| LDL cholesterol (mmol/L/year); (mg/dL/year) | −0.62 (−1.27, 0.10); −24.0 (−49.2, 4.0) |
Difference between baseline and final value adjusted per year. Values are expressed as median (IQR). LDL, low-density lipoprotein.
Outcomes for fat mass differed depending on the time on PD before starting the study; during the first 18 months, FTI increased by 2.4 ± 0.6 kg/m2/year, compared with 0.6 ± 1.0 kg/m2/year during the following years. An inverse correlation was found between fat mass at the first BIS measurement and the rate of fat tissue changes (r= −0.398, P = 0.032, Figure 3A). Changes in FTI were associated with changes in CRP (r = 0.382, P = 0.045, Figure 3B) and in high-density lipoprotein (HDL) cholesterol (r = −0.50, P = 0.008, Figure 3C). In multiple linear regression, changes in CRP (P = 0.038) and HDL cholesterol (P = 0.033) were independently associated with changes in FTI in a model adjusted for sex and baseline fat percentage (Table 4).
Fig. 3.
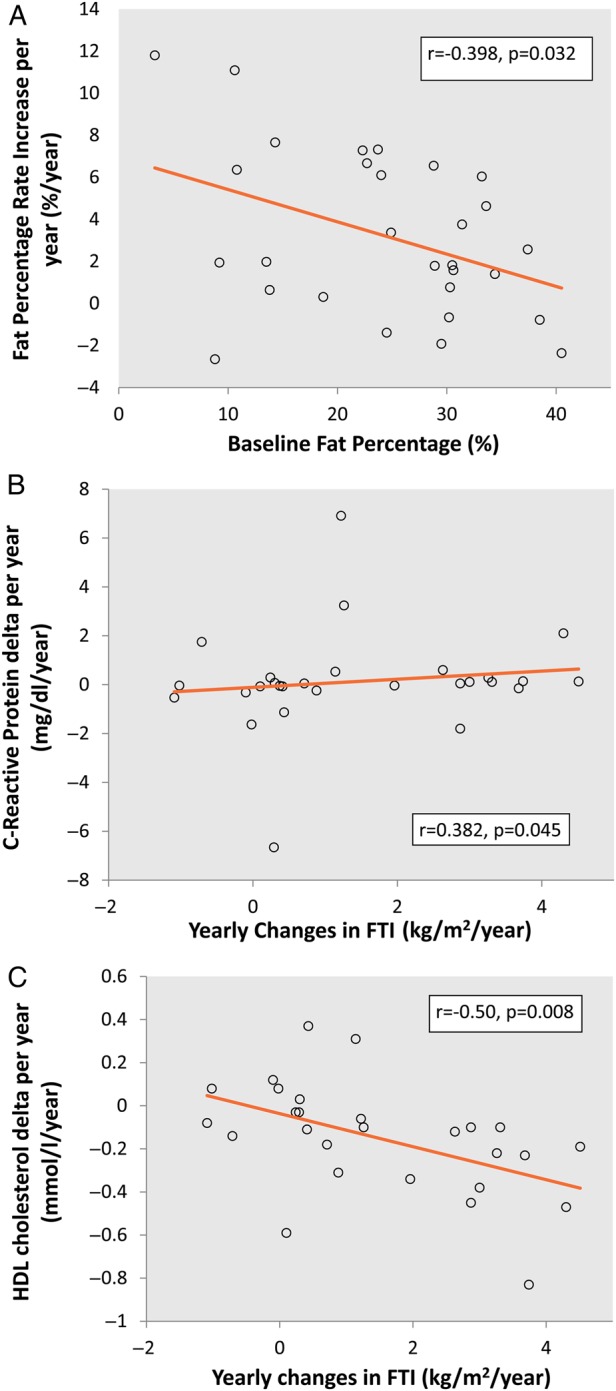
Correlations between rates of increase in fat mass. (A) Inverse correlation between baseline fat percentage and fat percentage rate increase. (B) FTI rate increase and change in CRP per year. (C) FTI increase rate per year and change in HDL cholesterol per year.
Table 4.
Associations of yearly changes in FTI (kg/m2/year) with change in CRP per year, change in HDL cholesterol per year, sex and baseline fat percentage
| Coefficient | P | |
|---|---|---|
| HDL cholesterol delta per year (mmol/L/year) | −0.113 | 0.033 |
| CRP delta per year (mg/dL/year) | 2.54 | 0.038 |
| Sex | 0.021 | N.S. |
| Baseline fat percentage (%) | −0.213 | N.S. |
Multiple linear regression. N.S., not significant.
No association was detected between the rate of fat mass changes and sex, age, comorbidity (including diabetes) or absorption of intraperitoneal glucose.
Discussion
Our study shows that patients undergoing PD have increased fat mass and that this change is associated with a proinflamatory state and modifications in insulin resistance and lipid profile. Some studies have shown that patients undergoing PD gain fat mass after initiation of PD [4, 26–29]. Our study shows the progress of body composition based on BCM® measurements in prevalent patients over 2.5 years of follow-up and reveals increased fat mass with time on PD; however, this increase is faster during the first 18 months. We recorded a mean increase in weight less than 2 kg/year and an increase in fat mass of 3 kg/year. These findings emphasize the importance of body composition analysis. Although weight and BMI are easy to determine, they can be difficult to interpret. Follow-up of weight and BMI can underestimate the increase in fat mass and miss detection of lean mass loss, which in our patients was higher than 2 kg/year. These findings were also supported by the decrease in intracellular water, as a consequence of a lesser content of water in fat tissue and a decrease in lean mass.
The causes of increased fat mass in patients undergoing PD have not been completely clarified, although intraperitoneal glucose absorption does seem to play a role [30–32]. PD solutions involve glucose overload and can provide up to 500 kcal/day. Moreover, the use of glucose-free solutions, such as icodextrin or amino acid-based dialysis solutions, can result in different metabolic profiles from those observed when glucose-based solutions are used [33] and have been shown to reduce the increase in fat mass when compared with hypertonic glucose solutions [26]. However, some studies found an association between increased fat mass and total energy (intake plus absorbed glucose), but not with absorbed glucose [27, 34]. Mechanisms other than energy overload generated by glucose may be involved [32, 35].
We found no correlation between intraperitoneal glucose absorption and increase in fat mass. Unlike other authors [26], we found no association between the use of icodextrin dialysis solutions and the outcome of fat mass in our PD patients. We believe this can be explained by the fact that we are particularly careful to avoid glucose overload and try to minimize the use of hypertonic solutions. In cases of ultrafiltration failure, especially in anuric patients, we usually switch patients to haemodialysis quickly. Fewer than 20% of the patients studied were using hypertonic solutions, and most were also receiving icodextrin. This is probably the reason why we did not record a difference in outcome between patients receiving glucose-based solutions and those receiving glucose-free solutions.
Patients with a lower baseline FTI showed faster increases in fat mass. Similar findings were described in two recent studies [27, 34]. The increase in fat mass is also faster during the first 18 months on PD. We have no explanation for this difference, although these findings could suggest a metabolic adaptation to increased energy overload. Patients with previously higher energy inputs due to peritoneal glucose absorption in PD or a higher energy intake could be less susceptible to an increase in fat mass. However, new studies are needed to confirm this hypothesis.
Despite contradictory results in survival studies, the influence of fat tissue in inflammation and cardiovascular events is well known, as is the effect of fat mass distribution on outcomes. Visceral adipose tissue has an important metabolic activity (unlike systemic fat) and is considered an independent cardiovascular risk factor [36–38]. The metabolic activity of visceral fat tissue and its production of proinflammatory factors have been investigated. Some studies show increases in CRP values associated with fat tissue in patients with chronic kidney disease (CKD) [39] and in those undergoing haemodialysis [40, 41]. In patients with CKD, production of proinflammatory molecules in abdominal subcutaneous fat adjusted for BMI is even higher than in patients who do not have CKD [42].
The conicity index estimates fat accumulation in the abdomen as the deviation of body shape from a cylindrical towards a double-cone shape [13]. The linear relationship between increased fat mass and changes in conicity index in our patients suggests that gains in fat mass are based mainly on abdominal adipose tissue. Moreover, a direct correlation was found between changes in FTI and in CRP. These results suggest that the increased fat mass observed in PD patients is associated with a chronic proinflammatory state. Both CRP and conicity index are risk factors for mortality in dialysis patients [43, 44].
We found a decrease in intracellular water, which is probably due to the decrease in lean mass (r = 0.884, P < 0.001). A total of 38.7 and 9.7% of patients, respectively, were fluid overloaded and severely fluid overloaded, with no statistically significant differences during follow-up.
One of the most important limitations of our study is its small sample size. Most of the patients were on the kidney transplant waiting list. We tried to avoid hypertonic solutions and to encourage anuric patients with ultrafiltration failure to accept starting haemodialysis. Therefore, our transfer rates to kidney transplant or to haemodialysis are high, resulting in a short mean time on PD and reduced use of hypertonic solutions. Further studies with larger samples and a longer time under PD are necessary to confirm our results.
New PD solutions are available, although glucose is still the most widely used osmotic agent, and most PD solutions are glucose-based solutions [45]. Icodextrin dialysis solutions have been shown to reduce increases in fat mass [26], although only one exchange a day can be used. Amino acid-based peritoneal solutions could improve the amino acid profile and protein malnutrition in continuous ambulatory PD patients with low protein intakes [46, 47]. As these solutions induce metabolic acidosis and the metabolic advantages in standard PD patients are not well established when compared with standard solutions, amino acid-based solutions are not widely used [47–50].
In conclusion, changes in body composition in patients undergoing PD can stimulate a proinflammatory state, alteration in lipid profile and increase in insulin resistance, all of which are important cardiovascular risk factors. Reduced glucose exposure is probably one of the most important targets when attempting to prevent increased fat mass and its consequences.
Conflict of interest statement
None declared.
References
- 1.Escribano Garcia S, Vega Alonso AT, Lozano Alonso J et al. Obesity in Castile and Leon, Spain: epidemiology and association with other cardiovascular risk factors. Rev Esp Cardiol 2011; 64: 63–66 [DOI] [PubMed] [Google Scholar]
- 2.Whitlock G, Lewington S, Sherliker P et al. Body-mass index and cause-specific mortality in 900 000 adults: collaborative analyses of 57 prospective studies. Lancet 2009; 373: 1083–1096 [DOI] [PMC free article] [PubMed] [Google Scholar]
- 3.Adams KF, Schatzkin A, Harris TB et al. Overweight, obesity, and mortality in a large prospective cohort of persons 50 to 71 years old. N Engl J Med 2006; 355: 763–778 [DOI] [PubMed] [Google Scholar]
- 4.Fernstrom A, Hylander B, Moritz A et al. Increase of intra-abdominal fat in patients treated with continuous ambulatory peritoneal dialysis. Perit Dial Int 1998; 18: 166–171 [PubMed] [Google Scholar]
- 5.Glanton CW, Hypolite IO, Hshieh PB et al. Factors associated with improved short term survival in obese end stage renal disease patients. Ann Epidemiol 2003; 13: 136–143 [DOI] [PubMed] [Google Scholar]
- 6.Keshaviah PR, Nolph KD, Moore HL et al. Lean body mass estimation by creatinine kinetics. J Am Soc Nephrol 1994; 4: 1475–1485 [DOI] [PubMed] [Google Scholar]
- 7.Ward LC, Dyer JM, Byrne NM et al. Validation of a three-frequency bioimpedance spectroscopic method for body composition analysis. Nutrition 2007; 23: 657–664 [DOI] [PubMed] [Google Scholar]
- 8.Chamney PW, Wabel P, Moissl UM et al. A whole-body model to distinguish excess fluid from the hydration of major body tissues. Am J Clin Nutr 2007; 85: 80–89 [DOI] [PubMed] [Google Scholar]
- 9.Furstenberg A, Davenport A. Assessment of body composition in peritoneal dialysis patients using bioelectrical impedance and dual-energy x-ray absorptiometry. Am J Nephrol 2011; 33: 150–156 [DOI] [PubMed] [Google Scholar]
- 10.Chamney PW, Kramer M, Rode C et al. A new technique for establishing dry weight in hemodialysis patients via whole body bioimpedance. Kidney Int 2002; 61: 2250–2258 [DOI] [PubMed] [Google Scholar]
- 11.Van Biesen W, Williams JD, Covic AC et al. Fluid status in peritoneal dialysis patients: the European Body Composition Monitoring (EuroBCM) study cohort. PLoS One 2011; 6: e17148. [DOI] [PMC free article] [PubMed] [Google Scholar]
- 12.Devolder I, Verleysen A, Vijt D et al. Body composition, hydration, and related parameters in hemodialysis versus peritoneal dialysis patients. Perit Dial Int 2010; 30: 208–214 [DOI] [PubMed] [Google Scholar]
- 13.Valdez R, Seidell JC, Ahn YI et al. A new index of abdominal adiposity as an indicator of risk for cardiovascular disease. A cross-population study. Int J Obes Relat Metab Disord 1993; 17: 77–82 [PubMed] [Google Scholar]
- 14.Jaffrin MY, Morel H. Body fluid volumes measurements by impedance: a review of bioimpedance spectroscopy (BIS) and bioimpedance analysis (BIA) methods. Med Eng Phys 2008; 30: 1257–1269 [DOI] [PubMed] [Google Scholar]
- 15.Moissl UM, Wabel P, Chamney PW et al. Body fluid volume determination via body composition spectroscopy in health and disease. Physiol Meas 2006; 27: 921–933 [DOI] [PubMed] [Google Scholar]
- 16.Kyle UG, Bosaeus I, De Lorenzo AD et al. Bioelectrical impedance analysis—part I: review of principles and methods. Clin Nutr 2004; 23: 1226–1243 [DOI] [PubMed] [Google Scholar]
- 17.Kyle UG, Bosaeus I, De Lorenzo AD et al. Bioelectrical impedance analysis-part II: utilization in clinical practice. Clin Nutr 2004; 23: 1430–1453 [DOI] [PubMed] [Google Scholar]
- 18.Teruel-Briones JL, Fernandez-Lucas M, Ruiz-Roso G et al. Analysis of concordance between the bioelectrical impedance vector analysis and the bioelectrical impedance spectroscopy in haemodialysis patients. Nefrologia 2012; 32: 389–395 [DOI] [PubMed] [Google Scholar]
- 19.Moissl U, Bosaeus I, Lemmey A et al. Validation of a 3C model for determination of body fat mass. J Am Soc Nephrol 2007; 18: 257A [Google Scholar]
- 20.Wabel P, Chamney P, Moissl U et al. Importance of whole-body bioimpedance spectroscopy for the management of fluid balance. Blood Purif 2009; 27: 75–80 [DOI] [PMC free article] [PubMed] [Google Scholar]
- 21.Wabel P, Moissl U, Chamney P et al. Towards improved cardiovascular management: the necessity of combining blood pressure and fluid overload. Nephrol Dial Transplant 2008; 23: 2965–2971 [DOI] [PubMed] [Google Scholar]
- 22.Wizemann V, Wabel P, Chamney P et al. The mortality risk of overhydration in haemodialysis patients. Nephrol Dial Transplant 2009; 24: 1574–1579 [DOI] [PMC free article] [PubMed] [Google Scholar]
- 23.Matthews DR, Hosker JP, Rudenski AS et al. Homeostasis model assessment: insulin resistance and beta-cell function from fasting plasma glucose and insulin concentrations in man. Diabetologia 1985; 28: 412–419 [DOI] [PubMed] [Google Scholar]
- 24.Twardowski ZJ. Clinical value of standardized equilibration tests in CAPD patients. Blood Purif 1989; 7: 95–108 [DOI] [PubMed] [Google Scholar]
- 25.Smit W, Langedijk MJ, Schouten N et al. A comparison between 1.36% and 3.86% glucose dialysis solution for the assessment of peritoneal membrane function. Perit Dial Int 2000; 20: 734–741 [PubMed] [Google Scholar]
- 26.Cho KH, Do JY, Park JW et al. Effect of icodextrin dialysis solution on body weight and fat accumulation over time in CAPD patients. Nephrol Dial Transplant 2010; 25: 593–599 [DOI] [PubMed] [Google Scholar]
- 27.Choi SJ, Kim NR, Hong SA et al. Changes in body fat mass in patients after starting peritoneal dialysis. Perit Dial Int 2011; 31: 67–73 [DOI] [PubMed] [Google Scholar]
- 28.Johansson AC, Samuelsson O, Haraldsson B et al. Body composition in patients treated with peritoneal dialysis. Nephrol Dial Transplant 1998; 13: 1511–1517 [DOI] [PubMed] [Google Scholar]
- 29.Pellicano R, Strauss BJ, Polkinghorne KR et al. Longitudinal body composition changes due to dialysis. Clin J Am Soc Nephrol 2011; 6: 1668–1675 [DOI] [PubMed] [Google Scholar]
- 30.Grodstein GP, Blumenkrantz MJ, Kopple JD et al. Glucose absorption during continuous ambulatory peritoneal dialysis. Kidney Int 1981; 19: 564–567 [DOI] [PubMed] [Google Scholar]
- 31.Holmes CJ. Reducing cardiometabolic risk in peritoneal dialysis patients: role of the dialysis solution. J Diabetes Sci Technol 2009; 3: 1472–1480 [DOI] [PMC free article] [PubMed] [Google Scholar]
- 32.Huh JY, Seo EY, Lee HB et al. Glucose-based peritoneal dialysis solution suppresses adiponectin synthesis through oxidative stress in an experimental model of peritoneal dialysis. Perit Dial Int 2012; 32: 20–28 [DOI] [PMC free article] [PubMed] [Google Scholar]
- 33.Gokal R, Moberly J, Lindholm B et al. Metabolic and laboratory effects of icodextrin. Kidney Int 2002; 62 (Suppl 81): S62–S71 [DOI] [PubMed] [Google Scholar]
- 34.Vasselai P, Kamimura MA, Bazanelli AP et al. Factors associated with body-fat changes in prevalent peritoneal dialysis patients. J Ren Nutr 2008; 18: 363–369 [DOI] [PubMed] [Google Scholar]
- 35.Wang X, Axelsson J, Nordfors L et al. Changes in fat mass after initiation of maintenance dialysis is influenced by the uncoupling protein 2 exon 8 insertion/deletion polymorphism. Nephrol Dial Transplant 2007; 22: 196–202 [DOI] [PubMed] [Google Scholar]
- 36.Zhu S, Wang Z, Heshka S et al. Waist circumference and obesity-associated risk factors among whites in the third National Health and Nutrition Examination Survey: clinical action thresholds. Am J Clin Nutr 2002; 76: 743–749 [DOI] [PubMed] [Google Scholar]
- 37.Lapidus L, Bengtsson C, Larsson B et al. Distribution of adipose tissue and risk of cardiovascular disease and death: a 12 year follow up of participants in the population study of women in Gothenburg, Sweden. BMJ 1984; 289: 1257–1261 [DOI] [PMC free article] [PubMed] [Google Scholar]
- 38.Iglesias P, Diez JJ. Adipose tissue in renal disease: clinical significance and prognostic implications. Nephrol Dial Transplant 2010; 25: 2066–2077 [DOI] [PubMed] [Google Scholar]
- 39.Carvalho LK, Barreto Silva MI, da Silva Vale B et al. Annual variation in body fat is associated with systemic inflammation in chronic kidney disease patients Stages 3 and 4: a longitudinal study. Nephrol Dial Transplant 2012; 4: 1423–1428 [DOI] [PubMed] [Google Scholar]
- 40.Miyamoto T, Rashid Qureshi A, Heimburger O et al. Inverse relationship between the inflammatory marker pentraxin-3, fat body mass, and abdominal obesity in end-stage renal disease. Clin J Am Soc Nephrol 2011; 6: 2785–2791 [DOI] [PMC free article] [PubMed] [Google Scholar]
- 41.Ishimura E, Okuno S, Tsuboniwa N et al. Relationship between fat mass and serum high-sensitivity C-reactive protein levels in prevalent hemodialysis patients. Nephron Clin Pract 2011; 119: c283–c288 [DOI] [PubMed] [Google Scholar]
- 42.Witasp A, Carrero JJ, Heimburger O et al. Increased expression of pro-inflammatory genes in abdominal subcutaneous fat in advanced chronic kidney disease patients. J Intern Med 2011; 269: 410–419 [DOI] [PubMed] [Google Scholar]
- 43.Cordeiro AC, Qureshi AR, Stenvinkel P et al. Abdominal fat deposition is associated with increased inflammation, protein-energy wasting and worse outcome in patients undergoing haemodialysis. Nephrol Dial Transplant 2010; 25: 562–568 [DOI] [PubMed] [Google Scholar]
- 44.Kang SH, Cho KH, Park JW et al. Risk factors for mortality in stable peritoneal dialysis patients. Ren Fail 2012; 34: 149–154 [DOI] [PubMed] [Google Scholar]
- 45.Garcia-Lopez E, Lindholm B, Davies S. An update on peritoneal dialysis solutions. Nat Rev Nephrol 2012; 8: 224–233 [DOI] [PubMed] [Google Scholar]
- 46.Kopple JD, Bernard D, Messana J et al. Treatment of malnourished CAPD patients with an amino acid based dialysate. Kidney Int 1995; 47: 1148–1157 [DOI] [PubMed] [Google Scholar]
- 47.Arfeen S, Goodship TH, Kirkwood A et al. The nutritional/metabolic and hormonal effects of 8 weeks of continuous ambulatory peritoneal dialysis with a 1% amino acid solution. Clin Nephrol 1990; 33: 192–199 [PubMed] [Google Scholar]
- 48.le Poole CY, van Ittersum FJ, Weijmer MC et al. Clinical effects of a peritoneal dialysis regimen low in glucose in new peritoneal dialysis patients: a randomized crossover study. Adv Perit Dial 2004; 20: 170–176 [PubMed] [Google Scholar]
- 49.le Poole CY, Welten AG, Weijmer MC et al. Initiating CAPD with a regimen low in glucose and glucose degradation products, with icodextrin and amino acids (NEPP) is safe and efficacious. Perit Dial Int 2005; 25 (Suppl 3): S64–S68 [PubMed] [Google Scholar]
- 50.Dervisoglu E, Ozdemir O, Yilmaz A. Commencing peritoneal dialysis with 1.1% amino acid solution does not influence biochemical nutritional parameters in incident CAPD patients. Ren Fail 2010; 32: 653–658 [DOI] [PubMed] [Google Scholar]