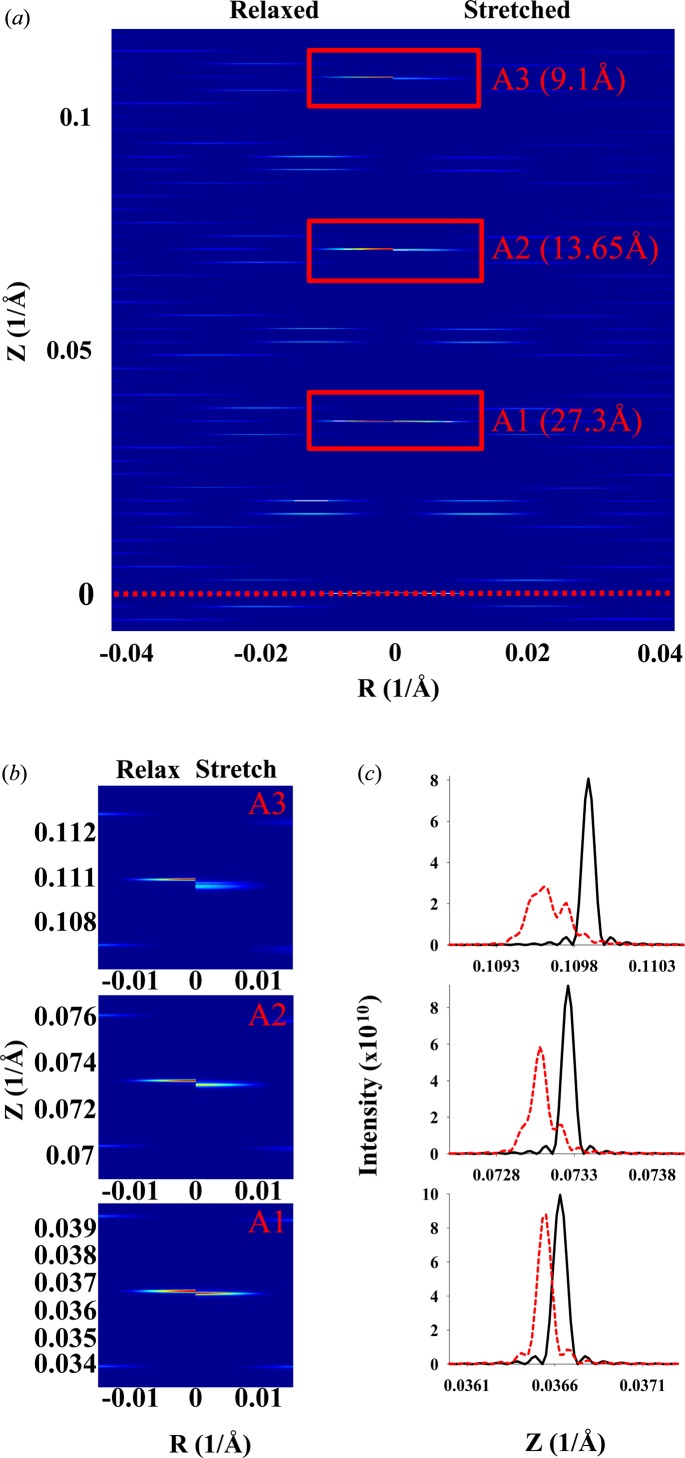
A theoretical formulation for the diffraction from nonuniformly strained helical molecular assemblies is presented. The predictions of this theory are discussed in the context of double-stranded DNA and actin filaments in the presence and absence of nonuniform strains.
Keywords: fiber diffraction, helical molecules, nonuniform strain, DNA, actin
Abstract
The fibrous proteins in living cells are exposed to mechanical forces interacting with other subcellular structures. X-ray fiber diffraction is often used to assess deformation and movement of these proteins, but the analysis has been limited to the theory for fibrous molecular systems that exhibit helical symmetry. However, this approach cannot adequately interpret X-ray data from fibrous protein assemblies where the local strain varies along the fiber length owing to interactions of its molecular constituents with their binding partners. To resolve this problem a theoretical formulism has been developed for predicting the diffraction from individual helical molecular structures nonuniformly strained along their lengths. This represents a critical first step towards modeling complex dynamical systems consisting of multiple helical structures using spatially explicit, multi-scale Monte Carlo simulations where predictions are compared with experimental data in a ‘forward’ process to iteratively generate ever more realistic models. Here the effects of nonuniform strains and the helix length on the resulting magnitude and phase of diffraction patterns are quantitatively assessed. Examples of the predicted diffraction patterns of nonuniformly deformed double-stranded DNA and actin filaments in contracting muscle are presented to demonstrate the feasibly of this theoretical approach.
1. Introduction
Fibrous proteins are ubiquitous in biology, forming the basis of connective tissues, muscle and amyloid systems among many others (Orgel & Irving, 2014 ▸). Nucleic acids, especially DNA, either naturally adopt or can be induced to form helical structures as well (Mahendrasingam et al., 1986 ▸; Franklin & Gosling, 1953 ▸). While such macromolecular assemblies are generally intractable to conventional crystallographic approaches, X-ray fiber diffraction can be the method of choice to extract structural information from such molecular assemblies that have been induced to form aligned sols or gels by flow or magnetic fields (Chandrasekaran & Stubbs, 2012 ▸; Stubbs, 1999 ▸) and also, in many cases, from in situ measurements of protein assemblies in tissue or even living organisms (Orgel & Irving, 2014 ▸; Barrea et al., 2014 ▸). All such systems are characterized by helical symmetry of varying complexity (Vainshtein, 1966 ▸; Fraser & MacRae, 1973 ▸). Fibrous molecular arrangements with helical symmetry are also characteristic of many synthetic polymer systems.
The modern understanding of helical diffraction theory was first described by Cochran et al. (1952 ▸) and considerably enhanced by Klug et al. (1958 ▸), and the effects of various kinds of disorder have been treated by Vainshtein (1966 ▸) and by Fraser & McCrae (1973 ▸). However, all these approaches assume fixed values for the helical parameters. While these may be appropriate for helical molecular assemblies that are not under tension, in living cells many of the molecular assemblies in question may be deformed by interaction forces with other proteins or fibers. Consequently, the resulting X-ray diffraction patterns will contain information concerning these nonuniformly deformed helices, but, using the theory based on fixed values for the helical parameters, only average values can be extracted from deformed structures. While these average values for the inter-monomer spacings may accurately represent the behavior of the structure as a whole, they could be misleading when trying to achieve a detailed understanding of specific molecular interactions that are local in nature.
An example where local interactions lead to nonuniformly stretched helical structures is the case of a striated muscle during contraction. Muscle contracts by the interaction of the motor domains of individual myosin molecules in myosin-containing thick filaments with the binding sites on actin-containing thin filaments, forming so-called crossbridges (Squire & Knupp, 2005 ▸). Each motor domain, or myosin head, is usually assumed to act as an independent force generator. The strain on a given segment of an actin filament varies with the number of myosin heads bound, their spatial position along the length of the filament and the cumulative force, i.e. the sum of crossbridge forces from the free end of the actin at that particular segment. A detailed understanding of this strain distribution will be necessary to formulate realistic models of actomyosin interactions that can predict the behavior of individual crossbridges when generating force. Huxley et al. (1994 ▸) and Wakabayashi et al. (1994 ▸) calculated the extensibility of actin filaments in contracting muscle fibers from X-ray diffraction patterns using changes in the spacing of the 2.73 nm meridional reflection (and higher orders), yielding mean values of the strain on the filament. A single value for the strain, i.e. uniform helix periodicities along the actin filament, would predict a symmetric narrow meridional X-ray diffraction peak profile, whereas, according to our preliminary studies (Takezawa et al., 2005 ▸; Prodanovic et al., 2015 ▸; Prodanovic, Irving, McOwen & Mijailovich, 2014 ▸; Prodanovic, Irving, Stojanovic & Mijailovich, 2014 ▸), X-ray diffraction patterns from nonuniformly deformed actin filaments would exhibit asymmetric profiles, similar to the observations. Therefore, the peak shapes provide a potential opportunity to extract information concerning strain distributions in actin filaments that can, in turn, lead to more detailed (and realistic) models of actomyosin interaction. In order to achieve this, however, it is necessary to be able to predict the peak shapes accurately from a starting model of the nonuniformly distorted helical structure.
Fibrous protein systems are increasingly being approached by atomistic-level modeling efforts that try to match trial structures against X-ray diffraction data (e.g. Poole et al., 2006 ▸; Samatey et al., 2001 ▸; Oda et al., 2009 ▸; Oshima et al., 2012 ▸). As we have seen, the diffraction data include not just spacing and intensity information but also peak shape information that will reflect underlying deviations from perfect symmetry induced by local molecular interactions. Any effort to extract more information from the data requires the ability to calculate X-ray patterns accurately from the trial structures and assemblies of the trial structures. These trial structures can be refined against the data in an iterative procedure. The methodology we propose here for analyzing deformed helices allows for the calculation of realistic intensity profiles and spacing values for a nonuniform helical molecular structure in reciprocal (diffraction) space. We develop theoretical expressions that allow prediction of the diffraction from nonuniformly deformed helices. These predictions are compared with those of uniformly deformed or relaxed helices, emphasizing the effect of the degree and distribution of helix deformation, number of helices and helix length. We examine the cases of a continuous helical wire and a discontinuous helix represented by helically arranged subunits. We show examples of how these cases may be applied to strained structures of double-helical DNA and actin filaments in muscle. The theoretical approach presented here allows the prediction of the diffraction pattern from an individual strained helical molecular structure. This diffraction pattern can then be used in combination with multiscale modeling approaches to predict the diffraction from assemblies of such structures, taking into account various forms of disorder and how assemblies of such structures may evolve with time in response to local forces. A detailed presentation of the application of this methodology to the strained actin filament system in contracting muscle will appear elsewhere.
2. Methods
2.1. Diffraction from helical filamentous structures
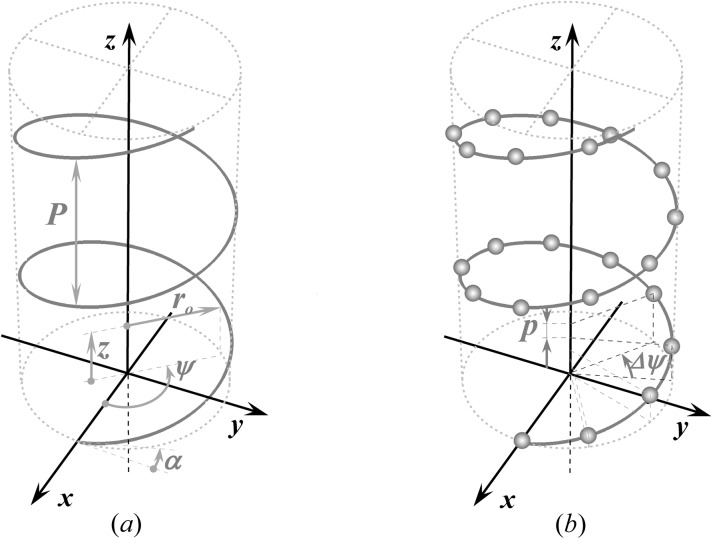
Most cytoskeletal filaments, such as actin, myosin, tropomyosin, collagen, DNA, coiled coils and alpha helices, are composed of helically arranged subunits. As a first approximation, these helical structures can be represented as a continuous uniform wire (Squire & Knupp, 2005 ▸). As the hypoteneuse of a triangle wrapped around a cylinder, this wire forms a helix inclined at an angle α = tan−1(P/2πr 0) along the cylinder (Fig. 1 ▸ a). The axial rise of the helix is defined by the radius of the cylinder, r 0, and α. One complete turn of the helix around the cylinder axis is called the helix pitch, P (Vainshtein, 1966 ▸). The helically arranged subunits, such as actin monomers, myosin molecules, individual nucleotides or amino acids, are separated by the axial distance between the subunits, p, commonly called the ‘subunit axial translation’ or ‘unit rise’ (Squire & Knupp, 2005 ▸), and by the incremental turns, Δψ. The number of subunits in one pitch defines the angular shift between the units (Fig. 1 ▸ b). However, typically the number of subunits, p/P, is not a whole number, and thus these so-called ‘nonintegral helices’ (Squire, 1981 ▸) may require several helical pitches until a subunit can be found at the exactly equivalent azimuthal position of some starting subunit. The axial distance between this unit and the starting subunit is defined as the true repeat distance C. Thus, any helical structure can be defined as the number of subunits, n s, in n t turns of the helix, denoted as an n s/n t helix, where C = n t P = n s p (Squire, 1981 ▸, Vainshtein, 1966 ▸) and Δψ = 2πn t/n s.
Figure 1.
The geometry of a continuous and a discontinuous helix. (a) In cylindrical coordinates, r, ψ, z, a continuous helix or helical wire is characterized by the radius of the cylinder r 0 and the angle of the helix rise α or the helix pitch P, i.e. the axial rise for one complete turn of the helix around the cylinder axis. (b) A discontinuous helix is represented by a set of selected points where helically arranged subunits are centered. The position of the discrete points is defined by the axial distance between two neighboring points p or by the increment in the helix angle Δψ.
2.2. Fourier transform in cylindrical coordinates
In cylindrical coordinates, a continuous helix or a helical wire is defined as r = r 0, ψ = 2πz/P, z = z. The Fourier transform in three dimensions in cylindrical coordinates has the form
 |
where f(r, ψ, z) is the object function, R, Ψ, Z are the cylindrical coordinates in reciprocal space, the exponent in the exponential term is the scalar product of coordinates in real and reciprocal space, and rdrdψdz is the infinitesimal volume. Substituting cos(Ψ − ψ) = sin(Ψ − ψ + π /2) and sin(Ψ − ψ + π/2) = [1/(2i)][exp(iω) − exp(−iω)] = [1/(2i)](t − t −1), where ω = Ψ − ψ + π/2 and t = exp(iω), the exponential term in equation (1) can be re-expressed using the formula for generating Bessel functions (Lebedev, 1972 ▸) as
where Jn(2πrR) are Bessel functions of the first kind. Finally, the exponential term in equation (1) can be written as
 |
Now we can write the expression for the Fourier transform in cylindrical coordinates as
where gn(r, Z) is the ‘helical structure factor’ (Diaz et al., 2010 ▸):
2.3. Deformed continuous helix
The X-ray diffraction patterns from deformed helices, even with a piecewise change of monomer spacings, cannot be simply described via the conventional helical selection rules (Vainshtein, 1966 ▸; Diaz et al., 2010 ▸; Squire, 1981 ▸). Thus we formulate here a mathematical description of the Fourier transform of nonuniformly deformed helices. In cylindrical coordinates, the z coordinate is proportional to ψ, and thus at z = P the angle ψ is equal to 2π. For constant P, the equation of the helix is defined as r = r
0, ψ = 2πz/P. However, for nonuniformly deformed helices, P varies with z and the helix is defined as dψ/dz = 2π/P(z). For simplicity of notation, we can define the equation for a nonuniformly deformed helix as ψ = 2πz/ (z), where
  (z) is an integral pitch function that accounts for the difference between an axially deformed helix and a helix with constant pitch at any z. Because the pitch P(z) in deformed helices can vary continuously, or more realistically in a piecewise manner, we will define the relationship between P(z) and
  (z) for each specific case.
Let us consider first the Fourier transform for a continuous helix of a nonuniformly deformed wire of radius r 0 with continuously varying pitch P(z). The helix object function f(r, ψ, z), assuming that the density along the helix is unity, can be represented as the product of two δ functions:
The helical structure factor [equation (5)] that takes into account the object function of a helical wire [equation (6)] is defined as
 |
Here, ψ has nonzero values only at  , so the integrand becomes an exponential function of z only. This simplifies the shape function to
after the trivial integration  .
.
Substituting equation (8) into equation (4), we define the Fourier transform of a nonuniformly deformed helix. Because δ(r − r
0) has a nonzero value only at the helix radius r
0, the integral over r in equation (4),  , is equal to its integrand at r
0, i.e.
r
0
J
n(2πr
0
R). Finally, equation (4) simplifies to
 |
2.4. Continuous helix of finite length
Fibrous proteins have a finite length and the X-ray reflections are affected by the fiber ends, which means that diffraction from shorter fibers will be more affected by end effects. Thus, for a helical filament of length L, the integral over z in equation (9) becomes
In order to illustrate the differences between continuous undeformed and nonuniformly deformed helices, we show below (e.g. Figs. 5, 7 and 9) the patterns of a helix of constant pitch, P
0, compared with a helix of linearly changing axial strain, ∊(ζ) = Δ∊(ζ − ζ0)/ , i.e. a helix with a continuously changing pitch, P(ζ), where Δ∊ is the strain at the helix (undeformed) length
  , and assuming that ζ = ζ0 is the filament helix free end, i.e. ∊(ζ0) = 0.
For helices of constant pitch, most investigators have used the conventional helical selection rules (Vainshtein, 1966 ▸; Diaz et al., 2010 ▸; Squire, 1981 ▸) and typically assumed helices with long lengths, where end effects do not play a significant role. However, for short lengths the end effects can be large, and this effect is taken into account by simple integration of equation (10). The integral In(Z) for  = P
0 is
In contrast, even in the simple case of a continuous helix deformed by a linearly increasing strain, the formulation for a deformed helix undergoing large strains is complex. We assume that, during deformation, all points on the helix move only axially, from an undeformed coordinate ζ to a deformed helix at coordinate z, at fixed ψ. This formulation provides a simple relationship between the deformed and undeformed helices as ψ(z) = ψ0(ζ) = 2πζ/P 0 at r = r 0, where ψ(z) is the nonuniformly deformed helix at coordinate z, and ψ0(ζ) is the undeformed helix angle at undeformed coordinate ζ. The relationship between the undeformed and deformed coordinates, ζ and z, respectively, is defined as
For a linear increase in strain along an undeformed helix of length  , from ∊(ζ0) = 0 to
  = Δ∊, the deformed coordinate z(ζ) is
If we now express ζ as a function of z, the deformed helix can be defined as
 |
or
where
 |
We can also find the continuous change of pitch, P(z), from 
Note that, when Δ∊  0,
0,  , after finding the limit of equation (16) using L’Hopital’s rule, and also from equation (17)
P(z)
  P
0.
P
0.
The exact solution [equation (14)] may not be intuitive, but by using the Taylor-series expansion of the square root function we can derive an approximate solution that defines ψ(z) as a product of the solution of an undeformed helix and a Taylor series of terms Δ∊z/ , which define the departure from this solution when the strain increases linearly along the helix axis z, from ∊ = 0 at z = 0 to ∊ = Δ∊ at the undeformed helix length
  (see Appendix A
). This solution also provides expressions for
  and P(z) in terms of Taylor series, which can clearly show how nonlinear terms from a continuous change in the strain affect
  and P(z). From these expressions, it is easy to see that, for small strains (Δ∊ < 2%), the first few terms are sufficient to calculate the Fourier transform and both
  and P(z)
  P
0 when Δ∊
  0. However, for large strains, for example Δ∊ = 20%, at least five terms should be taken into account to describe the deformed helix sufficiently accurately.
If we define the integral pitch function,  , for a continuously changing strain along the helix, the integrand in equation (10) becomes a complicated function and the integral In(Z) cannot be obtained analytically. Thus, we integrated equation (10) numerically for all values of n and Z using the trapezoidal rule and then calculated the Fourier transform using equation (9).
For a continuous helix the phase is only shown with a complex exponential term in equation (9). Since we are calculating it from −L/2 to L/2, the integral [equation (10)] has only real values [equation (11)], so the phase is only shown in terms of the complex exponential, i.e. it arises exclusively from the exp[in(Ψ + π/2)] terms in the sum over all Bessel-function-weighted real values of the product Jn(2πr 0 R)In(Z) [see equation (9)]. However, in more complex cases such as the discontinuous deformed helix, the integral boundaries in equation (10) may not be symmetric because the origin of z may not be set in the middle of the helix length. Thus, In(z) also becomes a complex number and contributes to the phase, in addition to the exponential term explained above.
2.5. Continuous helix with a piecewise change in pitch
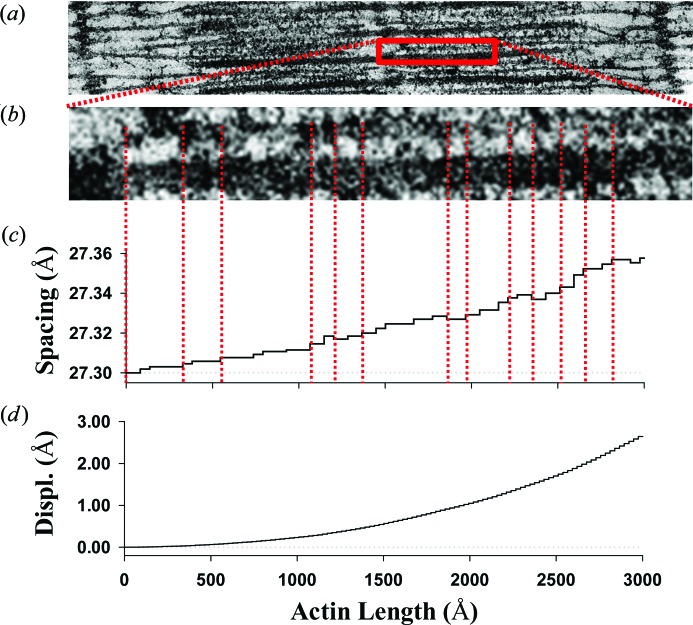
In general, P(z) can be an arbitrary function of z, but in most realistic cases it is better described as a piecewise function along a filament length with multiple segments, each with a constant pitch, where P(z) changes value at the discrete axial locations along the helical structure where bound molecules transfer the force between, for example, actin and myosin filaments (Fig. 2 ▸). In this case the helix is also defined as a piecewise function, having a change of slope of the helix at  , and P(z) can be represented as series of
  values at each segment
  =
=  −
−  (Fig. 3 ▸
a). Note that for a finite (deformed) filament length, L =
  . Setting the coordinates z
0 = 0 and ψ(z
0) = 0, the first segment (
 = 1) of the helix is defined in standard form as ψ(z) = 2πz/P
1 for z
0 ≤ z ≤ z
1. The second segment (
 = 2) needs to satisfy continuity of ψ(z) at z
1 where the pitch changes from P
1 to P
2 and ψ(z) = 2π[(1/P
1 − 1/P
2)z
1 + z/P
2] for z
1 ≤ z ≤ z
2. Repeating the same method
  times leads to the following recurrence relation for each segment
  :
:
for  ≤ z ≤
≤ z ≤  . Here, ψ has nonzero values only at
  , so the integrand in equation (8) becomes an exponential function of z only. This simplifies the shape function for each segment
  to
to
 |
Note here that, for each segment  , the integration reduces to a periodic solution after putting in front of the integral the continuity factor for a piecewise deformed helix.
Figure 2.
The monomer spacing of an actin filament stretched during fully developed isometric tension. (a) Electron micrograph (H. E. Huxley, unpublished) showing interdigitated actin and myosin filaments in frog (skeletal) sarcomere lattice. (b) Detail from part (a), showing the positions of myosin heads attached to actin filaments (crossbridges), denoted by red dashed lines. (c) The piecewise change in spacing between neighboring actin monomers coincides with the locations of myosin molecules bound to actin sites. Here, interactions are shown between only one myosin filament with one actin filament [red dashed lines between panels (b) and (c)], but in the hexagonal lattice shown in the band of part (a), three myosin filaments will interact with each actin filament so the piecewise changes in spacing will be about three times more frequent than shown. Note that the spacing typically increases from the free end of an actin filament towards the z axis, mimicking the increase in the tensile force in actin filaments. On some rare occasions, however, the spacing decreases reflect the effect of compressive forces in bound crossbridges. (d) The displacements of actin monomers relative to the position of the actin free end.
Figure 3.
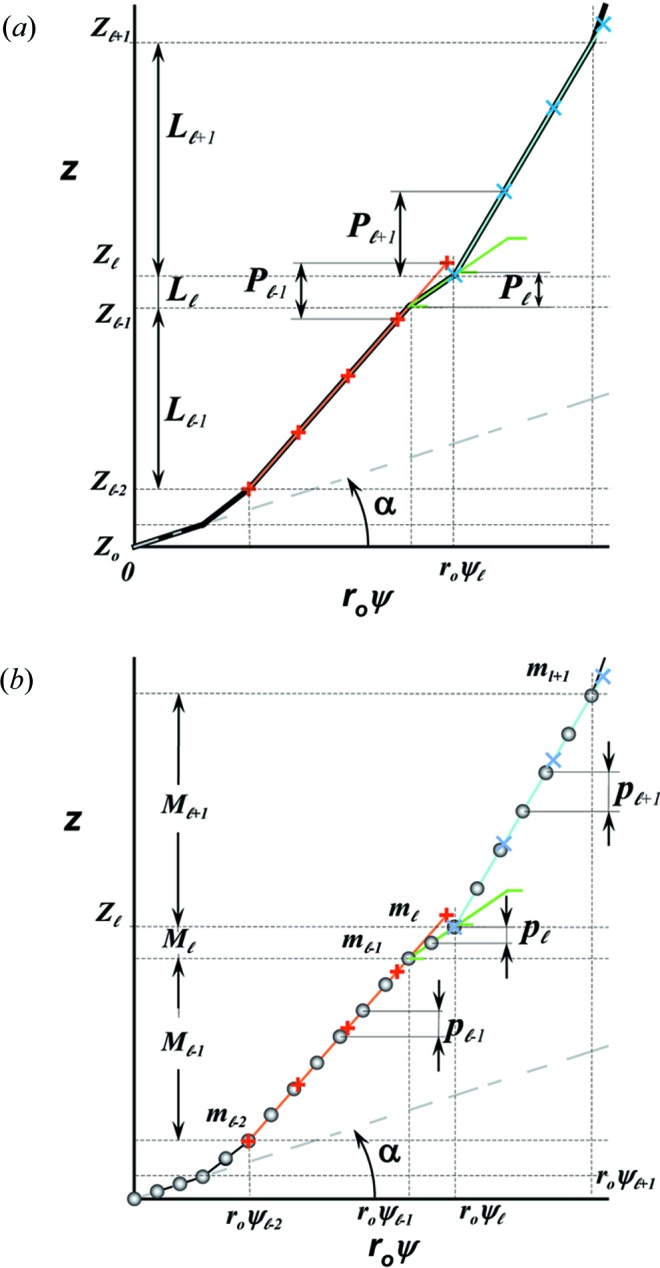
Stretched helical structures in terms of a radial projection. The undeformed helix from Fig. 1 ▸(a) is represented in a radial projection as a straight line inclined at an angle α (gray dashed lines) and, similarly, the undeformed helical strands of subunits from Fig. 1 ▸(b) form a radial net of points along the same straight line (Squire & Knupp, 2005 ▸). However, the deformed helix with piecewise changes in the inter-subunit spacings shows changes in slope in the radial projection, i.e. the change in spacings modulates the angle α between the points where the spacing changes, but maintains straight lines between the points where the slope does not change. The change in slope also modulates the pitch, P. (a) A continuous helix with spacing changes for the first 21 actin monomers from Fig. 2 ▸. The changes in spacings are defined at  and ψℓ or r
0ψℓ in the radial projection. The length of constant pitch segments is defined as L
ℓ = z
ℓ − z
ℓ−1, where the index ℓ denotes the current number of the segment with the constant pitch P
ℓ. The first point of the helix is set to be at z
0 = 0 and ψ0 = 0. The index of the coordinate of each segment end point, i.e. the coordinate where the slope changes, is set to coincide with the current segment number ℓ. Three consecutive segments with constant pitches are illustrated by light-red, green and cyan lines, and the points along these line segments indicating one complete pitch with red crosses, green horizontal ticks and light-blue crosses, respectively. (b) The subunits, depicted as gray spheres, follow the segment slopes from part (a). The index of each subunit is denoted as m. The subunit number at position
  is denoted
  and the subunit spacing within the segment as
  . Note that the length of the segment
  is shorter than one pitch, i.e.
 =
=  <
<  . The number of spacings in the segment
  is denoted
  .
.
Now the integral shown in equation (10) can be replaced with a sum of integrals from  [equation (19)] between
  and
and  over all segments
  :
:
 |
Integrating equation (20) and substituting into equation (9), the Fourier transform of a piecewise deformed helix becomes
 |
where
is a factor that assures continuity between the azimuthal angles ψ and axial positions z between neighboring segments with different pitches. The superscript CH denotes a continuous helix. Because  is a complex number it can be represented as a magnitude and a phase. Thus, for the complete reconstruction of a real-space object from an X-ray diffraction pattern it is necessary to know both the magnitude and the phase. Conversely, for known coordinates of the deformed actin filament at the axial positions of bound crossbridges, we can uniquely predict the magnitude and phase of the X-ray diffraction pattern.
2.6. Diffraction from a nonuniformly deformed discontinuous helix
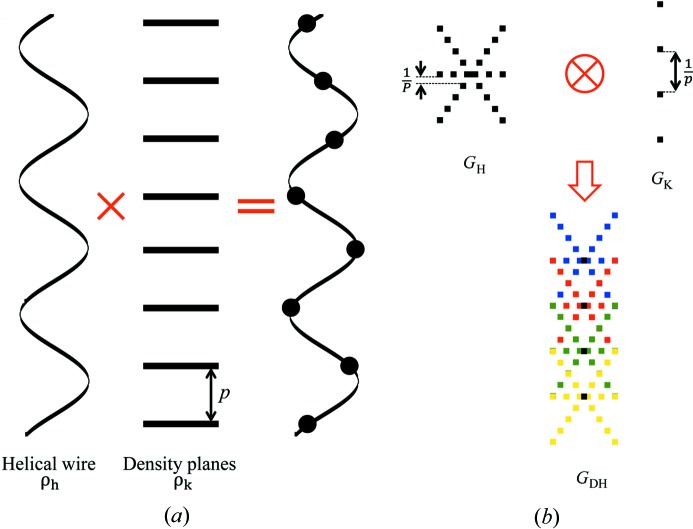
The helical arrangement of subunits in filaments also requires that each atom in the subunit follows the same helical path. For simplicity we use equivalent subunits, representing groups of atoms by the equivalent center of mass and the subunit diameter, rather than individual atoms. The repeating subunits form a string of points on a continuous helix passing through the center of mass of the subunits (Figs. 1 ▸ b and 3 ▸ b). Thus, for each subunit in, for example, an actin filament, each monomer will contain this subunit at a helical radius r 0, axially separated from the next in a string by a distance p, forming a so-called discontinuous helix, DH, of pitch P (Vainshtein, 1966 ▸; Diaz et al., 2010 ▸; Squire, 1981 ▸). Mathematically, this string of points on an undeformed (or uniformly deformed) helix can be defined as the product of a continuous helix with a set of equidistant planes perpendicular to the helix axis (Fig. 4 ▸). Since the Fourier transform of a product is a convolution of the Fourier transforms
where G K is a regular series of N δ functions, spaced by 1/p along the z axis, G H defines its repeat at a spatial position according to the helical arrangement of that subunit, and G DH is the sum of N individual G H functions, each centered around a δ function in G K along the meridian of the pattern (Fig. 4 ▸). If all subunits are uniformly deformed or not deformed at all, the subunit spacings are the same, p, and the complex integration along the z axis can be simplified by applying the conventional helical ‘selection rule’ usually used in describing helix diffraction.
Figure 4.
Generation of the discontinuous helix and its diffraction pattern. (a) A discontinuous helix (i.e. a helical array of subunits) can be thought of as a product of a helical wire, ρh, with a set of horizontal planes, ρk, spaced p apart, where p is the subunit axial translation. (b) The Fourier transform of the discontinuous helix, G DH, is represented as the convolution of the Fourier transforms of objects ρh and ρk, denoted G H and G K, respectively. Graphically, this convolution is represented as a series of overlapping G H patterns, each originating at the meridional reflection positions, separated by 1/p, described by G K (Vainshtein, 1966 ▸; Squire, 1981 ▸).
A discontinuous helix may be deformed in a piecewise manner along the filament, changing P(z) only at axial positions where bound molecules exert forces and deform the filament. Within one segment, P(z) is constant and the above approach is equally applicable. However, different segments of the piecewise deformed helix will reflect the change of pitch via the change in spacing, p, in each segment. Thus, the piecewise deformed helix can be represented as a series of  values at each segment
  =
=  −
−  and subunit spacing
  within the segment
  (Fig. 3 ▸
b). The number of spacings within
  is denoted as
  =
=  −
−  . Let us now consider that all subunits are at a constant radius r = r
0 in both the undeformed and the deformed configuration, and that at z = 0, ψ = ψ0 = 0. Setting the origin of z in the middle of the helix in the undeformed configuration, the coordinates of the first monomer are z
1 =
  , r = r
0 and ψ1 = ψ0 − (π
 /P
0), where P
0 is the helix pitch in the undeformed configuration.
The discrete axial coordinates for the first segment ( = 1) are
and for the other segments ( > 1) they are
where m is the index of the current subunit, the second term is the coordinate  of the end of the last monomer of the segment
  and the third term is the increase
  , from
  to the coordinate of the current monomer
  . This apparently complex description may actually be defined in a computational algorithm as a simple increment in z from the previous monomer to the current monomer coordinate. Following the definition of ψ(z) shown in equation (18), we define the angle of the last monomer in segment
  of a deformed helix as
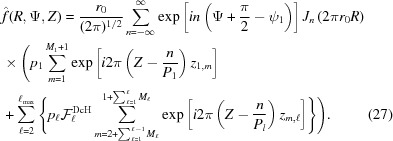
Summing over all subunits, instead of integrating over z as in equation (9), the Fourier transform of a nonuniformly deformed discontinuous helix is defined as
 |
Here, the expression
takes into account the continuity of the nonuniformly deformed helix and the superscript DcH denotes a factor that accounts for the piecewise strain changes in a discontinuous helix. The first sum in  accounts for the nonlinear change in ψ for the boundary monomers between segment
  and segment
  , and the second sum represents the coordinate of the boundary,
  .
.
3. Results and discussion
3.1. Effect of helix length on the magnitude and phase of the X-ray diffraction pattern
The predicted X-ray pattern of a three-dimensional object, in our case a helical wire, is also represented by a three-dimensional object in reciprocal space. In real space, a helical wire in cylindrical coordinates is defined as a linear relationship between the angle ψ and the axial position z at a constant radius r 0, but for nonuniformly deformed helices this relationship becomes nonlinear and depends inversely on the pitch distortion, P(z). The solution in reciprocal space is represented by a complex-valued function of the azimuthal angle Ψ in terms of the magnitude and phase in the R Z planes. In order to illustrate the predicted effects on observed diffraction patterns, all results shown below are in terms of diffracted intensity along with the predicted phases. The intensity is proportional to
i.e. the Fourier transform multiplied by its complex conjugate. In Appendix B we show that it is possible to derive an analytical expression for calculating the cylindrically averaged diffraction intensity that provides large savings in computation time. The intensities are not corrected for the Lorentz factor since this is sample and geometry dependent (Fraser & MacRae, 1973 ▸).
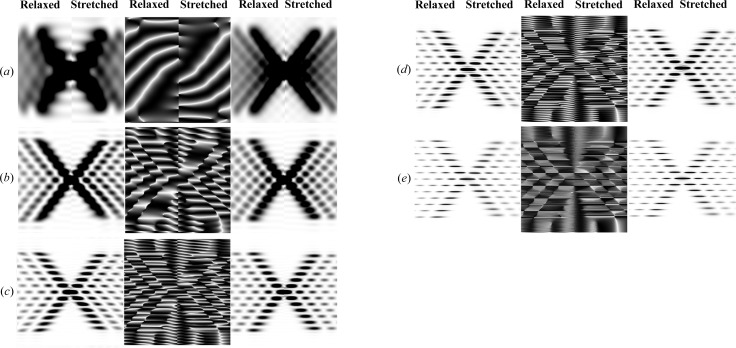
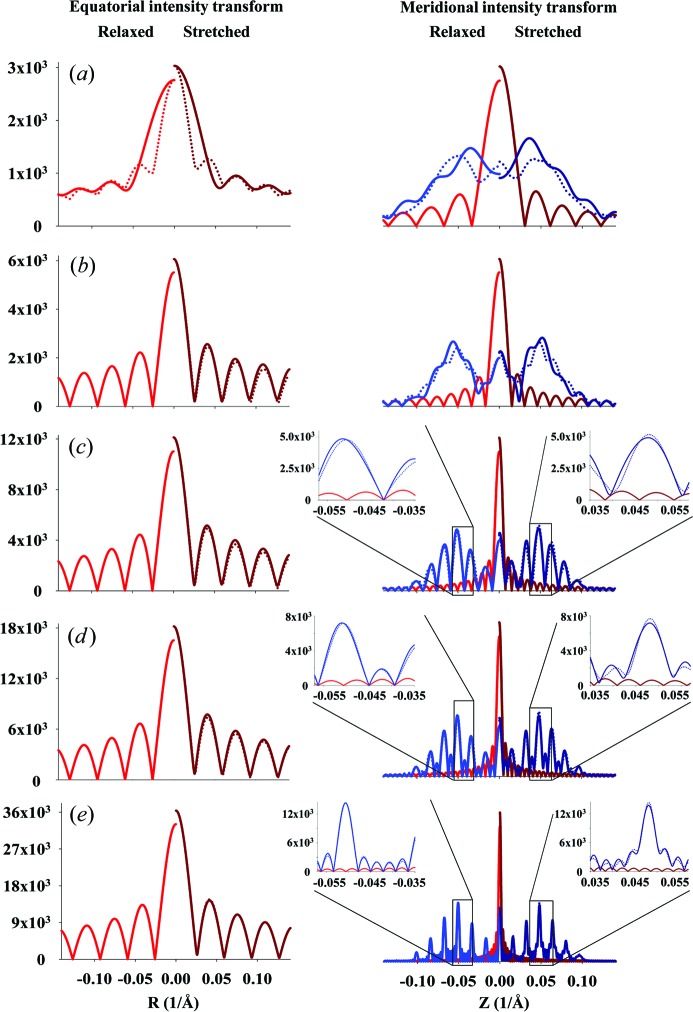
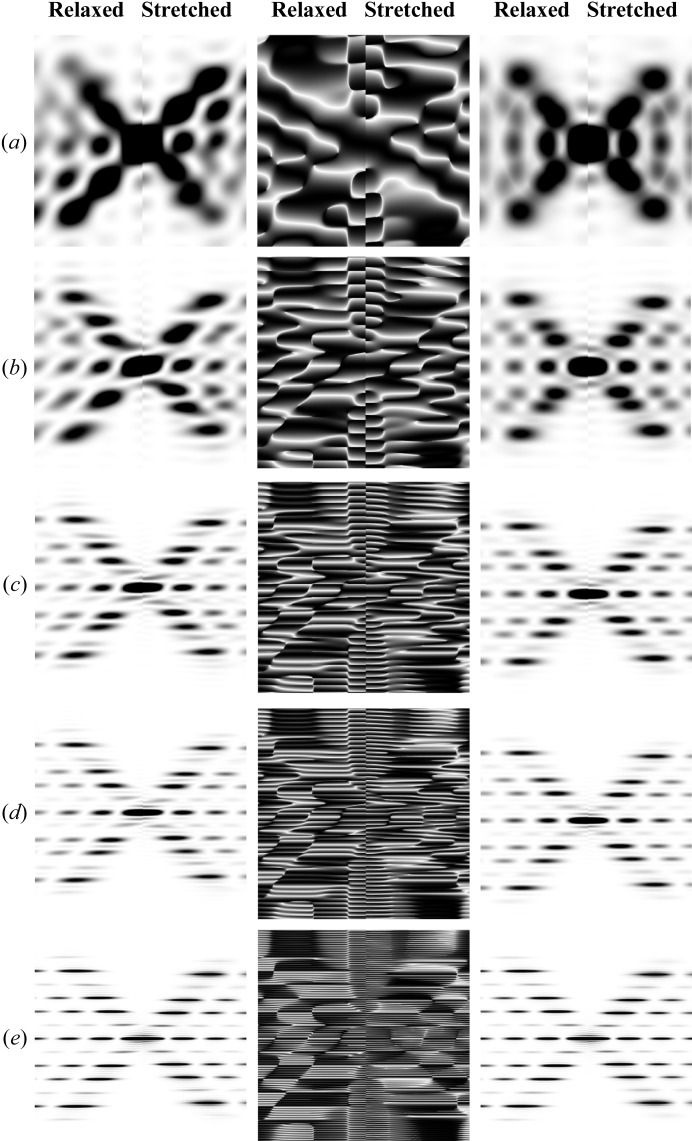
The predicted X-ray diffraction patterns from a helix of finite length are calculated from equation (9), where the value of the integral In(Z) is calculated using equation (11) for the case of constant pitch, P 0, or by numerical integration of equation (10) for the case of a linearly increasing strain along the length of the helical wire. Fig. 5 ▸ shows the effect of the helix length on the intensity and phase of the calculated Fourier transform. At short lengths, the diffracted intensity depends strongly on Ψ, but as the helix becomes longer the difference between the intensity at Ψ = 0 and the average value becomes smaller (Figs. 5 ▸ a–5 ▸ f). As expected, the widths of the layer lines in the axial direction become narrower and better defined with increasing helix length. However, with increasing length the intensity distribution and phase become more complex and show a finer structure between the layer lines. Stretching of the helices leads to systematic shifts in the peak positions, due to changes in the effective pitch of the helix, and attenuation of layer lines with increasing distance from the equator. The locations of the higher-order peaks are very well described on the phase graphs because the phase represents the repeats equally, regardless of the peak magnitude. These higher-order peaks become hard to see in Fig. 5 ▸ (left- and right-hand columns of images), but they can be reasonably well observed in intensity profiles taken parallel to the meridian (see Figs. 6 ▸ and 7 ▸). Nonuniform deformation changes the length of the pitch along the length of the helix and, therefore, the distance between the centers of the peaks. As a consequence, the intensities of the peaks are reduced and the widths of the peaks increased. Because the small differences in pitch become amplified in reciprocal space, the higher-order peaks, i.e. the peaks further away from the equator, decrease markedly in intensity and become increasingly broad in the meridional direction. The longer the helix, the more the profiles of Ψ = 0 and those averaged over all Ψ values become the same (insets in Fig. 7 ▸). This result suggests that the broader meridional reflections further away from the equator signify the degree of nonuniformity of the helix deformation (see insets in Fig. 7 ▸).
Figure 5.
The effect of length changes of helical wire structures on the calculated Fourier transforms of stretched and relaxed helices. Intensities at Ψ = 0 are shown in the left-hand panels, unless otherwise specified, while the phases at the specified Ψ are shown in the middle and the intensities averaged over all Ψ are on the right-hand side. In each panel, the left half is the relaxed pattern (undistorted helices) and the right half is the stretched pattern (distorted helices). The following helical parameters are used: six Bessel functions used to calculate the total transform on any given layer line, subunit distance 27.3 Å, length of one pitch 59.15 Å, radial position of a subunit (helix radius) 25 Å, 13 subunits in six turns. In all cases, the strain, Δ∊, increases linearly from 0 to 20% for different helix lengths: (a) a half pitch, Ψ = π/2; (b) one pitch; (c) two full pitches; (d) three full pitches; and (e) six full pitches. The change of strain, Δ∊, increases linearly from zero to a maximum strain of 20% over the length of the helical wire,  , thus causing the amount of stretch per pitch to decrease with increasing
  . Different pitches are chosen to best visually show the differences between the stretched and relaxed helices. Note that the higher-order layer lines show a larger distortion of the predicted X-ray reflections (including a reduction in intensity of the layer lines) and they are more prominent for longer helices. In the phase images, white indicates a phase of π radians and black a phase of −π radians.
Figure 6.
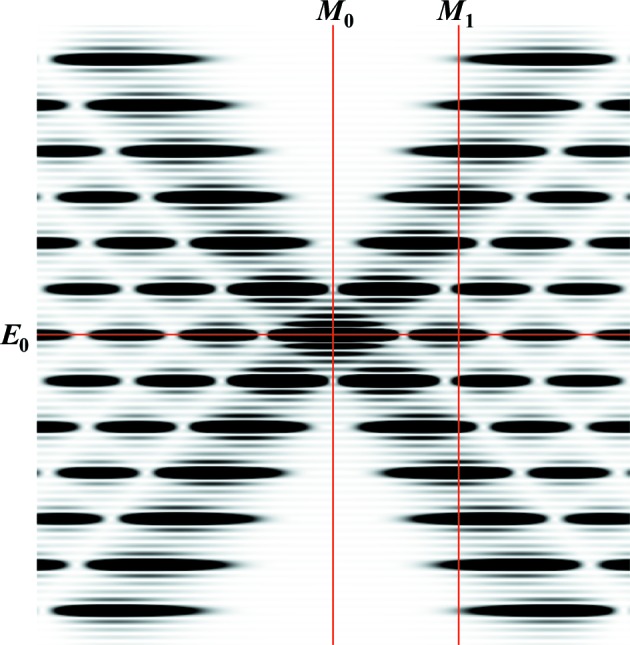
The positions of the meridional and equatorial planes on the image of the calculated intensity of a helical wire six full pitches long at Ψ = 0, from which the intensity profiles shown in Fig. 7 ▸ are extracted. The positions of the meridional planes M 0 and M 1 are at R = 0 and 0.0463 Å−1, respectively, and the equatorial plane is at Z = 0. The profiles from Fig. 5 ▸ are shown in Fig. 7 ▸.
Figure 7.
Comparison of equatorial and meridional profiles of predicted X-ray intensities, extracted from Figs. 5 ▸(a)–5 ▸(e), at Ψ = 0 (solid lines), unless otherwise specified, and intensities averaged over all Ψ (dotted lines). The profiles for relaxed meridional M 0 and M 1 and equatorial E 0 reflections (see Fig. 6 ▸) are shown as red and blue lines, respectively. The profiles of nonuniformly deformed helices are shown as dark-red and dark-blue lines, respectively. The lengths of helical wire and the degrees of stretch are the same as in Figs. 5 ▸(a)–5 ▸(e). At short helix lengths, the intensities in both the equatorial and meridional profiles differ significantly between those extracted from the X-ray pattern at a single Ψ value and those from the averaged magnitude over all Ψ. However, at longer lengths the profiles show only minor differences, observable only in the higher-order peaks (see insets). The insets show the higher-order meridional profiles centered on the third-order Bessel function peaks. At longer helix lengths, the difference in width and shape between the relaxed and nonuniformly deformed helices becomes more distinct.
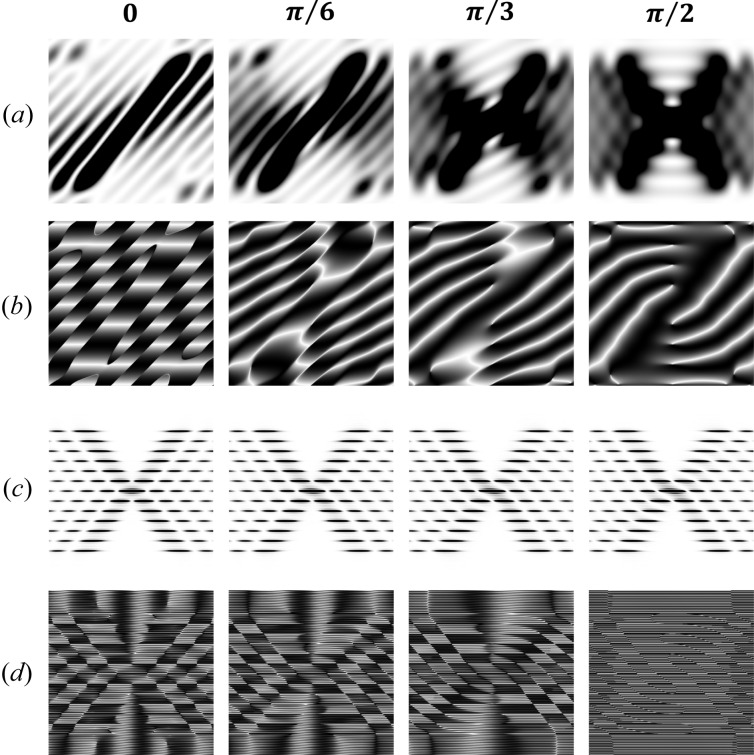
For a very short helix, for example one that is only half of the helix pitch, the peaks are fused and their intensity depends strongly on the azimuthal angle in reciprocal space, Ψ (see Fig. 8 ▸). The variation of the calculated magnitudes of the Fourier transforms in the R and Z planes with the angle Ψ decreases progressively with an increase in the number of pitches (shown as intensity in Fig. 8 ▸) and, therefore, the difference between the transform magnitude at a single Ψ and an image averaged over all Ψ values is also reduced (Figs. 5 ▸ and 7 ▸). Note that, for a half-pitch helix, at Ψ = 0 the magnitude of the X-ray reflections does not show the expected helix cross shape, but it does at Ψ = π/2. This large difference is caused by the length of the helix being <P, so that the reflections are highly asymmetric depending on Ψ. For helices with a finite number of pitches this dependence on Ψ is much smaller (Figs. 8 ▸ c and 8 ▸ d).
Figure 8.
The effect of Ψ on predicted intensity and phase for a short (0.5P) and a moderately long helical wire (6P). The images for Ψ in the range from 0 to π/2 are shown, i.e. for Ψ = 0, π/6, π/3 and π/2, and they illustrate the effect of Ψ at short and long helix lengths. From these images, diffraction from a full turn of the helix can be reconstructed using symmetry and antisymmetry conditions (see the movie presentation in the supporting information). The diffracted intensity and phase of undeformed (relaxed) continuous helices are shown for a short helix, L = 0.5P [parts (a) and (b)], and for a long helix, L = 6P [parts (c) and (d)], respectively. The differences in both intensity and phase are strongly evident for the short helix (0.5P) but minor for the major diffraction peaks from longer helices (e.g. 6P).
3.2. Continuous and discontinuous double helix of DNA
A double-helical wire with the periodicity and equivalent radius of double-stranded DNA also shows a strong dependence on length but much less dependence on Ψ (Fig. 9 ▸, for Ψ = 0 on the left, and averaged over all Ψ on the right). The intensity loss of the second and fifth layer lines, typical for the DNA double helix, becomes visible with a helix of two or more pitches in length. At shorter lengths of the helix this effect is masked by the large axial width of the layer lines. Also at short lengths, the dependence on Ψ is still strong but diminishes quickly with an increase in the number of completed pitches. The phase has a much more complex pattern, especially at shorter lengths (Figs. 9 ▸ a and 9 ▸ b, middle panels), when compared with the same images of a single helix shown in Fig. 5 ▸, reflecting the interference between the two helices. Stretching the helical wire by increasing the local strain linearly from one end of the helix to the other (right-hand side of each image) results in strong axial smearing of the peaks at higher-order layer lines, this effect being more prominent for longer helices.
Figure 9.
The effect of helix length on diffraction from double-helical wire structures with the periodicity and helix diameter of DNA. As in Fig. 5 ▸, diffracted intensities at Ψ = 0 are shown in the left-hand panel, the phases in the middle (also at Ψ = 0) and the intensities averaged over all Ψ in the right-hand panel. In each panel, the left half is the pattern from relaxed helices and the right half that from stretched helices. In all cases, the strain, Δ∊, increases linearly from 0 to 20% for different double-helix lengths: (a) a half pitch, (b) one pitch, (c) two full pitches, (d) three full pitches and (e) six full pitches. The decreasing amount of stretch per pitch with increasing length of the helical wire is chosen to show best the differences between stretched and relaxed helices. As shown in Fig. 5 ▸ for a single helix, the higher-order layer lines show a larger distortion of the X-ray diffraction patterns and they are more prominent for longer helices. The helix dimensions are as follows: helix length ∼204 Å, containing only 61 units with ten subunits per turn, subunit distance and length of one pitch 3.4 and 34 Å, respectively, radial position of a subunit (helix radius) 7 Å, equivalent subunit radius 1.6 Å. Six Bessel functions were used to calculate the intensity on any given layer line.
A discontinuous double helix of DNA, six pitches long (Fig. 10 ▸), has a similar pattern to that shown in Fig. 9 ▸(e). However, this pattern is more complex because it also shows the periodicities of the repeating subunits. With the nonuniformly stretched DNA helix, because of the linearly increasing inter-monomer spacing from one end to the other, a strong shift of the layer lines towards the center of the pattern and smearing of the layer-line peaks (Fig. 10 ▸ b) are observed. The higher-order layer lines (Fig. 10 ▸ c) show much larger shifts and distortion. This is clearly demonstrated in Fig. 10 ▸(d), where the profiles of the meridional peaks show the magnitude of the shift and the shape of the intensity profile. The higher the order of the meridional peak, the larger are the shift and the peak-shape distortion.
Figure 10.
Relaxed and deformed DNA discontinuous double helix. The inter-monomer spacing increases linearly (piecewise) from 0% strain at L = 0 to 9.8% at L = 174.93 Å. Relaxed versus stretched X-ray diffraction patterns are shown for (a) Ψ = 0 and (b) averaged over all values of Ψ. (c) Zoomed-out X-ray pattern from part (a), showing higher-order (second and third) meridional reflections. (d) Comparison of the meridional local profiles in the vicinity of the zeroth- to third-order reflections; black lines denote the relaxed helix and red lines the stretched.
3.3. Diffraction from deformed actin filaments under strain in contracting muscle
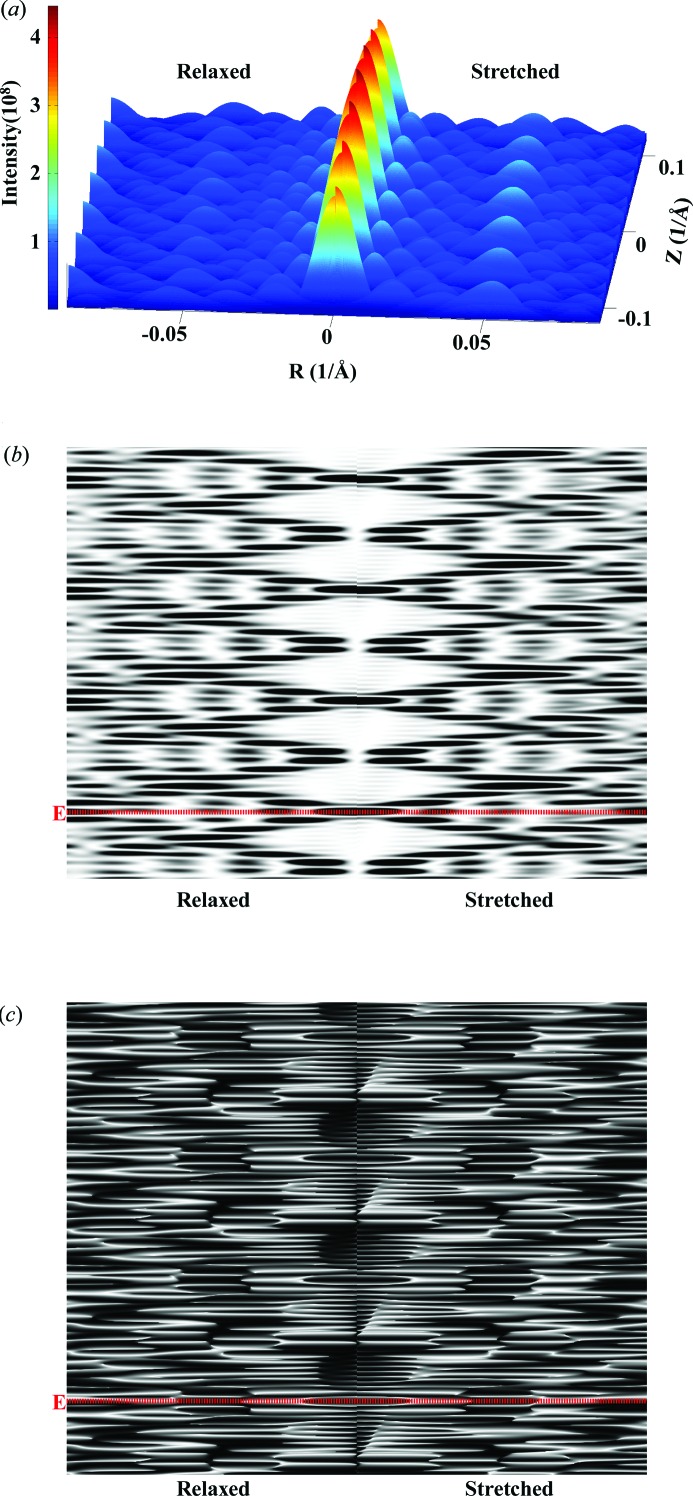
The nonuniform deformation of discontinuous helices is typically piecewise, reflecting the forces generated by other molecules attached to the helix. An example of where this is the case is an actin filament deformed by the forces generated by attached myosins (Fig. 2 ▸). In order to visualize the effects of these deformations easily, we show such a helix with relatively short length (Fig. 11 ▸) undergoing large, physically unrealistic, piecewise strains (see Fig. 3 ▸). The three-dimensional plot (Fig. 11 ▸ a) shows the intensity of the peaks and their spatial position and shape. Figs. 11 ▸(b) and 11 ▸(c) show the intensity and phase of the same X-ray pattern in grayscale. The three-dimensional plot best illustrates the differences in the peaks between the relaxed and stretched helices and the overall distribution of the pattern hills and valleys, whereas the two-dimensional images better show the shifts in the spacing of the layer lines between relaxed and stretched helices. The three-dimensional mesh shows absolute intensity, whereas the two-dimensional plot shows the intensity scaled in order to distinguish the meridional peaks better.
Figure 11.
X-ray patterns of a hypothetical deformed discontinuous actin helix with the exaggerated step increase in strain from Fig. 3 ▸ and the helix containing only 29 monomers. Comparisons between (left) a relaxed and (right) a nonuniformly stretched discontinuous helix. (a) A three-dimensional plot of intensities of averaged X-ray diffraction for all Ψ. Grayscale plots of (b) intensities and (c) phase at Ψ = 0. The helix dimensions are as follows: helix length ∼790 Å, containing only 29 units with 13 subunits in six turns, subunit distance and length of one pitch 27.3 and 59.15 Å, respectively, radial position of a subunit (helix radius) 25 Å, equivalent subunit radius 1.5540 Å. Twenty-nine Bessel functions were used to calculate the intensity on any given layer line. The red dotted line references the equatorial line.
The calculated intensities from a realistically deformed actin filament in a contracted muscle sarcomere show much smaller, but still significant, differences between the relaxed and contracted patterns (Figs. 12 ▸ a and 12 ▸ b). The actin meridional spacings (∼27 Å) of the nonuniformly deformed actin filament were calculated using the computational platform MUSICO (Smith et al., 2008 ▸; Smith & Mijailovich, 2008 ▸; Mijailovich et al., 2008 ▸, 2009 ▸) and displayed at position-bound myosins along the filament [for example as in Fig. 2 ▸(b)]. This multiscale Monte Carlo model of the sarcomere includes known structural and biochemical properties of the myofilaments (Smith et al., 2008 ▸; Smith & Mijailovich, 2008 ▸; Mijailovich et al., 2008 ▸, 2009 ▸; Donaldson et al., 1993 ▸; Prodanovic, Irving, McOwen & Mijailovich, 2014 ▸; Prodanovic, Irving, Stojanovic & Mijailovich, 2014 ▸; Prodanovic et al., 2015 ▸) and represents realistic deformations of an actin filament in bull frog sartorius muscle at fully developed isometric tension (Huxley et al., 1994 ▸). Because the actin filament is 364 monomers long, the widths of the meridional reflections and layer lines are narrow and multiple secondary intensity peaks are observed (Fig. 12 ▸ c). The differences in intensity between those from relaxed and stretched actin filaments are minor in the overall pattern (Fig. 12 ▸ a) and significant differences are visible only in enlarged views of specific parts of the pattern image, for example in the neighborhood of the first-, second- and third-order meridional actin reflections, as shown in Fig. 12 ▸(b). The differences can be seen more clearly in the intensity profiles shown in Fig. 12 ▸(c). All three peaks (first, second and third meridional reflections) are shifted towards the equator and the amount of the shift is similar to that observed by Huxley et al. (1994 ▸) and Wakabayashi et al. (1994 ▸). The amount of spacing shift is larger with the higher-order actin meridional reflections, as expected, but the peak shapes become increasingly distorted owing to the helix deformations.
Figure 12.
Predicted X-ray patterns for an actin filament about 1 µm long deformed by crossbridge forces in the sarcomere lattice (Fig. 2 ▸ a) and with piecewise changes in the intermonomer spacing (Fig. 2 ▸ c). The X-ray diffraction patterns are shown for a relaxed and a nonuniformly stretched discontinuous helix with an intermonomer spacing predicted from MUSICO simulations of fully contracted frog muscle [Figs. 2 ▸(b) and 2 ▸(c) show only a part containing 111 units, but the patterns are calculated for the whole actin filament containing 364 monomers, forming a discontinuous helix with 13 monomers in six turns]. (a) The top half of the pattern from the equatorial line (red dotted line) to the third order of actin meridional reflections. (b) Details of the peak shifts between a relaxed and a stretched helix for the first, second and third meridional reflections. (c) The shifts in the profiles. The actin filament length is ∼1 µm and the other helix dimensions are the same as in Fig. 11 ▸.
3.4. Future directions and applications of the theoretical approach
The theoretical model presented here represents the subunits of a discontinuous helix as points. We used this simplification in order to demonstrate the basic features of X-ray diffraction patterns of individual nonuniformly deformed helices. This approach was sufficient to show the main features of the newly developed theoretical model – the intent of the present study. However, for the interpretation of X-ray diffraction of real helical structures in living cells, there will be many deformed helices present and the X-ray diffraction pattern will represent the sum of X-ray reflections from many filaments or helical structures heterogeneously deformed. For a realistic interpretation of X-ray diffraction patterns, one also needs to consider the effects of X-ray beam size in the detector plane and of various types of disorder, and other effects of experimental geometry. There is a substantial body of literature describing these topics. Analytical expressions for dealing with various kinds of lattice disorder are given by Vainshtein (1966 ▸) and Millane and Stroud (Millane & Stroud, 1991 ▸, 1995 ▸, 1996 ▸; Stroud & Millane, 1995 ▸, 1996a ▸,b ▸). Furthermore, corrections for various aspects of experimental geometry have been described by Fraser and co-workers (Fraser & MacRae, 1973 ▸; Fraser et al., 1976 ▸), as well as by Chandrasekaran & Stubbs (2012 ▸).
 in our formalism represents a single nonuniformly distorted discontinuous helical structure. This could be, for example, a single molecule or an assembly of helically arranged subunits. With advances in computing power it is now possible to contemplate modeling a filamentous structure as the sum of multiple distorted helices, where one helical path passes through each constituent atom. Such an ‘all-atom model’ can take into account the different radii,
  , for each atom ia, and the change in orientation of the subunits in deformed helices. This approach can be used, for example, to study contracting muscle cells, by modeling myosin binding in an explicit three-dimensional sarcomere lattice, where the model simulations provide information concerning deformation or spacing changes in each actin or myosin filament induced by the cumulative effect of crossbridge forces along the filaments. This stochastic binding process will provide a large variation in monomer spacing along the filaments and between them. The calculated X-ray diffraction patterns represent the sum of the X-ray reflections from many filaments or helical structures heterogeneously deformed. These X-ray diffraction patterns, after inclusion of other experimental correction factors, should predict the observed X-ray patterns and match predictions measured simultaneously at two length scales, i.e. at the intermolecular level and for the whole cell. However, for this massive computational task, the calculation of X-ray patterns including the all-atom helical structure of each filament may not always be practical. Thus the use of an equivalent mass sphere (‘dummy atom’) per monomer at the equivalent helix radius can be a reasonable simplification (Squire & Knupp, 2005 ▸). Such coarse-grained approaches will be necessary in order to predict the diffraction from a dynamic and heterogeneous system such as contracting muscle during mechanical transients.
4. Conclusions
X-ray diffraction from helical molecular assemblies can be used, in principle, to measure the forces and deformation of filamentous assemblies in living cells. However, in order to extract this information tools are required to predict the diffraction from strained helical models that can be used as part of multiscale modeling efforts to understand interactions between helical assemblies in situ. Here, we have developed a theory to predict the diffraction from individual nonuniformly deformed helices in order to provide a first and essential step towards providing such a tool. By examining the phase and calculated diffracted intensities from the structure factors separately, we could demonstrate the effects of helix length on diffraction from uniformly and nonuniformly deformed helices and how the intensity may vary with azimuthal angle with short helices. We have shown how nonuniform deformation of the helices increases the axial widths and reduces the intensities of meridional reflections and layer lines, using as examples the cases of a single-helix system (actin) and the double helix of DNA. Finally, we have shown how this theory allows realistic calculation of the diffraction from a deformed actin helix in contracting muscle cells. Thus, this approach provides a theoretical basis for assessing not only the mean value of axial spacings in deformed helices but also the degree of nonuniformity of these spacings (strains) along helices deformed by interactions with their binding partners. However, the formalism presented here predicts the diffraction only from a single helical structure. Prediction of diffraction from real heterogeneous systems will require multiscale modeling approaches involving many such individual helical structures assembled into spatially explicit arrays. In the case of the muscle system, we expect that this approach will help in establishing a strong relationship between multiple scale measurements and multiscale predictions of mechano-chemistry in living cells.
Supplementary Material
Animated comparisons of constant and linearly extended continuous actin helices . DOI: 10.1107/S1600576716003757/fs5120sup1.mp4
Acknowledgments
This project was supported, in part, by grant No. 9P41GM103622 from the National Institute of General Medical Sciences (TI) and by grant No. R01AR048776 from the National Institute of Arthritis and Musculoskeletal and Skin Diseases (SMM). The content is solely the responsibility of the authors and does not necessarily reflect the official views of the National Institute of General Medical Sciences or the National Institutes of Health.
Appendix A. Approximate formulation of the deformed helix by linearly increasing the strain along the helix length
The exact solution [equation (14)] may not be intuitive, but using the Taylor-series expansion of the square root function we can obtain an approximate solution for ζ0 = 0 as
 |
and the approximate integral pitch function becomes
 |
Note that  ≠ P(z). An approximate value of P(z) calculated from equation (17) for ζ0 = 0 is
 |
Note that taking only the first two terms in each of ψ(z),  and P(z) is only valid for small strains. For large strains more terms should be included; for example, Δ∊ = 20% requires all five terms in equation (30) in order to obtain the change in the approximate ψ(z) from the undeformed value within 0.1% of the exact solution [equation (14)]. From equations (31) and (32) it is evident that both
  and
and  when
when  . For ζ0 ≠ 0, similar expressions can be derived, but the expressions of higher-order terms in equations (30)–(32) depend on z − ζ0 instead of on z, and the overall expressions are algebraically more complex.
Appendix B. Analytical expression for cylindrically averaged diffraction intensity
The Fourier transforms of helical structures are represented by three-dimensional objects in reciprocal space [from equations (9) and (10)]:
 |
Setting the origin of z in the middle of the helix in the undeformed configuration in the z direction requires inclusion of the angle ψ1 that defines the angle of the first monomer or end of the helix. Depending on the definition, in most cases for a continuous helix the angle of the first monomer is set as ψ1 = 0. By grouping together the terms independent of Ψ into Gn(R, Z) = [r 0/(2π)1/2]Jn(2πr 0 R)In(Z), equation (33) simplifies to
The Fourier transform  is a complex number and can be represented as magnitude and phase or by real and imaginary parts, where, in general, exp[in(Ψ +π/2 − ψ1)] and Gn(R, Z) are both complex numbers.
Since the observed X-ray diffraction patterns are recorded as the cylindrically averaged diffracted intensity, it is computationally beneficial to derive an analytical expression for equation (33) averaged over Ψ. Because the intensity is proportional to  =
=  , the Fourier transform [equation (34)] should be multiplied by its complex conjugate. After separating equation (34) into real and imaginary parts and multiplying by its complex conjugate, the intensity can be defined as
 |
where Ψ# = Ψ + π/2 − ψ1 is set for simplicity of notation. To calculate the cylindrically averaged diffraction intensity we need to integrate equation (35) over Ψ from 0 to 2π. Because the intensity is defined by squares of sums over all layer lines n of both real and imaginary parts of equation (35), the integral will consist of the sum of integrals of many combinations of the products [Re(Gn)]2cos2(nΨ#), [Re(Gn)]2sin2(nΨ#), [Im(Gn)]2cos2(nΨ#) and [Im(Gn)]2sin2(nΨ#) [from equation (35)], which will have finite values of definite integrals from 0 to 2π. The integrals of the mixed terms of layer lines n ≠ m, i.e. of the products cos(nΨ#)cos(mΨ#), sin(nΨ#)sin(mΨ#) and sin(nΨ#)cos(mΨ#) for combinations of the products Re(Gn)Re(Gm), Im(Gn)Im(Gm) and Re(Gn)Im(Gm), as well as for n = m of the integral of the product [Re(Gn)][Im(Gm)]sin(nΨ#)cos(nΨ#), are all equal to zero. The analytical expression for the cylindrically averaged diffraction intensity can then be easily derived for a finite number of layer lines as the sum of the products of the coefficients Gn(R, Z) and the nonzero values of the corresponding integrals over all layer lines. Thus, the cylindrical average after integration simplifies to
 |
References
- Barrea, R. A., Antipova, O., Gore, D., Heurich, R., Vukonich, M., Kujala, N. G., Irving, T. C. & Orgel, J. P. R. O. (2014). J. Synchrotron Rad. 21, 1200–1205. [DOI] [PMC free article] [PubMed]
- Chandrasekaran, R. & Stubbs, G. (2012). International Tables for Crystallography, Vol. F, Crystallography of Biological Macromolecules, edited by E. Arnold, D. M. Himmel & M. G. Rossmann, pp. 583–592. Heidelberg: Springer.
- Cochran, W., Crick, F. H. & Vand, V. (1952). Acta Cryst. 5, 581–586.
- Diaz, R., Rice, W. J. & Stokes, D. L. (2010). Methods Enzymol. 482, 131–165. [DOI] [PMC free article] [PubMed]
- Donaldson, K., Miller, B. G., Sara, E., Slight, J. & Brown, R. C. (1993). Int. J. Exp. Pathol. 74, 243–250. [PMC free article] [PubMed]
- Franklin, R. E. & Gosling, R. G. (1953). Nature, 171, 740–741. [DOI] [PubMed]
- Fraser, R. D. B., Macrae, T. P., Miller, A. & Rowlands, R. J. (1976). J. Appl. Cryst. 9, 81–94.
- Fraser, R. D. B. & MacRae, T. P. (1973). Conformation in Fibrous Proteins and Related Synthetic Polypeptides. New York: Academic Press.
- Huxley, H. E., Stewart, A., Sosa, H. & Irving, T. (1994). Biophys. J. 67, 2411–2421. [DOI] [PMC free article] [PubMed]
- Klug, A., Crick, F. H. C. & Wyckoff, H. W. (1958). Acta Cryst. 11, 199–213.
- Lebedev, N. N. (1972). Special Functions and their Applications. New York: Dover Publications.
- Mahendrasingam, A., Forsyth, V. T., Hussain, R., Greenall, R. J., Pigram, W. J. & Fuller, W. (1986). Science, 233, 195–197. [DOI] [PubMed]
- Mijailovich, S. M., Kayser-Herald, O., Moss, R. L. & Geeves, M. A. (2008). Biophys. J. 98, 404a.
- Mijailovich, S. M., Kayser-Herald, O., Moss, R. L. & Geeves, M. A. (2009). Biophys. J. 96, 201a.
- Millane, R. P. & Stroud, W. J. (1991). Int. J. Biol. Macromol. 13, 202–208. [DOI] [PubMed]
- Millane, R. P. & Stroud, W. J. (1995). Acta Cryst. A51, 360–365.
- Millane, R. P. & Stroud, W. J. (1996). Fiber Diffr. Rev. 5, 16–20.
- Oda, T., Iwasa, M., Aihara, T., Maéda, Y. & Narita, A. (2009). Nature, 457, 441–445. [DOI] [PubMed]
- Orgel, J. P. & Irving, T. C. (2014). Encyclopedia of Analytical Chemistry, pp. 1–26. New York: John Wiley and Sons.
- Oshima, K., Sugimoto, Y., Irving, T. C. & Wakabayashi, K. (2012). PLoS One, 7, e52421. [DOI] [PMC free article] [PubMed]
- Poole, K. J., Lorenz, M., Evans, G., Rosenbaum, G., Pirani, A., Craig, R., Tobacman, L. S., Lehman, W. & Holmes, K. C. (2006). J. Struct. Biol. 155, 273–284. [DOI] [PubMed]
- Prodanovic, M., Irving, T. C., McOwen, R. & Mijailovich, S. M. (2014). Biophys. J. 106, 768a.
- Prodanovic, M., Irving, T. C., Stojanovic, B. & Mijailovich, S. M. (2014). In Proceedings. 2014 40th Annual Northeast Bioengineering Conference (NEBEC), 25–27 April 2014, Northeastern University, Boston, MA, USA. 10.1109/NEBEC.2014.6972910. Piscataway IEEE.
- Prodanovic, M., Nedic, D., Irving, T. C. & Mijailovich, S. M. (2015). Biophys. J. 108, 422a–423a.
- Samatey, F. A., Imada, K., Nagashima, S., Vonderviszt, F., Kumasaka, T., Yamamoto, M. & Namba, K. (2001). Nature, 410, 331–337. [DOI] [PubMed]
- Smith, D. A., Geeves, M. A., Sleep, J. & Mijailovich, S. M. (2008). Ann. Biomed. Eng. 36, 1624–1640. [DOI] [PubMed]
- Smith, D. A. & Mijailovich, S. M. (2008). Ann. Biomed. Eng. 36, 1353–1371. [DOI] [PubMed]
- Squire, J. M. (1981). The Structural Basis of Muscular Contraction, pp. 39–81. New York: Plenum.
- Squire, J. M. & Knupp, C. (2005). Adv. Protein Chem. 71, 195–255. [DOI] [PubMed]
- Stroud, W. J. & Millane, R. P. (1995). Acta Cryst. A51, 790–800.
- Stroud, W. J. & Millane, R. P. (1996a). Acta Cryst. A52, 812–829.
- Stroud, W. J. & Millane, R. P. (1996b). Proc. R. Soc. London Ser. A, 452, 151–173.
- Stubbs, G. (1999). Curr. Opin. Struct. Biol. 9, 615–619. [DOI] [PubMed]
- Takezawa, Y., Satoi, N., Oshima, K., Kobayashi, T. & Wakabayashi, K. (2005). Photon Factory Activity Report 2004 Vol. 22, Part B, User’s Report, p 246. Photon Factory, KEK, Tsukuba, Japan.
- Vainshtein, B. K. (1966). Diffraction of X-rays by Chain Molecules. New York: Elsevier.
- Wakabayashi, K., Sugimoto, Y., Tanaka, H., Ueno, Y., Takezawa, Y. & Amemiya, Y. (1994). Biophys. J. 67, 2422–2435. [DOI] [PMC free article] [PubMed]
Associated Data
This section collects any data citations, data availability statements, or supplementary materials included in this article.
Supplementary Materials
Animated comparisons of constant and linearly extended continuous actin helices . DOI: 10.1107/S1600576716003757/fs5120sup1.mp4


