

Abstract
Oncologic PET images provide valuable information that can enable enhanced prognosis of disease. Nonetheless, such information is simplified significantly in routine clinical assessment to meet workflow constraints. Examples of typical FDG PET metrics include: (i) SUVmax, (2) total lesion glycolysis (TLG), and (3) metabolic tumor volume (MTV). We have derived and implemented a novel metric for tumor quantification, inspired in essence by a model of generalized equivalent uniform dose (gEUD) as used in radiation therapy. The proposed metric, denoted generalized effective total uptake (gETU), is attractive as it encompasses the abovementioned commonly invoked metrics, and generalizes them, for both homogeneous and heterogeneous tumors, using a single parameter a. We evaluated this new metric for improved overall survival (OS) prediction on two different baseline FDG PET/CT datasets: (a) 113 patients with squamous cell cancer of the oropharynx, and (b) 72 patients with locally advanced pancreatic adenocarcinoma. Kaplan-Meier survival analysis was performed, where the subjects were subdivided into two groups using the median threshold, from which the hazard ratios (HR) were computed in Cox proportional hazards regression. For the oropharyngeal cancer dataset, MTV, TLG, SUVmax, SUVmean and SUVpeak produced HR values of 1.86, 3.02, 1.34, 1.36 and 1.62, while the proposed gETU metric for a=0.25 (greater emphasis on volume information) enabled significantly enhanced OS prediction with HR=3.94. For the pancreatic cancer dataset, MTV, TLG, SUVmax, SUVmean and SUVpeak resulted in HR values of 1.05, 1.25, 1.42, 1.45 and 1.52, while gETU at a=3.2 (greater emphasis on SUV information) arrived at an improved HR value of 1.61. Overall, the proposed methodology allows placement of differing degrees of emphasis on tumor volume vs. uptake for different types of tumors to enable enhanced clinical outcome prediction.
1. Introduction
The incidence of cancer globally has increased from 12.7M to 14.1M new cases annually just from 2008 to 2012, and is predicted by the World Health Organization (WHO) to increase by 70% over the next 20 years. The ability to predict sensitivity of a given tumor to specific therapeutic agents is the ‘holy grail’ in personalized cancer medicine (Baldock et al., 2013; Tian et al., 2012). This can only be achieved if imaging biomarkers of enhanced therapy response assessment, prognostic, and predictive value can be developed, thus allowing imaging to move beyond diagnostic tasks and to the domain of cancer outcome prediction given different treatment options (Mankoff et al., 2000; Paidpally et al., 2012; Cook et al., 2014; Mankoff et al., 2014).
PET imaging provides the reference standard for tumor assessment in a wide range of cancer types. As a result, a cancer patient is very likely to undergo PET scanning prior to and after treatment (Gambhir et al., 2001; Kelloff et al., 2005; Mankoff et al., 2007; Wahl, 2008). PET images provide a wide array of information portraying state-of-disease. However, because of this added complexity, such information is commonly simplified and distilled down significantly to produce routine clinical reports. Examples of such simplified metrics for FDG PET include: (i) SUVmax, (2) total lesion glycolysis (TLG), and (3) metabolic tumor volume (MTV) (Basu et al., 2007; Tylski et al., 2010; van Heijl et al., 2010; Hatt et al., 2012; Maisonobe et al., 2013). Each of these metrics emphasizes different image features and is thus potentially suboptimal. SUVmax neglects information from all voxels except the one with the highest intensity while neglecting tumor volume (or burden). By contrast, MTV neglects SUV values (or avidity). TLG is equivalent to the product of MTV and mean SUV uptake, placing equal emphasis on both.
For homogeneous tumors, it is plausible to consider unequal emphasis on tumor burden vs. avidity. This can be thought of as combining the MTV and SUV based metrics (multi-metric analysis), which has seen limited activity in the field (Tylski et al., 2008). Moreover, intra-tumor heterogeneity (Michor and Polyak, 2010) is a topic of increasing interest, and there is emerging literature on the use of sophisticated metrics to quantify aggressiveness of heterogeneous tumors (Eary et al., 2008; El Naqa et al., 2009; van Velden et al., 2011; Tixier et al., 2011; Asselin et al., 2012; Vriens et al., 2012; Lambin et al., 2012; Kumar et al., 2012; Chicklore et al., 2013; Tixier et al., 2014; Hatt et al., 2015). It remains to be seen whether these methods will translate to routine clinical practice. One concern with some of these metrics is the added complexity and potentially numerous additional degrees of freedom. For instance, the popular co-occurrence matrix (Haralick et al., 1973) involves estimation of the second-order joint conditional probability density function between two voxels that are separated along a certain direction by a certain distance, and involves discretization of the gray levels. Using this co-occurrence matrix, a range of so-called Haralick texture measures are then computed (Conners et al., 1984; Tixier et al., 2011; Rahmim et al., 2012). The added degrees of freedom could then potentially manifest themselves as problems of over-fitting given image noise, which may affect predictive performance.
In the present work, we have developed a novel metric, denoted generalized effective total uptake (gETU), for tumor assessment, inspired by a model of generalized equivalent uniform dose (gEUD) as used in radiation therapy. What is particularly attractive about the proposed metric is that: (1) it is intuitive in its derivation and interpretation, (2) it encompasses the abovementioned metrics of common usage in the clinic, and (3) it generalizes them, in the case of both homogeneous and heterogeneous tumors, using only a single parameter a.
In what follows, the gETU metric is formulated in section 2. Application of the proposed metric to patient data involving oropharyngeal as well as pancreatic cancer is shown in section 3. This is followed by discussions and conclusion in sections 4 and 5, respectively.
2. Novel metric
For a tumor with N sub-volumes of intensity (in this case PET uptake) ui and volume Vi (i=1…N), the proposed metric, denoted generalized effective total uptake (gETU), is given by:
| (1) |
where a is the only free parameter. For derivation, shown in appendix A, we use an analogy to the Lyman-Kutcher-Burman (LKB) model as utilized in normal tissue complication probability (NTCP) models in radiation therapy (Kutcher and Burman, 1989; Mohan et al., 1992; Niemierko, 1997, 1999; Li et al., 2012). In this case, rather than being concerned about the dose deposition on an organ at risk, we instead focus on the risk implied by the distribution of the degree of uptake in a tumor for a particular emission computed tomography (ECT) tracer, in this case PET.
For better intuition, we then consider individual voxels of equal volume Δv, where the tumor of interest encompasses n voxels, thus having a total volume V = nΔv. We represent the set of voxel uptakes as an n-dimensional vector u⃗ = {u1, … , un}, and define the generalized mean of u⃗ as:
| (2) |
We see then that our proposed metric (1) is given by:
| (3) |
We can ascribe physical interpretations to the meaning of the parameter a given properties of the generalized mean (2):
gETU∞ = M∞ = max(u⃗) provides SUVmax.
For a < 0, the relations are unphysical. This can be seen by noting that gETU would be inversely proportional to tumor volume in Eq. (3) (though this would make sense when describing something like the probability of tumor control with treatment, which drops for larger tumors).
M1 represents the arithmetic mean as commonly used in the context of SUV quantification: M1 is SUVmean and gETU1 = M1V is the total lesion glycolysis (TLG) for FDG.
For a < 1, the risk due to the tumor volume is somewhat dominant.
For a > 1, the risk due to uptake is somewhat dominant.
For a ≫ 1, voxels with greatest uptake become solely responsible for risk, and microscopic heterogeneity is the dominant risk factor.
For 0 < a ≪ 1, the second term in right-hand side of Eq. (3) dominates the first term for inter-tumor comparisons, i.e. tumor volume is solely responsible for risk, and tracer uptake values do not correlate well with measuring the particular clinical endpoint. Seen another way, as a → 0 (see Sec. 2.1 for more on this).
Overall, what is powerful about the proposed metric is that it enables unequal emphasis on different uptake values. As can be seen, as a → 0, reduced emphasis is put on actual uptake values, and the metric becomes increasingly related to the metabolic tumor volume (MTV) only, whereas SUVmean and TLG are related to a = 1 and SUVmax is obtained for a → ∞. The proposed formulation therefore naturally enables a flexible, generalized, yet simple metric in which the PET voxels are weighted as a function of their respective intensities. This formulation is thus especially suitable for analysis of heterogeneous tumors, and even in the case of homogeneous tumors, it can be very useful, as it effectively performs dual SUV-MTV analysis enabling unequal emphasis on the respective contributions (unlike TLG which equally emphasizes both).
2.1. Numeric implementation
For numerical stability, we modified the gETU metric (3). Note that the first term in gETUa, i.e. Ma, approaches a finite number as a → 0 (M0 turns out to be the geometric mean), while V1/a becomes completely dominant, and in fact numerically unstable, since it approaches infinity as a → 0. Therefore, for a < 1 we instead utilized (gETUa)a which approaches V as a → 0. This is purely to enable numerical stability, and does not impact subject stratification. Therefore, we used the definition:
| (4) |
As for the top term in (4), since the inner summation also becomes unstable as a → ∞, we found that it is more conveniently computed as:
| (5) |
3. Patient data analysis
3.1. Subjects
We performed two sets of studies involving FDG PET/CT imaging performed at baseline:
One set consisted of n=113 patients with T2, T3 and T4 (Edge and Compton, 2010) oropharyngeal squamous cell carcinoma (OSCC) (85 males and 28 females; mean-age: 58.8+/-10.3). Treatments included surgery, chemotherapy, radiation therapy or a combination of these therapies.
Another set consisted of n=72 patients with locally advanced pancreatic adenocarcinoma (LAPC) (47 males and 25 females; mean-age: 66.5+/-10.1). Staging groups only included IIB and III, and treatment was chemo±radiation therapy.
In both datasets, we utilized overall survival (OS) as the patient related outcome of interest for imaging biomarker derivation. The studies were acquired on the Discovery ST (Bettinardi et al., 2004) or Discovery RX (Kemp et al., 2006) scanners at the Johns Hopkins Hospital, with typical acquisitions spanning 5min/bed, and with respective scanner point-source resolutions of 6.3mm and 5.1mm at 1cm, and 7.1mm and 5.9mm at 10cm radially from the center of the field-of-view. The studies were performed under a waiver of informed consent as approved by the Institutional Review Board. The guidelines of the Health Insurance Portability and Accountability Act (HIPAA) were followed.
3.2. Data analysis
Primary tumors were segmented from FDG PET images using 40% and 50% SUVmax thresholding, all in 3D (MIM Software Inc.; version 6.2), and without any further interpolations and/or smoothing by the software on the image sets. Examples are depicted in Fig. 1 for the two cancer types. SUVmax threshold contouring relies on including all voxels that are greater than a defined percentage (in this study 40% and 50%) of the maximum voxel within an operator-defined sphere. From the segmented images, histograms were generated in increments of 0.1 SUV units. The proposed gETU metric was generated for a wide range of exponents a (10-3 to 104 in logarithmic increments of 0.1).
Figure 1.
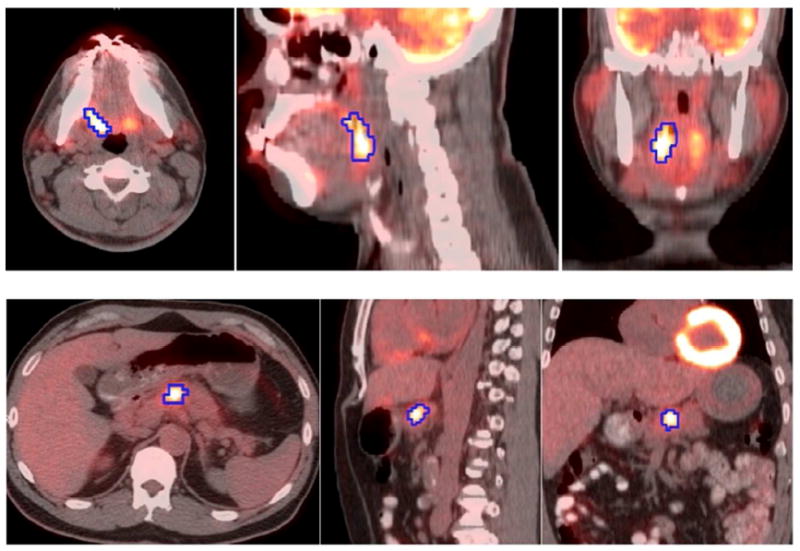
Images of patients with (top) squamous cell cancer of the oropharynx, and (bottom) non-resectable locoregional pancreatic cancer, showing the fused PET/CT image, including transaxial, sagittal and coronal slices from left to right. A 3D PET-based segmentation (50% thresholding) is shown on the images.
In addition to gETU, five metrics were considered for comparison, namely MTV, TLG, SUVmax, SUVmean and SUVpeak. The latter is obtained by moving a 1-cm3 spherical region of interest over the tumor (not necessarily conforming to the precise tumor outline) to maximize the enclosed average uptake (Wahl et al., 2009; Lodge et al., 2012). Kaplan-Meier survival analysis was performed where the subjects for a given metric (MTV, TLG, SUVmax, SUVmean, SUVpeak, gETU) were subdivided into two groups using the median threshold. Following this, for any parameter a, the hazard ratios (HR) between the higher percentile to the lower percentile groups were computed using Cox proportional hazards regression. In what follows, we discuss the results for the two cancer datasets separately.
3.2.1. Squamous cell cancer of the oropharynx (n=113)
Aside from PET-based analysis, predictive factors considered were T-staging, treatment type, age and sex. Univariate analysis (Cox proportional hazards regression) revealed significance for T-staging (p=0.0017) and treatment (p=0.045), but not for age or sex. Univariate analysis also showed significance for different PET-based metrics (reported below), and as such, the rest of the analysis included multivariate analysis incorporating T-staging, treatment and each PET-based metric of interest.
Plots of HR as a function of a are depicted in Fig. 2 for the two segmentations. Cox regression goodness of fit log-likelihood (LOGL) curves are also shown. The optimized performance occurs for 50% contouring and with a=0.25.
Figure 2.
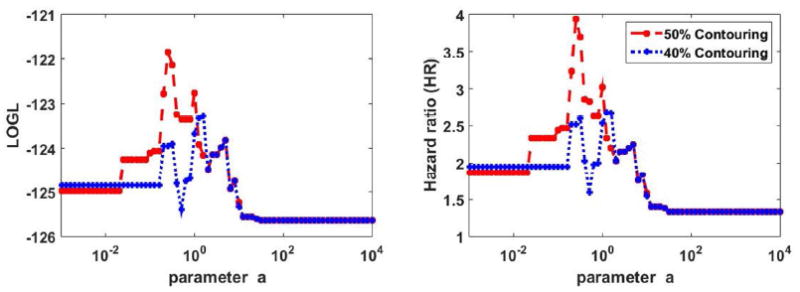
Plots of (left) LOGL and (right) HR in OS analysis of oropharyngeal cancer dataset for different values of parameter a. 40% and 50% thresholding segmentations are shown. Multivariate analysis was utilized, including staging and treatment, in addition to the PET-based markers.
The actual survival curves are shown in Fig. 3 for the case of 50% contouring: this includes (top row) MTV, TLG and SUVmax, that correspond to a≪1, a=1 and a≫1 respectively; and (bottom row) SUVmean, SUVpeak and the proposed gETU metric. As seen in the figure, enhanced separation between the survival curves is obtained for a=0.25 in gETU, resulting in an HR value of 3.94, compared to values of 1.86, 3.02, 1.34, 1.36 and 1.62 for MTV, TLG, SUVmax, SUVmean and SUVpeak respectively.
Figure 3.
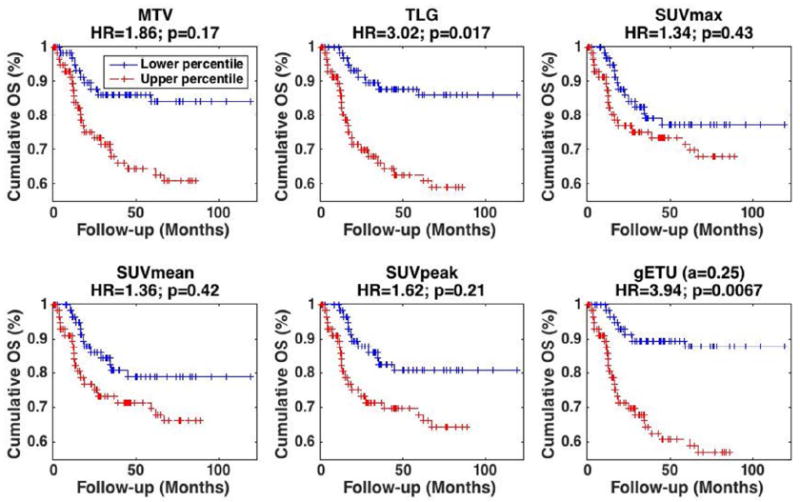
Kaplan-Meier curves for OS in oropharyngeal cancer dataset where patients were separated based on the median. Results are shown for different metrics: (top) (left) MTV, (center) TLG, (right) SUVmax, (bottom) (left) SUVmean, (center) SUVpeak and (right) proposed gETU. (+) signs indicate events at steps (i.e. death) or last follow-up otherwise. 50% SUVmax segmentation was utilized. HR and p-values are also reported. Multivariate analysis was utilized, including staging and treatment, in addition to the PET-based markers.
The p-values for curve separation (i.e. ability to reject the null hypothesis that HR=1) in univariate analysis of PET markers MTV, TLG, SUVmax, SUVmean, SUVpeak and gETU, were 0.0049, 0.00068, 0.19, 0.13, 0.046, and 0.00027, respectively. However, after inclusion of staging and treatment covariates (i.e. above-mentioned multivariate analysis), the values, as shown in Fig. 3, were 0.17, 0.017, 0.43, 0.42, 0.21 and 0.0067, respectively, thus indicating that TLG and gETU were independent factors for outcome prediction.
For statistical comparison, Fig. 4 plots the LOGL values of the Cox proportional hazard regression for the above-mentioned six metrics. It is seen that LOGL for the proposed gETU metric exceeds other conventional metrics. The LOGL differences can be translated into confidence intervals for statistical comparison of different metrics, while accounting for the fact that gETU includes an additional degree-of-freedom (df); i.e. the free a parameters. This can be done using Wilks’ theorem (Wilks, 1938) by which 2(LOGL(metric1)-LOGL(metric2)) is approximately a chi-squared distribution with df=df(metric1)-df(metric2). For the Cox model, the corresponding goodness of fit LOGL values, as shown in the figure, indicated that MTV/SUVmax/SUVmean/SUVpeak (TLG) were outside the 99% (80%) confidence interval of gETU.
Figure 4.
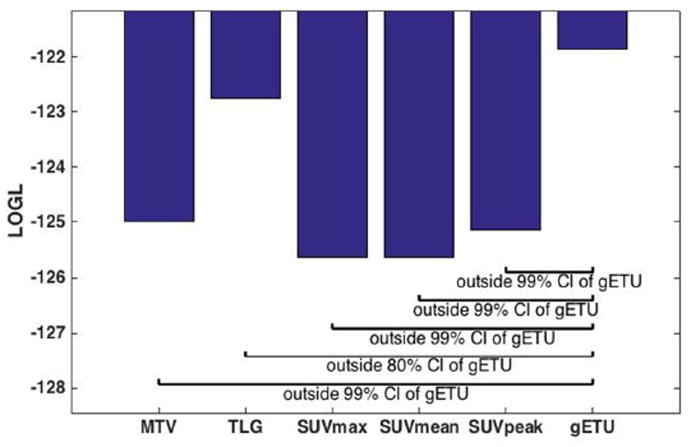
Bar plots of log-likelihood (LOGL) for the various metrics, and statistical comparison of the proposed gETU metric with respect to the four more conventional metrics.
3.2.2. Locally advanced pancreatic adenocarcinoma (n=72)
Unlike the previous dataset, univariate analysis (Cox proportional hazards regression) did not reveal significance for any of age, sex, treatment or staging (the latter is especially explained by its narrow range within the dataset, namely IIB and III only). As such, for the rest of this analysis, only univariate analysis of PET-based metrics was invoked.
Plots of HR as a function of a are depicted in Fig. 5 for the two segmentations. Goodness of fit LOGL curves are also shown. It is seen in the analysis of this dataset that optimized performance occurs for 50% contouring and a=3.2.
Figure 5.
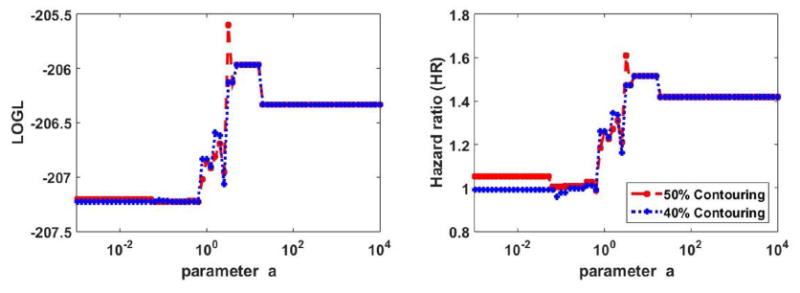
Plots of (left) LOGL and (right) HR in OS analysis of pancreatic cancer dataset for different values of parameter a. 40% and 50% thresholding segmentations are shown.
The survival curves are shown in Fig. 6 for the case of 50% thresholding, as was shown in Fig. 3 for the oropharyngeal dataset. It is seen that enhanced separation between the survival curves is obtained for a=3.2, resulting in an HR value of 1.61, compared to values of 1.05, 1.25, 1.42, 1.45 and 1.52 for MTV, TLG, SUVmax, SUVmean and SUVpeak respectively. We also observed improvement in p-values for curve separation (i.e. ability to reject the null hypothesis that HR=1) from 0.85, 0.39, 0.18, 0.16 and 0.11 for MTV, TLG, SUVmax, SUVmean and SUVpeak to 0.072 for gETU. At the same time, unlike the previous dataset, the observed improvements did not reach the level of statistical significance. This is consistent with the fact that prediction of outcome for pancreatic cancer is extremely challenging, resulting in relatively low HR values and limited statistical significance (Chirindel et al., 2015), though it is seen that the statistical significance levels are improved by the proposed method.
Figure 6.
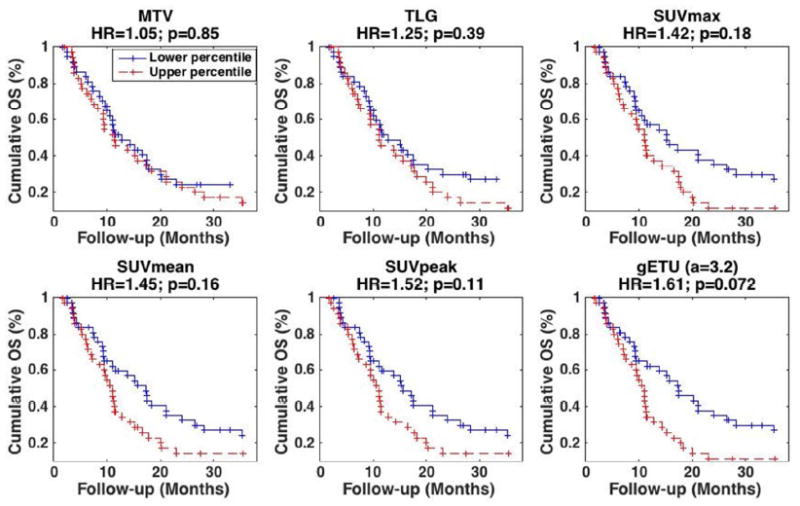
Kaplan-Meier curves for OS in pancreatic cancer dataset where patients were separated based on the median. Results are shown for different metrics: (top) (left) MTV, (center) TLG, (right) SUVmax, (bottom) (left) SUVmean, (center) SUVpeak and (right) proposed gETU. (+) signs indicate events at steps (i.e. death) or last follow-up otherwise. 50% SUVmax segmentation was utilized. HR and p-values are also reported.
4. Discussion
4.1. PET uptake vs. volume, and comparison with other metrics
Existing metrics such as SUVmax and MTV, as applied in clinical PET imaging, significantly reduce the available information in PET images. In the present work, we have proposed a novel metric aimed at enhanced utilization of the rich informational content of PET images, which at the same time, generalizes these common metrics using a single parameter. It may be stated that TLG already combines SUV uptake and MTV, which is certainly true. However, TLG places equal emphasis on uptake and volume, and though we found in one dataset (oropharyngeal cancer) that this results in enhanced outcome prediction compared to both MTV and SUVmax/peak, there is no strong argument for such a constraint in general. In fact, TLG is commonly seen not to outperform both MTV and SUV-based metrics. This is for instance what we observed in our pancreatic cancer dataset. As other examples, in a study by Hatt et al. (2012), involving both prediction of therapy response and overall survival prognostication in esophageal cancer, TLG clearly outperformed SUV-based metrics, but its performance was on par with MTV. In a study of early treatment response assessment in metastatic colorectal cancer patient by Maisonobe et al. (2013), TLG was superior to MTV, but was relatively outperformed by SUV-based metrics.
Our proposed gETU metric enables different relative emphases on PET uptake vs. volume, utilizing a single parameter (exponent) a, that has an intuitive interpretation. For homogeneous tumors, gETU enables different emphases on PET uptake vs. total volume. The metric gETU is also especially relevant for quantification of tumor heterogeneity, which is not achieved by MTV, TLG or SUVmean, and is overly simplified via SUVmax.
The gETU metric can also be compared and contrasted with SUVpeak: for large a values, gETU emphasizes the hottest several voxels as does SUVpeak (and not merely the single hottest voxel as does SUVmax). However, gETU is different than SUVpeak, since SUVpeak emphasizes contiguity between the voxels in its very definition (Wahl et al., 2009; Lodge et al., 2012). In any case, there is no definitive reason to emphasize contiguity (or necessarily a spherical definition of contiguity as is presently for SUVpeak; and this is an area that needs to be further investigated). In a sense, gETU is more generalized compared to SUVpeak as it does not impose contiguity. It was observed in both datasets studied in the present work that gETU outperformed SUVpeak for outcome prediction.
We also note that the proposed metric remains to be compared to dual/multi-metric analysis (as in a nomogram). As already noted, for homogenous tumors, the metric is effectively equivalent to dual SUV-MTV analysis. Nonetheless, dual/multi-metric analysis combining conventional metrics does not enable placement of unequal emphasis on different voxels within a heterogeneous distribution, whereas the proposed gETU metric is able to do that. In any case, thorough comparisons remain to be performed.
Our future work also includes comparison of the proposed framework with sophisticated approaches such as texture analysis and machine learning, which we actively pursue. As discussed in the introduction, given the multiple degrees of freedom in such methods, the problems associated with over-fitting and the curse of dimensionality have to be properly addressed, and there is increasing scrutiny in this area (Chalkidou et al., 2015), and increasing efforts towards proper statistical analysis (Kumar et al., 2012). Meanwhile, it is also very plausible to include the gETU metric itself (with varying a values) within the radiomics framework, along with the many other features that are presently considered, to look for prognostic radiomic signatures (Aerts et al., 2014).
In our present work, formulating the new gETU metric, we utilized a derivation set for initial optimization and evaluation. To conclusively establish the superiority of the proposed metric with initially-derived specific parameter values, a distinct validation set is also required. As such, the metric needs to be carefully assessed and systematically evaluated for specific cancer types as well as prediction or prognostication tasks. Furthermore, we note that datasets (derivation or validation) from a single center may not be robust enough to include all the variations within a single tumor type. Hence, eventually, a multi center study is the ideal and most powerful approach, especially for validation.
4.2. Dependence of parameter ‘a’ on cancer type
The ‘a’ parameter in gETU depends on study or tumor type. This is because outcomes of tumors are highly variable, where more effective treatments exist for certain tumors (e.g. breast cancer and lymphoma) relative to other tumors (e.g. pancreatic cancer). Furthermore, FDG tumor avidity and heterogeneity are variable across tumor types (e.g. head & neck squamous cell carcinoma is generally more homogeneous with intense uptake, while pancreatic tumors tend to be more heterogeneous and involve mild to moderate FDG uptake).
Routine reporting in the clinic has been primarily focused on SUVmax and also more recently on SUVpeak (Wahl et al., 2009; Lodge et al., 2012), neither of which require accurate tumor segmentation. At the same time, there is emerging literature on the prognostic value of volumetric analysis (MTV, TLG). Though presenting the challenge of requiring robust tumor segmentation, volumetric analysis is increasing shown to outperform conventional SUV-based markers in prognostication of certain cancer types, such as head & neck and lung cancer (Larson et al., 1999; Pak et al.; Koyasu et al.; Kikuchi et al.; Paidpally et al.; Chang et al.; Ryu et al.; Abd El-Hafez et al.; Zhang et al., 2013; Liao et al., 2012; Chen et al., 2012). By contrast, such an added value has not been shown for other cancer types, such as pancreatic cancer (Chirindel et al., 2015). These observations are consistent with our own analysis, wherein analysis of the head & neck dataset revealed optimized performance for a<1, while analysis of the pancreatic dataset arrived at optimized performance at a>1. At the same time, what our work reveals is that volumetric analysis (in the very broad sense of the term, i.e. any use of volume information at all) has value for many cancer types. This is because, within the proposed gETU metric, any finite a value still utilizes some volume information, and can potentially add to the prognostic capability of PET imaging.
4.3. Consideration of other factors
Future work should include comprehensive analysis of the impact of noise on the performance of the proposed gETU metric across a values. One could imagine that as a values increase, given higher emphasis on fewer voxels, that greater variability would be observed. Our preliminary analysis confirmed this, wherein we considered a simple bootstrapping approach and additional noise was added to the tumor data. The resulting p-value and LOGL curves as functions of a in the Cox proportional hazards regression showed enhanced fluctuations as a increases to values corresponding to SUVmax. Extensive analysis is needed to additionally incorporate the effect of noise on tumor segmentation and volume estimation, and how that impacts the gETU metric, but it is expected that an overall pattern of increasing variability with increasing a values will be observed.
The present analysis may also be extended to other methods of tumor delineation and subsequent quantification, including those that especially emphasize tumor heterogeneity (Tylski et al., 2010; Belhassen and Zaidi, 2010; Abdoli et al., 2013; Burger et al., 2014a; Burger et al., 2014b). Furthermore, use of partial volume correction strategies during (Rahmim et al., 2013) or after image reconstruction (Rousset et al., 2007; Soret et al., 2007; Erlandsson et al., 2012) in conjunction with the specific segmentation method and the proposed metric can be investigated, to study the effect on parameter optimization as well as overall impact on prediction and prognostication tasks.
5. Conclusion
We have proposed a new generalized effective total uptake (gETU) metric, derived similar in spirit to the generalized equivalent uniform dose (gEUD) as utilized in radiation therapy. The metric aims to quantify tumor aggressiveness for the purpose of enhanced prediction and prognostication. It has the particular advantage of generalizing commonly utilized metrics using a single additional degree-of-freedom or parameter a (values of a = 0, 1 and ∞ correspond to MTV, TLG and SUVmax, respectively). This framework was applied to (a) 113 patients with oropharyngeal squamous cell carcinoma, and (b) 72 patients with locally advanced pancreatic adenocarcinoma. Kaplan-Meier survival analysis demonstrated that enhanced outcome prediction was obtained for a=0.25 and a=3.2, respectively, highlighting the varying importance of PET tumor volume vs. uptake (burden vs. avidity) in these two types of cancer patients. Overall, the proposed methodology allows placement of differing degrees of emphasis on tumor volume vs. uptake for different cancer types to enable enhanced clinical outcome prediction.
Acknowledgments
This work was in part supported by NIH grant R01CA129182. The authors wish to especially thank Jason Harper and Dennis Nelson (MIM software Inc.) for valuable support.
Appendix A. Derivation of the proposed metric
We begin with the idea that risk of an adverse outcome, given a particular disease/tracer/therapy, increases with intensity of the expression of certain tumor features. First we consider uniform uptake in tumors of a given volume V. We define the adverse outcome probability (AOP), the probability of progression relative to a particular clinical endpoint, via the cumulative distribution function (CDF) of the normal distribution as
| (A.1) |
where in this relation t is given by:
| (A.2) |
PAOP is the adverse outcome probability, u(V) is the equivalent uniform uptake (PET uptake/intensity) for the volume V, u50 (V) is the uniform uptake at this volume that results in a 50% probability of an adverse outcome, and σ(V) is the standard deviation of outcome likelihood.
Now we assume a power-law relationship such that for a given reference volume Vref:
| (A.3) |
For the adverse outcome probability PAOP to be preserved, (A.2) must then be invariant with respect to volume changes, and for this to happen, the uptake must also follow:
| (A.4) |
We first consider the simplest extension to non-uniform uptake: uniform uptake in a fractional sub-volume v = V/Vref of the reference volume, Vref, with zero uptake in the rest. Re-arranging (A.4):
| (A.5) |
We refer to this as the generalized equivalent uniform uptake (gEUU) for the original tumor volume given uniform uptake in only a fractional volume. This is analogous to the concept of Deff or gEUD in the radiation therapy literature therapy (Mohan et al., 1992; Niemierko, 1999; Choi and Deasy, 2002; Li et al., 2012). The framework is with respect to a reference volume. Our aim however is to provide a generalized metric enabling inter-tumor comparisons in imaging, and thus we wish to eliminate dependence on an arbitrary reference volume. Thus, we revert to Eq. (A.4), and define the generalized effective total uptake (gETU) metric:
| (A.6) |
Overall, we express the condition that for a particular outcome given an uptake-volume combination (u, V), there exist a set of uptake-volume combinations (u′, V′) that produce an equi-probable endpoint likelihood, providing a simple and efficient one-parameter phenomenological model using a power law for iso-probability contours. Setting a = 1/n, from (A.6) it follows that
| (A.7) |
Now, consider a general non-uniform distribution of uptake, with maximum uptake umax. Assuming the power law applies to small sub-volumes, a sub-volume with uptake u and volume Vi is equivalent to a sub-volume Veff,i with uptake umax, where Veff,i is given by:
| (A.8) |
Hence the equivalent volume for the entire distribution is:
| (A.9) |
where N is the number of sub-volumes. Subsequently, according to (A.6), the effective total uptake is given by:
| (A.10) |
arriving at our proposed metric (1).
References
- Abd El-Hafez YG, Moustafa HM, Khalil HF, Liao CT, Yen TC. Total lesion glycolysis: a possible new prognostic parameter in oral cavity squamous cell carcinoma. Oral Oncol. 49:261–8. doi: 10.1016/j.oraloncology.2012.09.005. [DOI] [PubMed] [Google Scholar]
- Abdoli M, Dierckx RAJO, Zaidi H. Contourlet-based active contour model for PET image segmentation. Med Phys. 2013;40 doi: 10.1118/1.4816296. [DOI] [PubMed] [Google Scholar]
- Aerts HJWL, Velazquez ER, Leijenaar RTH, Parmar C, Grossmann P, Carvalho S, Bussink J, Monshouwer R, Haibe-Kains B, Rietveld D, Hoebers F, Rietbergen MM, Leemans CR, Dekker A, Quackenbush J, Gillies RJ, Lambin P. Decoding tumour phenotype by noninvasive imaging using a quantitative radiomics approach. Nat Commun. 2014;5:4006. doi: 10.1038/ncomms5006. [DOI] [PMC free article] [PubMed] [Google Scholar]
- Asselin MC, O’Connor JPB, Boellaard R, Thacker NA, Jackson A. Quantifying heterogeneity in human tumours using MRI and PET. Eur J Cancer. 2012;48:447–55. doi: 10.1016/j.ejca.2011.12.025. [DOI] [PubMed] [Google Scholar]
- Baldock AL, Rockne RC, Boone AD, Neal ML, Hawkins-Daarud A, Corwin DM, Bridge CA, Guyman LA, Trister AD, Mrugala MM, Rockhill JK, Swanson KR. From patient-specific mathematical neuro-oncology to precision medicine. Front Oncol. 2013;3:62. doi: 10.3389/fonc.2013.00062. [DOI] [PMC free article] [PubMed] [Google Scholar]
- Basu S, Zaidi H, Houseni M, Bural G, Udupa J, Acton P, Torigian DA, Alavi A. Novel quantitative techniques for assessing regional and global function and structure based on modern imaging modalities: Implications for normal variation, aging and diseased states. Semin Nucl Med. 2007;37:223–39. doi: 10.1053/j.semnuclmed.2007.01.005. [DOI] [PubMed] [Google Scholar]
- Belhassen S, Zaidi H. A novel fuzzy C-means algorithm for unsupervised heterogeneous tumor quantification in PET. Med Phys. 2010;37:1309–24. doi: 10.1118/1.3301610. [DOI] [PubMed] [Google Scholar]
- Bettinardi V, Danna M, Savi A, Lecchi M, Castiglioni I, Gilardi MC, Bammer H, Lucignani G, Fazio F. Performance evaluation of the new whole-body PET/CT scanner: Discovery ST. Eur J Nucl Med Mol I. 2004;31:867–81. doi: 10.1007/s00259-003-1444-2. [DOI] [PubMed] [Google Scholar]
- Burger IA, Vargas HA, Apte A, Beattie BJ, Humm JL, Gonen M, Larson SM, Schmidtlein CR. PET quantification with a histogram derived total activity metric: Superior quantitative consistency compared to total lesion glycolysis with absolute or relative SUV thresholds in phantoms and lung cancer patients. Nucl Med Biol. 2014a;41:410–8. doi: 10.1016/j.nucmedbio.2014.02.006. [DOI] [PMC free article] [PubMed] [Google Scholar]
- Burger IA, Vargas HA, Beattie BJ, Goldman DA, Zheng JT, Larson SM, Humm JL, Schmidtlein CR. How to assess background activity: introducing a histogram-based analysis as a first step for accurate one-step PET quantification. Nucl Med Commun. 2014b;35:316–24. doi: 10.1097/MNM.0000000000000045. [DOI] [PubMed] [Google Scholar]
- Chalkidou A, O’Doherty MJ, Marsden PK. False Discovery Rates in PET and CT Studies with Texture Features: A Systematic Review. Plos One. 2015;10 doi: 10.1371/journal.pone.0124165. [DOI] [PMC free article] [PubMed] [Google Scholar]
- Chang KP, Tsang NM, Liao CT, Hsu CL, Chung MJ, Lo CW, Chan SC, Ng SH, Wang HM, Yen TC. Prognostic significance of 18F-FDG PET parameters and plasma Epstein-Barr virus DNA load in patients with nasopharyngeal carcinoma. J Nucl Med. 53:21–8. doi: 10.2967/jnumed.111.090696. [DOI] [PubMed] [Google Scholar]
- Chen HHW, Chiu NT, Su WC, Guo HR, Lee BF. Prognostic Value of Whole-Body Total Lesion Glycolysis at Pretreatment FDG PET/CT in Non-Small Cell Lung Cancer. Radiology. 2012;264:559–66. doi: 10.1148/radiol.12111148. [DOI] [PubMed] [Google Scholar]
- Chicklore S, Goh V, Siddique M, Roy A, Marsden PK, Cook GJR. Quantifying tumour heterogeneity in F-18-FDG PET/CT imaging by texture analysis. Eur J Nucl Med Mol I. 2013;40:133–40. doi: 10.1007/s00259-012-2247-0. [DOI] [PubMed] [Google Scholar]
- Chirindel A, Alluri KC, Chaudhry MA, Wahl RL, Pawlik TM, Herman JM, Subramaniam RM. Prognostic Value of FDG PET/CT-Derived Parameters in Pancreatic Adenocarcinoma at Initial PET/CT Staging. Am J Roentgenol. 2015;204:1093–9. doi: 10.2214/AJR.14.13156. [DOI] [PubMed] [Google Scholar]
- Choi B, Deasy J. The generalized equivalent uniform dose function as a basis for intensity-modulated treatment planning. Phys Med Biol. 2002;47:3579–89. doi: 10.1088/0031-9155/47/20/302. [DOI] [PubMed] [Google Scholar]
- Conners RW, Trivedi MM, Harlow CA. Segmentation of a High-Resolution Urban Scene Using Texture Operators. Computer Vision Graphics and Image Processing. 1984;25:273–310. [Google Scholar]
- Cook GJR, Siddique M, Taylor BP, Yip C, Chicklore S, Goh V. Radiomics in PET: principles and applications. Clinical and Translational Imaging. 2014;2:269–76. [Google Scholar]
- Eary JF, O’Sullivan F, O’Sullivan J, Conrad EU. Spatial Heterogeneity in Sarcoma (18)F-FDG Uptake as a Predictor of Patient Outcome. J Nucl Med. 2008;49:1973–9. doi: 10.2967/jnumed.108.053397. [DOI] [PMC free article] [PubMed] [Google Scholar]
- Edge SB, Compton CC. The American Joint Committee on Cancer: the 7th Edition of the AJCC Cancer Staging Manual and the Future of TNM. Ann Surg Oncol. 2010;17:1471–4. doi: 10.1245/s10434-010-0985-4. [DOI] [PubMed] [Google Scholar]
- El Naqa I, Grigsby PW, Apte A, Kidd E, Donnelly E, Khullar D, Chaudhari S, Yang D, Schmitt M, Laforest R, Thorstad WL, Deasy JO. Exploring feature-based approaches in PET images for predicting cancer treatment outcomes. Pattern Recognition. 2009;42:1162–71. doi: 10.1016/j.patcog.2008.08.011. [DOI] [PMC free article] [PubMed] [Google Scholar]
- Erlandsson K, Buvat I, Pretorius PH, Thomas BA, Hutton BF. A review of partial volume correction techniques for emission tomography and their applications in neurology, cardiology and oncology. Phys Med Biol. 2012;57:R119–R59. doi: 10.1088/0031-9155/57/21/R119. [DOI] [PubMed] [Google Scholar]
- Gambhir SS, Czernin J, Schwimmer J, Silverman DHS, Coleman RE, Phelps ME. A tabulated summary of the FDG PET literature. J Nucl Med. 2001;42:1s–93s. [PubMed] [Google Scholar]
- Haralick RM, Shanmuga K, Dinstein I. Textural Features for Image Classification. Ieee Transactions on Systems Man and Cybernetics. 1973;Smc3:610–21. [Google Scholar]
- Hatt M, Le Pogam A, Visvikis D, Pradier O, Le Rest CC. Impact of Partial-Volume Effect Correction on the Predictive and Prognostic Value of Baseline F-18-FDG PET Images in Esophageal Cancer. J Nucl Med. 2012;53:12–20. doi: 10.2967/jnumed.111.092775. [DOI] [PMC free article] [PubMed] [Google Scholar]
- Hatt M, Majdoub M, Vallieres M, Tixier F, Le Rest CC, Groheux D, Hindie E, Martineau A, Pradier O, Hustinx R, Perdrisot R, Guillevin R, El Naqa I, Visvikis D. F-18-FDG PET Uptake Characterization Through Texture Analysis: Investigating the Complementary Nature of Heterogeneity and Functional Tumor Volume in a Multi-Cancer Site Patient Cohort. J Nucl Med. 2015;56:38–44. doi: 10.2967/jnumed.114.144055. [DOI] [PubMed] [Google Scholar]
- Kelloff G, Hoffman JM, Johnson B, Scher HI, Siegel BA, Cheng EY, Cheson BD, O’Shaughnessy J, Guyton KZ, Mankoff DA, Shankar L, Larson SM, Sigman CC, Schilsky RL, Sullivan DC. Progress and promise of FDG-PET imaging for cancer patient management and oncologic drug development. Clin Cancer Res. 2005;11:2785–808. doi: 10.1158/1078-0432.CCR-04-2626. [DOI] [PubMed] [Google Scholar]
- Kemp BJ, Kim C, Williams JJ, Ganin A, Lowe VJ. NEMA NU 2-2001 performance measurements of an LYSO-based PET/CT system in 2D and 3D acquisition modes. J Nucl Med. 2006;47:1960–7. [PubMed] [Google Scholar]
- Kikuchi M, Koyasu S, Shinohara S, Usami Y, Imai Y, Hino M, Itoh K, Tona R, Kanazawa Y, Kishimoto I, Harada H, Naito Y. Prognostic value of pretreatment F-fluorodeoxyglucose positron emission tomography/CT volume-based parameters in patients with oropharyngeal squamous cell carcinoma with known p16 and p53 status. Head Neck. doi: 10.1002/hed.23784. [DOI] [PubMed] [Google Scholar]
- Koyasu S, Nakamoto Y, Kikuchi M, Suzuki K, Hayashida K, Itoh K, Togashi K. Prognostic value of pretreatment 18F-FDG PET/CT parameters including visual evaluation in patients with head and neck squamous cell carcinoma. AJR Am J Roentgenol. 202:851–8. doi: 10.2214/AJR.13.11013. [DOI] [PubMed] [Google Scholar]
- Kumar V, Gu YH, Basu S, Berglund A, Eschrich SA, Schabath MB, Forster K, Aerts HJWL, Dekker A, Fenstermacher D, Goldgof DB, Hall LO, Lambin P, Balagurunathan Y, Gatenby RA, Gillies RJ. Radiomics: the process and the challenges. Magn Reson Imaging. 2012;30:1234–48. doi: 10.1016/j.mri.2012.06.010. [DOI] [PMC free article] [PubMed] [Google Scholar]
- Kutcher GJ, Burman C. Calculation of Complication Probability Factors for Non-Uniform Normal Tissue Irradiation - the Effective Volume Method. Int J Radiat Oncol. 1989;16:1623–30. doi: 10.1016/0360-3016(89)90972-3. [DOI] [PubMed] [Google Scholar]
- Lambin P, Rios-Velazquez E, Leijenaar R, Carvalho S, van Stiphout RGPM, Granton P, Zegers CML, Gillies R, Boellard R, Dekker A, Aerts HJWL, Consortium Q-C. Radiomics: Extracting more information from medical images using advanced feature analysis. Eur J Cancer. 2012;48:441–6. doi: 10.1016/j.ejca.2011.11.036. [DOI] [PMC free article] [PubMed] [Google Scholar]
- Larson SM, Erdi Y, Akhurst T, Mazumdar M, Macapinlac HA, Finn RD, Casilla C, Fazzari M, Srivastava N, Yeung HW, Humm JL, Guillem J, Downey R, Karpeh M, Cohen AE, Ginsberg R. Tumor Treatment Response Based on Visual and Quantitative Changes in Global Tumor Glycolysis Using PET-FDG Imaging. The Visual Response Score and the Change in Total Lesion Glycolysis. Clin Positron Imaging. 1999;2:159–71. doi: 10.1016/s1095-0397(99)00016-3. [DOI] [PubMed] [Google Scholar]
- Li XA, Alber M, Deasy JO, Jackson A, Jee KWK, Marks LB, Martel MK, Mayo C, Moiseenko V, Nahum AE, Niemierko A, Semenenko VA, Yorke ED. The use and QA of biologically related models for treatment planning (full report #166) 2012 doi: 10.1118/1.3685447. ( http://www.aapm.org/pubs/reports/RPT_166.pdf: AAPM) [DOI] [PubMed]
- Liao SR, Penney BC, Zhang H, Suzuki K, Pu YL. Prognostic Value of the Quantitative Metabolic Volumetric Measurement on 18F-FDG PET/CT in Stage IV Nonsurgical Small-cell Lung Cancer. Academic Radiology. 2012;19:69–77. doi: 10.1016/j.acra.2011.08.020. [DOI] [PubMed] [Google Scholar]
- Lodge MA, Chaudhry MA, Wahl RL. Noise considerations for PET quantification using maximum and peak standardized uptake value. J Nucl Med. 2012;53:1041–7. doi: 10.2967/jnumed.111.101733. [DOI] [PMC free article] [PubMed] [Google Scholar]
- Maisonobe JA, Garcia CA, Necib H, Vanderlinden B, Hendlisz A, Flamen P, Buvat I. Comparison of PET metabolic indices for the early assessment of tumour response in metastatic colorectal cancer patients treated by polychemotherapy. Eur J Nucl Med Mol I. 2013;40:166–74. doi: 10.1007/s00259-012-2274-x. [DOI] [PMC free article] [PubMed] [Google Scholar]
- Mankoff DA, Dehdashti F, Shields AF. Characterizing tumors using metabolic imaging: PET imaging of cellular proliferation and steroid receptors. Neoplasia. 2000;2:71–88. doi: 10.1038/sj.neo.7900075. [DOI] [PMC free article] [PubMed] [Google Scholar]
- Mankoff DA, Eary JF, Link JM, Muzi M, Rajendran JG, Spence AM, Krohn KA. Tumor-specific positron emission tomography Imaging in patients: [F-18) fluorodeoxyglucose and beyond. Clin Cancer Res. 2007;13:3460–9. doi: 10.1158/1078-0432.CCR-07-0074. [DOI] [PubMed] [Google Scholar]
- Mankoff DA, Pryma DA, Clark AS. Molecular Imaging Biomarkers for Oncology Clinical Trials. J Nucl Med. 2014;55:525–8. doi: 10.2967/jnumed.113.126128. [DOI] [PubMed] [Google Scholar]
- Michor F, Polyak K. The Origins and Implications of Intratumor Heterogeneity. Cancer Prev Res. 2010;3:1361–4. doi: 10.1158/1940-6207.CAPR-10-0234. [DOI] [PMC free article] [PubMed] [Google Scholar]
- Mohan R, Mageras GS, Baldwin B, Brewster LJ, Kutcher GJ, Leibel S, Burman CM, Ling CC, Fuks Z. Clinically Relevant Optimization of 3-D Conformal Treatments. Med Phys. 1992;19:933–44. doi: 10.1118/1.596781. [DOI] [PubMed] [Google Scholar]
- Niemierko A. Reporting and analyzing dose distributions: A concept of equivalent uniform dose. Med Phys. 1997;24:103–10. doi: 10.1118/1.598063. [DOI] [PubMed] [Google Scholar]
- Niemierko A. A Generalized Concept of Equivalent Uniform Dose (EUD) Med Phys. 1999;26:1100. doi: 10.1118/1.598063. [DOI] [PubMed] [Google Scholar]
- Paidpally V, Chirindel A, Chung CH, Richmon J, Koch W, Quon H, Subramaniam RM. FDG volumetric parameters and survival outcomes after definitive chemoradiotherapy in patients with recurrent head and neck squamous cell carcinoma. AJR Am J Roentgenol. 203:W139–45. doi: 10.2214/AJR.13.11654. [DOI] [PMC free article] [PubMed] [Google Scholar]
- Paidpally V, Chirindel A, Lam S, Agrawal N, Quon H, Subramaniam RM. FDG-PET/CT imaging biomarkers in head and neck squamous cell carcinoma. Imaging Med. 2012;4:633–47. doi: 10.2217/iim.12.60. [DOI] [PMC free article] [PubMed] [Google Scholar]
- Pak K, Cheon GJ, Nam HY, Kim SJ, Kang KW, Chung JK, Kim EE, Lee DS. Prognostic value of metabolic tumor volume and total lesion glycolysis in head and neck cancer: a systematic review and meta-analysis. J Nucl Med. 55:884–90. doi: 10.2967/jnumed.113.133801. [DOI] [PubMed] [Google Scholar]
- Rahmim A, Coughlin J, Gonzalez M, Endres CJ, Zhou Y, Wong DF, Wahl RL, Sossi V, Pomper MG. Novel parametric PET image quantification using texture and shape analysis. Proc IEEE Nucl Sci Symp Conf. 2012:2227–30. [Google Scholar]
- Rahmim A, Qi J, Sossi V. Resolution modeling in PET imaging: Theory, practice, benefits and pitfalls. Med Phys vol. 2013;40:064301. doi: 10.1118/1.4800806. [DOI] [PMC free article] [PubMed] [Google Scholar]
- Rousset OG, Rahmim A, Alavi A, Zaidi H. Partial volume correction strategies in PET. PET Clinics. 2007;2:235–49. doi: 10.1016/j.cpet.2007.10.005. [DOI] [PubMed] [Google Scholar]
- Ryu IS, Kim JS, Roh JL, Lee JH, Cho KJ, Choi SH, Nam SY, Kim SY. Prognostic value of preoperative metabolic tumor volume and total lesion glycolysis measured by 18F-FDG PET/CT in salivary gland carcinomas. J Nucl Med. 54:1032–8. doi: 10.2967/jnumed.112.116053. [DOI] [PubMed] [Google Scholar]
- Soret M, Bacharach SL, Buvat I. Partial-volume effect in PET tumor imaging. J Nucl Med. 2007;48:932–45. doi: 10.2967/jnumed.106.035774. [DOI] [PubMed] [Google Scholar]
- Tian Q, Price ND, Hood L. Systems cancer medicine: towards realization of predictive, preventive, personalized and participatory (P4) medicine. J Intern Med. 2012;271:111–21. doi: 10.1111/j.1365-2796.2011.02498.x. [DOI] [PMC free article] [PubMed] [Google Scholar]
- Tixier F, Hatt M, Valla C, Fleury V, Lamour C, Ezzouhri S, Ingrand P, Perdrisot R, Visvikis D, Le Rest CC. Visual Versus Quantitative Assessment of Intratumor F-18-FDG PET Uptake Heterogeneity: Prognostic Value in Non-Small Cell Lung Cancer. J Nucl Med. 2014;55:1235–41. doi: 10.2967/jnumed.113.133389. [DOI] [PubMed] [Google Scholar]
- Tixier F, Le Rest CC, Hatt M, Albarghach N, Pradier O, Metges JP, Corcos L, Visvikis D. Intratumor Heterogeneity Characterized by Textural Features on Baseline (18)F-FDG PET Images Predicts Response to Concomitant Radiochemotherapy in Esophageal Cancer. J Nucl Med. 2011;52:369–78. doi: 10.2967/jnumed.110.082404. [DOI] [PMC free article] [PubMed] [Google Scholar]
- Tylski P, Dusart M, Necib H, Vanderlinden B, Buvat I. Which parameter should be considered to characterize tumor changes in patient monitoring using FDG-PET? J nucl med meeting abstracts. 2008;49:382P-c. [Google Scholar]
- Tylski P, Stute S, Grotus N, Doyeux K, Hapdey S, Gardin I, Vanderlinden B, Buvat I. Comparative Assessment of Methods for Estimating Tumor Volume and Standardized Uptake Value in F-18-FDG PET. J Nucl Med. 2010;51:268–76. doi: 10.2967/jnumed.109.066241. [DOI] [PubMed] [Google Scholar]
- van Heijl M, Omloo JM, Henegouwen MIV, van Lanschot JJ, Sloof GW, Boellaard R. Influence of ROI definition, partial volume correction and SUV normalization on SUV-survival correlation in oesophageal cancer. Nucl Med Comm. 2010;31:652–8. [PubMed] [Google Scholar]
- van Velden FHP, Cheebsumon P, Yaqub M, Smit EF, Hoekstra OS, Lammertsma AA, Boellaard R. Evaluation of a cumulative SUV-volume histogram method for parameterizing heterogeneous intratumoural FDG uptake in non-small cell lung cancer PET studies. Eur J Nucl Med Mol I. 2011;38:1636–47. doi: 10.1007/s00259-011-1845-6. [DOI] [PMC free article] [PubMed] [Google Scholar]
- Vriens D, Disselhorst JA, Oyen WJG, de Geus-Oei LF, Visser EP. Quantitative Assessment of Heterogeneity in Tumor Metabolism Using FDG-PET. Int J Radiat Oncol. 2012;82:E725–E31. doi: 10.1016/j.ijrobp.2011.11.039. [DOI] [PubMed] [Google Scholar]
- Wahl RL. Principles and Practice of PET and PET/CT. 2. Philadelphia, PA: Lippincott Williams & Wilkins; 2008. [Google Scholar]
- Wahl RL, Jacene H, Kasamon Y, Lodge MA. From RECIST to PERCIST: Evolving Considerations for PET Response Criteria in Solid Tumors. J Nucl Med. 2009;50:122S–50S. doi: 10.2967/jnumed.108.057307. [DOI] [PMC free article] [PubMed] [Google Scholar]
- Wilks SS. The large-sample distribution of the likelihood ratio for testing composite hypotheses. Ann Math Stat. 1938;9:60–2. [Google Scholar]
- Zhang H, Wroblewski K, Liao S, Kampalath R, Penney BC, Zhang Y, Pu YL. Prognostic Value of Metabolic Tumor Burden from F-18-FDG PET in Surgical Patients with Non-small-cell Lung Cancer. Academic Radiology. 2013;20:32–40. doi: 10.1016/j.acra.2012.07.002. [DOI] [PubMed] [Google Scholar]