Abstract
Because the transition from oxidative phosphorylation to anaerobic glycolytic metabolism is a hallmark of cancer progression, approaches to identify single living cancer cells by their unique glucose metabolic signature would be useful. Here, we present nanopipettes specifically developed to measure glucose levels in single cells with temporal and spatial resolution, and we use this technology to verify the hypothesis that individual cancer cells can indeed display higher intracellular glucose levels. The nanopipettes were functionalized as glucose nanosensors by immobilizing glucose oxidase (GOx) covalently to the tip so that the interaction of glucose with GOx resulted in a catalytic oxidation of β-D-glucose to D-gluconic acid, which was measured as a change in impedance due to drop in pH of the medium at the nanopipette tip. Calibration studies showed a direct relationship between impedance changes at the tip and glucose concentration in solution. The glucose nanosensor quantified single cell intracellular glucose levels in human fibroblasts and the metastatic breast cancer lines MDA-MB-231 and MCF7 and revealed that the cancer cells expressed reproducible and reliable increases in glucose levels compared to the nonmalignant cells. Nanopipettes allow repeated sampling of the same cell, as cells remain viable during and after measurements. Therefore, nanopipette-based glucose sensors provide an approach to compare changes in glucose levels with changes in proliferative or metastatic state. The platform has great promise for mechanistic investigations, as a diagnostic tool to distinguish cancer cells from nonmalignant cells in heterogeneous tissue biopsies, as well as a tool for monitoring cancer progression in situ.
Keywords: biosensor, intracellular glucose, cancer metabolomics, single cell, nanopore, nanopipette
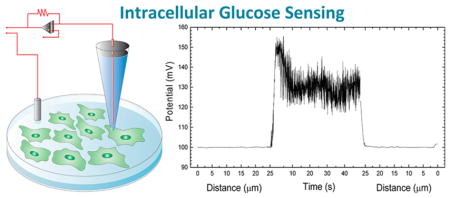
Graphical Abstract
All cells require glucose for survival but, because of their rapid growth and proliferation, tumor cells require increased metabolic activity compared to nonproliferating cells. Cancer cells are known to alter their metabolic pathways by shifting from mitochondrial oxidative phosphorylation to anaerobic glycolysis under hypoxic conditions. The latter is an energetically inefficient process that requires excess amounts of glucose.1–3 Cancer cells can adapt to the increased requirement for glucose by increasing expression of glucose transporters GLUT1 and GLUT12.4–6 The transition of cancer cells to the glycolysis pathway confers protection against apoptosis, prolongs survival, increases proliferation, and enhances resistance against chemotherapeutic drugs.7–9 There is also an association between metabolism and virulence: oncogenic viruses enhance glucose uptake in infected cells by affecting expression of glucose transporters, such as GLUT 1 and GLUT2, as well as glycolytic enzymes.10
Though a number of studies have suggested that glucose metabolism in cancerous cells is altered, and there is speculation that metastatic and drug-resistant behavior might be a result of this altered metabolism, little is known about the intracellular glucose concentration at single-cell level.11 Identification of individual cancer cells with high intracellular glucose levels in a population is of great importance to study transcriptomic and genomic differences of such cells, as they can provide specific targets for new generation cancer therapies.
Because the transition from oxidative phosphorylation to anaerobic glycolytic metabolism occurs at the single cell level and is a hallmark of cancer progression, we sought an approach to identify individual living cancer cells by their unique metabolic signatures. Such an approach would have important uses in monitoring cancer progression and could have implications in cancer diagnostics in searching for malignant cells in tissue biopsies. A single-cell approach could also facilitate the development of novel therapies to block cancer cell progression or selectively kill cancerous cells at early stages of development and the search for drugs that overcome cancer cell resistance.
Current technologies to investigate cancer biology at the single-cell level utilize indirect (e.g., microdialysis, nuclear magnetic resonance (NMR), fluorescence spectroscopy, etc.) or destructive experimental approaches, and do not allow investigation of an intact single cancer cell metabolism due to low sensitivity and selectivity with low spatial resolution.12,13 Furthermore, differentiation between noncancerous and cancerous cells in a heterogeneous tumor tissue based on metabolic activities is not possible with conventional methods. Standard biochemical approaches and metabolomics techniques disrupt and homogenize the heterogeneous tissue, preventing resolution of glucose utilization in the relatively small population of cancer cells.14 Fluorescence probes have been widely used to study single cell metabolism.15,16 Other approaches have been employed that require two-photon microscopy; this, however, can involve photobleaching of tagged glucose, which may not behave like natural glucose.17,18 Notably, most of these probes have been designed for research purposes to be used on homogeneous cell lines. Additionally, little is known about the impact of these probes on regular cell metabolism. Consequently, they cannot be utilized to perform differential glucose measurements in cancer cells versus noncancer cells in heterogeneous cell populations like those found in tumors. Recently, the use of electrochemical microsensors (>0.7 μm) has been demonstrated for intracellular glucose measurement in frog oocytes and human adipocytes.19 Both models are examples of large spherical cell types with diameters bigger than 60 μm. However, most adherent human cells, including cancerous cells, fall within a size range of 10–20 μm in diameter and 0.5 to 3 μm in thickness.20,21 Therefore, manual insertion of such microsensors in adherent cells is difficult; moreover, the damage inflicted upon the cells due to the relatively large probe size may cause inaccurate assessment of intracellular metabolites.
Intracellular investigation at the single-cell level is challenging due to the lack of (i) nondestructive analytical sensors and (ii) controlled cell targeting technology. To address the shortcomings of the current methods for single-cell measurements, we have developed a novel sensing technology taking advantage of an emerging nanotechnology based on the use of nanopipettes.22 The nanopipette tip is <100 nm, 1/10th the size of a standard micropipette used for patch clamp electrophysiology.23 Due to the small pore diameter, the nanopipette can be inserted into single cells repetitively without altering cellular functions.24 The small size of the nanopipette tip provides high spatial resolution, and allows site- and target-specific insertion and measurement of metabolic activities at single-cell level in a heterogeneous cell population.25,26 Additionally, nanopipette sensors provide real-time intracellular measurements by taking advantage of scanning ion conductance microscopy (SICM) principles.27–29 We have shown previously that nanopipette tips can be coated with biorecognition materials such as antibodies, aptamers, and chelating agents that selectively bind to specific cellular targets.23,30,31 A current is passed through the nanopipette, and the current changes when antigen binds to the antibody at the tip. The impedance change can be used for detection of target molecules with high sensitivity. In this paper, we describe the fabrication of a nanobiosensor to perform direct measurement of free glucose at the single-cell level. We demonstrate that the nanopipette technology successfully distinguishes single breast cancer cells from single nonmalignant human cells based on their glucose levels. Our technology therefore can be applied to diagnostic and mechanistic studies of cancer and would also be applicable to other investigations of metabolic heterogeneity in a cell population.
To adapt our nanopipettes into glucose nanosensors, we developed a targeting system for the nanopipette with a custom-built SICM setup26 (Supporting Information (SI) Figure S1). This device allows the automated positioning of the nanopipette tip nanometers above a target cell. The SICM can be used to insert the nanopipette inside a target cell and then automatically reposition the nanopipette tip, once extracted from the cell, at the same position in the same cell for continuous monitoring of an individual cell over time.
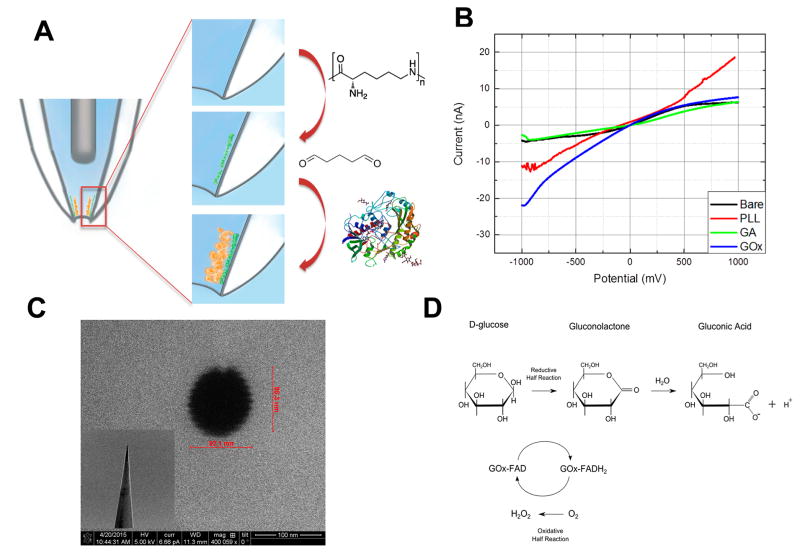
Quartz nanopipette surfaces are negatively charged at physiological pH. Poly(L-lysine) (PLL), a polycationic molecule, is used to functionalize the inner wall of the nanopipette through electrostatic interactions and hydrogen bonds. Additionally, amino groups on the PLL backbone provide functionalities where further modification can be performed. To facilitate glucose oxidase immobilization, the nanopipette surface was activated with glutaraldehyde, which cross-links the enzyme to the PLL modified surface (Figure 1A).
Figure 1.
(A) Schematic displaying the surface modifications for the immobilization of glucose oxidase to the nanopipette tip. First, the inner surface of quartz nanopipette is coated with PLL. Then the surface is treated with gluteraldehyde to cross-link the amino group of PLL and that of glucose oxidase. (B) Electrochemical characterization of nanopipette after each modification step. Supporting electrolyte was 10 mM PBS (pH 7.0). (C) Typical SEM image of the nanopipette tip. Inset displays the tip geometry. (D) Enzymatic conversion of D-glucose to hydrogen peroxide and gluconic acid.
The operational principle of the nanopipette is based on the changes in ionic current at the functionalized tip. This change is called current rectification. A negative surface charge results in high current response at negative applied potentials whereas a positively charged surface shows high current response at positive potential. Taking advantage of this principle, surface properties after each modification step were characterized using linear sweep voltammetry in a potential range from −1 to 1 V at a scan rate of 0.1 V/s (Figure 1B). Bare quartz surface is negatively charged at physiological pH conditions, thus the voltammetric trace is also negatively rectified (black line). After the poly(L-lysine) modification, the ionic current at positive potentials increased significantly. This rectification bias is due to the protonated amino residues at PLL backbone (red line). Glutaraldehyde treatment decreases the positive charge at the surface as it binds to PLL (green line). After the glucose oxidase functionalization, the nanopipette displayed a significant negative rectification because GOx contains negative charge at physiological pH (blue line). Scanning electron micrographs were taken to demonstrate the tip geometry and to calculate the pore opening of nanopipettes. SEM images showed that the nanopipette pore was circular and its size was between 90–100 nm (Figure 1C).
The glucose sensing principle of a GOx-functionalized nanopipette is based on the catalytic oxidation of β-D-glucose to D-gluconolactone and hydrogen peroxide (Figure 1D). As a part of the cellular respiration, cells convert, through phosphorylation processes, glucose into glucose-6-phosphate, which cannot undergo enzymatic reaction with glucose oxidase.32–34 Therefore, glucose oxidase is used commonly to determine free glucose levels in bodily fluids. GOx is a homodimer containing its cofactor flavin adenine dinucleotide (FAD) bound to its two identical 80-kDa subunits. Two simultaneous processes contribute to the concentration-dependent ionic current changes at the nanopipette. The first is the GOx-catalyzed oxidation of D-glucose producing gluconic acid, through the spontaneous hydrolysis of the initial product gluconolactone, that proportionately reduces the pH at the nanopore. The second is the second generation glucose biosensor like effect. Hydrogen peroxide is the byproduct of enzymatic reaction and can involve a redox reaction with ferrocene, an electron mediator.35 The control experiments conducted in the absence of ferrocene did not show high sensitivity toward glucose (data is not shown) proving evidence that the total ionic current change is a combination of local pH change and redox processes.
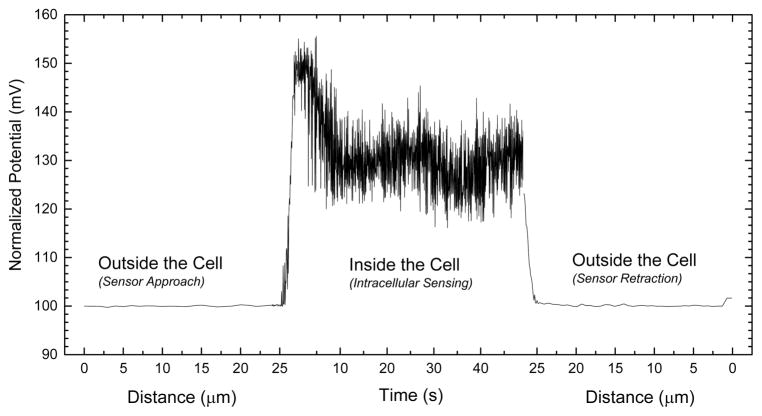
Figure 2 represents the potential-response changes during the controlled cell finding and intracellular measurements are performed. It is worthy of note that the first and third parts of the x axis are presented in distance. The distance given (~25 μm) in Figure 2 demonstrates the relative travel distance of the nanosensors between its origin point and cell surface. During the cell finding protocol a fixed potential of 500 mV is applied (experimental details are given in Supporting Information). When current-clamp signal was recorded at 1 nA during the surface finding to compare with the intracellular measurements, a steady state potential response has been observed suggesting that the potential was not affected from the locational changes of the nanosensor. When the nanosensor is in close proximity to a cell, alteration in the electrical signal initiates computerized cell penetration (Figure S5). Experimentally, the minimum penetration depth is found to be 0.8 μm. When the nanotip penetrates into a target cell, potential-response of the glucose-functionalized nanosensor changes due to the intracellular glucose level. Typical recordings in the cell last for 60 s. After the nanosensor is extracted from the cell, the tip potential found to be similar to the baseline levels recorded prior to the insertion. This fact indicates the tip is intact and insertion protocol does not damage the glucose nanosensors and also provides evidence that the nanopipette resistance changes only when the glucose oxidase reacts with free glucose at the nanopore. The cell surface finding and penetration signal are shown in detail in Figure S5 in the Supporting Information. These data demonstrate that a single glucose nanosensor can be reutilized for multiple cell interrogations.
Figure 2.
Single cell surface finding and intracellular glucose measurements using glucose nanosensor. The potential at the nanopipette tip is recorded providing both a way to assess the location of the tip relative to a cell. As the tip moves toward the cell, there is no change in potential but as it penetrates the cell, the potential is greatly increased. Typical recordings in the cell last for 60 s. Once the nanopipette is extracted from the cell the tip potential returns to levels similar to those prior to cell insertion. This indicates the tip is not likely to have been damaged by the insertion.
Current-clamp technique which is utilized regularly in our lab has been selected for the determination of glucose oxidase modified quartz nanopipettes. A fixed current of 1 nA was chosen for the analytical characterization. The sensitivity of the GOx nanopipette achieved the highest value at 1 nA for glucose. When higher current values were applied sensitivity dramatically decreased (Figure S2). This might be the result of increased electroosmotic flow at the close proximity of nanopipette walls pushing ionic species in backfilling solution out of nanopore.36 Experiments were conducted in phosphate buffer and cell growth media, specifically in sugar-free DMEM, and changes in potential-response were recorded. DMEM was selected for the sensor calibration for intracellular measurements because it provides the most similar matrix (including amino acids, vitamins, inorganic salts, etc.) to cytoplasmic fluid.
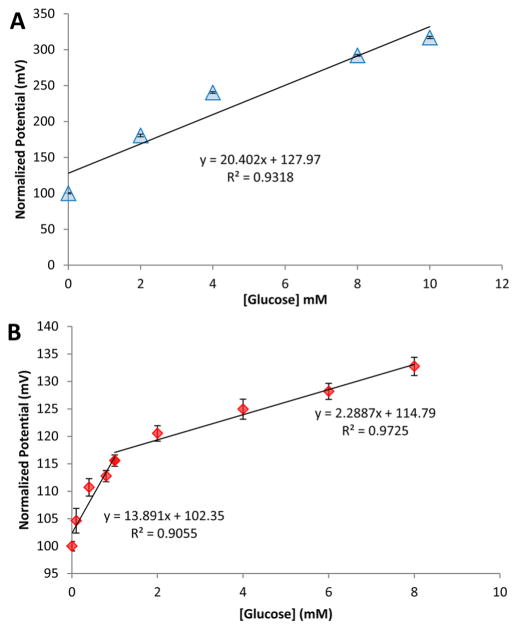
Figure 3 displays the calibration curves obtained with increasing glucose concentration in PBS and glucose-free DMEM using glucose nanosensors. The sensitivity of the nanosensors was 13.89 between 0.1 and 1 mM and 2.29 mV/ mM between 1 and 10 mM glucose for DMEM and a sensitivity of 20.40 mV/mM was obtained for PBS. The coefficient of correlation (R2) of the calibration curves were 0.9318 for PBS and 0.9055 and 0.9725 for DMEM. The bimodal distribution of the linear range in cell media could be a consequence of two sequential processes including electrophoretic flow of the substrate to the nanopipette tip and diffuusion of the products from the tip. Several factors can affect this behavior, such as slow diffusion rate of glucose through the nanopore in the presence of a variety of components present in cell media and fast enzymatic conversion that concentrates the products (including gluconic acid and hydrogen peroxide) at the nanopore. To assess the effect of simple glucose addition to the bulk solution, we performed calibration after each modification step (Figure S3). The nanopipettes in the absence of glucose oxidase showed no significant changes in potential-response with changes in glucose concentrations. The coefficient of variation of GOx-functionalized nanopipettes was calculated to be 10.4%. To determine the specificity of the nanosensor, the effect of common interferences were assessed and GOx-functionalized nanopipettes showed high specificity to glucose (Figure S4).
Figure 3.
Glucose-dependent potential-responses of glucose oxidase modified nanosensor in (A) 10 mM PBS (pH 7.0) and (B) cell media (DMEM). The bare nanopipette did not show concentration-dependent potential-response changes, demonstrating the specificity of GOx-modified nanopipette. The potential changes recorded at a fixed current of 1 nA and bandwidth of 1 kHz. The error bars represent the standard deviation for n = 3 replicates.
After the analytical characterization of the GOx-modified nanopipettes as glucose nanosensors, we used these sensors to evaluate whether intracellular free glucose levels differ between breast cancer cell and nonmalignant cell lines. We have utilized MDA-MB-231, MCF-7 and human fibroblasts as cell models. MDA-MB-231 and MCF-7 are breast cancer cell lines. MDA-MB-231 is a highly aggressive metastatic breast cancer type, whereas MCF-7 is an estradiol-responsive breast cancer line.4 These breast cancer cell lines were selected because they show differential sensitivity to drug treatment; therefore, we investigated whether intracellular glucose levels were correlated with drug resistance. Human fibroblasts were used as a control to represent normal cytoplasmic conditions.22 Intracellular glucose measurements were made in multiple individual cells from human fibroblasts, MCF-7 and MDA-MB-231 using the glucose nanosensors. Our glucose nanosensors were inserted using the customized SICM setup described earlier. After the insertion, a fixed current of 1 nA was applied for 60 s to perform the intracellular measurements.
We calculated the intracellular free glucose concentrations of an individual cell using the GOx calibration curve. Each individual cell was interrogated three times to obtain an accurate reading. Micrographs in Figure S6 were obtained during intracellular glucose measurements, and no changes in cell morphology were observed, further validating that these nanosensors do not cause physical damage to the cells. In our previous work, we have used nanopipettes to inject materials into single-cells and showed evidence that nanopipette manipulations did not cause functional damage to cells.24 In order to demonstrate the viability of cells after nanosensor insertion; we have employed this approach and utilized bare quartz single-barrel nanopipettes to label cells with a fluorescence probe. Figure S7 shows a cell labeled with Rhodamine B 5 min at 5 and 24 h after nanopipette manipulation. The results clearly demonstrate that nanopipette manipulations do not cause a lethal damage and cells survive. Figure 4 summarizes the intracellular glucose levels estimated using our glucose nanosensors for human fibroblasts, MCF-7 and MDA-MB-231 cells. Six human fibroblast cells were investigated for intracellular glucose measurements (Figure S6A) and the average free glucose was 0.63 (±0.44) mM (Figure 4). This low level is consistent with previous reports where a FRET-based indirect glucose assay was employed to measure intracellular glucose levels in Chinese hamster ovary (CHO) cells and found average glucose levels in a large cell population at stable growth rates of 0.4–1 mM.15 These early studies, however, could not determine the cytoplasmic glucose levels of individual cells due to the use of indirect methods lacking selectivity and sensitivity at the single-cell level. Using glucose nanosensors, we were able to elucidate the metabolic heterogeneity in a population of human fibroblasts: intracellular glucose concentrations varied from 0.17 to 1.51 mM (Figure S6).
Figure 4.
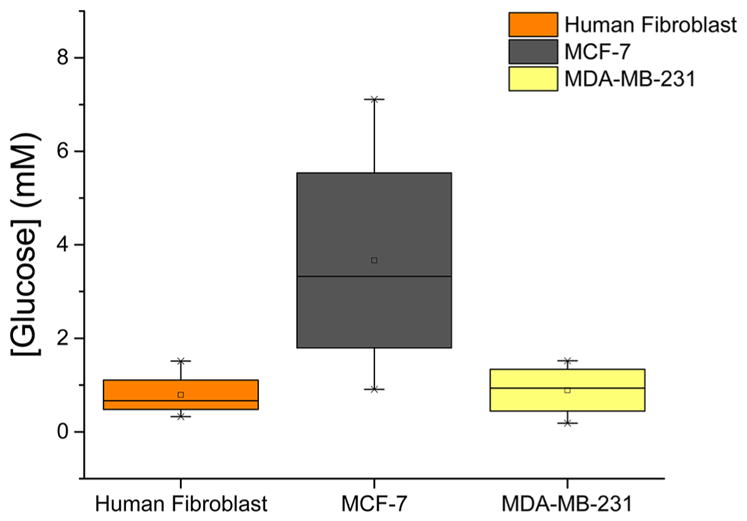
Box graph summarizing the average measured intracellular glucose levels of the cell lines interrogated in this work. Upper and lower bars represent the highest and the lowest glucose concentrations measured with glucose nanosensors. The boxes show the glucose intervals and the lines within the average glucose concentrations.
To evaluate intracellular free glucose levels in breast cancer cell lines, we applied the glucose nanosensors to MCF-7 and MDA-MB-231 cells. Intracellular glucose measurements performed on seven individual MCF-7 cells revealed an average glucose concentration of 2.69 (±1.47) mM (Figure 4). The increased glucose relative to the fibroblasts confirms the hypothesized increase in glucose uptake associated with cancer cell metabolism.37 Moreover, we found a wide range of glucose levels in MCF-7 cells, from 0.86 to 7.11 mM (Figure S6B). The average glucose level for MDA-MB-231 was estimated as 1.21 (±0.21) mM (Figure S6C). This significant difference in intracellular glucose concentrations between MCF-7 and MDA-MB-231 may be due to the differential expression of glucose transporter proteins. In a recent study, MCF-7 and MDA-MB-231 cells lines were compared for their glucose regulation mechanism by studying the expression of glucose transporters, finding that hormone responsive breast cancer cell lines, such as MCF-7, express the GLUT12 protein, whereas hormone independent lines, like MDA-MB-231, do not.4 The expression of this transporter could be contributing to elevated intra-cellular glucose concentrations. In addition to the glucose transporter, the energetic requirements of different cancer cell lines may have a part in this intracellular glucose variation.37 Highly invasive and metastatic cells have a fast metabolic rate; this allows glucose taken up by the cells to be quickly phosphorylated by hexokinases to supply necessary energy for proliferation.11
The glucose levels in both cancerous and noncancerous cells are dependent on the presence of glucose supply in the medium. To investigate how the intracellular free glucose stock changes, we exposed the cells to glucose-free media before the glucose nanosensors were inserted. Human fibroblasts that were incubated in glucose-free media showed low to no change in intracellular free glucose levels. These results suggest that the consumption of intracellular free glucose in human fibroblast is a slow metabolic activity; therefore, these cells do not need to maintain a large inner glucose stock. On the other hand, when the breast cancer cells were incubated in glucose-free media, the measured intracellular glucose levels were noticeably lower than the cells in glucose-containing media. The intracellular free glucose levels dropped 31.34% and 25.04% for MCF-7 and MDA-MB-231, respectively (Figure 5). These findings provide evidence for the active uptake of glucose into cancer cells. Cancer cells need a large glucose stock in order to keep their altered metabolic processes during an eventual extracellular glucose variation. Once glucose is depleted from the extracellular media, cancer cells use their internal glucose stock, which can be rapidly extinguished due to their high metabolism.
Figure 5.
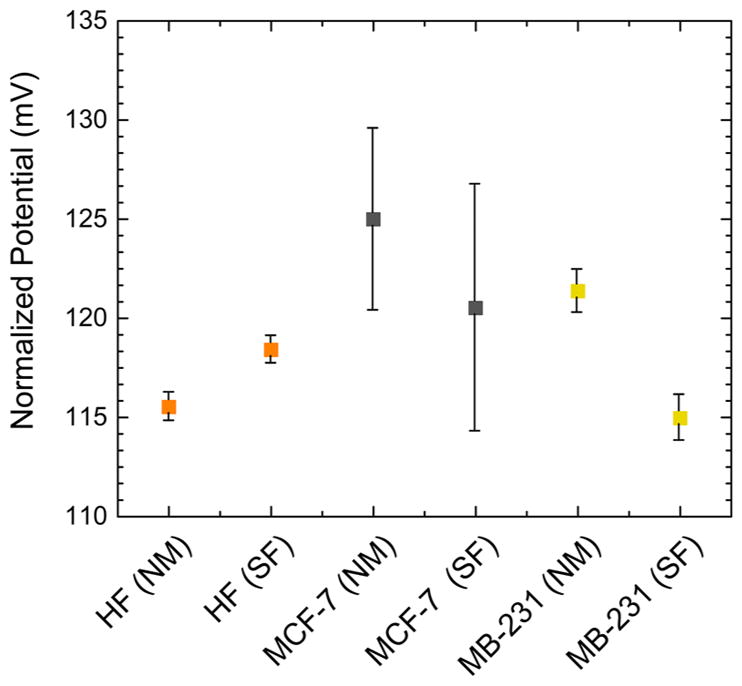
Comparison of intracellular glucose levels in human fibroblasts (F), MCF-7 and MDA-MB-231 cells in the glucose-rich (NM) and–free (SF) cell media. Different individual cells were analyzed to obtain average intracellular glucose. Error bars show the standard deviation for five replicate measurements.
In summary, we present GOx-functionalized nanopipettes as glucose nanosensors that provide the first measurements of intracellular free glucose at a single-cell level. The nanosensor measures low micromolar concentrations of glucose with a linear range of 0.1–8 mM and sensitivity values of 20.40 and 13.89 mV/mM for PBS and DMEM, respectively. Overall, our findings demonstrate that intracellular glucose levels are dependent on the cell type. The average intracellular concentration of free glucose for single human fibroblasts was found 0.63 (±0.44) mM, whereas the intracellular concentration of free glucose for single breast cancer MCF-7 cells was 2.69 (±1.47) mM and for MDA-MB-231 cells was between 1.21(±0.21) mM. Intracellular glucose levels in single metastatic human breast cancer cells were more than 2-fold greater than nonmalignant human cells. This observation is consistent with the greater need for glucose for metabolic activity of cancer cells for proliferation and tissue invasion and increased level of glucose transporters, such as GLUT1, GLUT2 and GLUT12 in cancer cells.
In conclusion, the glucose nanosensor technology provides a real time measure of metabolic activity in cells that can be used to study biology and transformation of single cancer cells in heterogeneous cell populations with temporal and spatial resolution. The surface chemistry developed for the immobilization of the enzyme on quartz surface, in this work, can be applied for the fabrication of a variety of enzymatic nanopipette-based nanobiosensor for single-cell metabolic analysis. Additionally, the use of nanopipettes as a sensing tool expands the limits of nanobioscience by allowing a tool to get in not only a single cell but also into subcellular entities, such as nucleus. This exciting level of resolution promises to illuminate the transformation of single cancer cells in heterogeneous cell populations and shows great promise for new levels of biological inquiry. Currently, efforts are being made to develop a fully automated surface finder and sensor platform to increase the single-cell analysis throughput up to 120 cells/hour. The utility of the glucose nanosensors reported here is not limited to cancer cells and can be expanded for the assessment of glucose metabolism in other specialized cells and conditions, for example, neurons in neurodegenerative states such as Parkinson’s and Alzheimer’s diseases.
Supplementary Material
Acknowledgments
This work was supported in part by grants from the National Institutes of Health [P01-35HG000205], National Institute of Neurological Disorders and Stroke [R21NS082927], and CAPES and CNPq Brazilian agencies. We acknowledge Dr. Tom Yuzvinsky for image acquisition and the W.M. Keck Center for Nanoscale Optofluidics for use of the FEI Quanta 3D Dualbeam microscope.
Footnotes
Notes
The authors declare no competing financial interest.
The Supporting Information is available free of charge on the ACS Publications website at DOI: 10.1021/acs.nano-lett.5b04495.
Experimental details on nanosensor fabrication. Additional sensor characterization experiments including applied current optimization, specificity, and selectivity. Details on intracellular measurements. (PDF)
References
- 1.Vander Heiden MG, Cantley LC, Thompson CB. Science. 2009;324:1029–1033. doi: 10.1126/science.1160809. [DOI] [PMC free article] [PubMed] [Google Scholar]
- 2.Gatenby RA, Gillies RJ. Nat Rev Cancer. 2004;4:891–899. doi: 10.1038/nrc1478. [DOI] [PubMed] [Google Scholar]
- 3.Elstrom RL, Bauer DE, Buzzai M, Karnauskas R, Harris MH, Plas DR, Zhuang H, Cinalli RM, Alavi A, Rudin CM, Thompson CB. Cancer Res. 2004;64:3892–3899. doi: 10.1158/0008-5472.CAN-03-2904. [DOI] [PubMed] [Google Scholar]
- 4.Macheda ML, Rogers S, Best JD. J Cell Physiol. 2005;202:654–662. doi: 10.1002/jcp.20166. [DOI] [PubMed] [Google Scholar]
- 5.Godoy A, Ulloa V, Rodríguez F, Reinicke K, Yañez AJ, García MdlA, Medina RA, Carrasco M, Barberis S, Castro T, Martínez F, Koch X, Vera JC, Poblete MT, Figueroa CD, Peruzzo B, Pérez F, Nualart F. J Cell Physiol. 2006;207:614–627. doi: 10.1002/jcp.20606. [DOI] [PubMed] [Google Scholar]
- 6.Onodera Y, Nam JM, Bissell MJ. J Clin Invest. 2014;124:367–384. doi: 10.1172/JCI63146. [DOI] [PMC free article] [PubMed] [Google Scholar]
- 7.Vaughn AE, Deshmukh M. Nat Cell Biol. 2008;10:1477–1483. doi: 10.1038/ncb1807. [DOI] [PMC free article] [PubMed] [Google Scholar]
- 8.Harris AL. Nat Rev Cancer. 2002;2:38–47. doi: 10.1038/nrc704. [DOI] [PubMed] [Google Scholar]
- 9.Cao X, Fang L, Gibbs S, Huang Y, Dai Z, Wen P, Zheng X, Sadee W, Sun D. Cancer Chemother Pharmacol. 2007;59:495–505. doi: 10.1007/s00280-006-0291-9. [DOI] [PubMed] [Google Scholar]
- 10.Noch E, Khalili K. Mol Cancer Ther. 2012;11:14–23. doi: 10.1158/1535-7163.MCT-11-0517. [DOI] [PMC free article] [PubMed] [Google Scholar]
- 11.Annibaldi A, Widmann C. Curr Opin Clin Nutr Metab Care. 2010;13:466–470. doi: 10.1097/MCO.0b013e32833a5577. [DOI] [PubMed] [Google Scholar]
- 12.Jansson PA, Fowelin J, Smith U, Lonnroth P. Am J Physiol. 1988;255:E218–E220. doi: 10.1152/ajpendo.1988.255.2.E218. [DOI] [PubMed] [Google Scholar]
- 13.Cline GW, Jucker BM, Trajanoski Z, Rennings AJM, Shulman GI. Am J Physiol. 1998;274:E381–E389. doi: 10.1152/ajpendo.1998.274.2.E381. [DOI] [PubMed] [Google Scholar]
- 14.Burt BM, Humm JL, Kooby DA, Squire OD, Mastorides S, Larson SM, Fong Y. Neoplasia (New York, NY) 2001;3:189–195. doi: 10.1038/sj.neo.7900147. [DOI] [PMC free article] [PubMed] [Google Scholar]
- 15.Behjousiar A, Kontoravdi C, Polizzi KM. PLoS One. 2012;7:e34512. doi: 10.1371/journal.pone.0034512. [DOI] [PMC free article] [PubMed] [Google Scholar]
- 16.Zhang L, Su F, Buizer S, Kong X, Lee F, Day K, Tian Y, Meldrum DR. Chem Commun. 2014;50:6920–6922. doi: 10.1039/c4cc01110d. [DOI] [PMC free article] [PubMed] [Google Scholar]
- 17.Lim CS, Chung C, Kim HM, An MJ, Tian YS, Chun HJ, Cho BR. Chem Commun. 2012;48:2122–2124. doi: 10.1039/c2cc16792a. [DOI] [PubMed] [Google Scholar]
- 18.Tian YS, Lee HY, Lim CS, Park J, Kim HM, Shin YN, Kim ES, Jeon HJ, Park SB, Cho BR. Angew Chem, Int Ed. 2009;48:8027–8031. doi: 10.1002/anie.200901175. [DOI] [PubMed] [Google Scholar]
- 19.Asif MH, Ali SMU, Nur O, Willander M, Brännmark C, Strålfors P, Englund UH, Elinder F, Danielsson B. Biosens Bioelectron. 2010;25:2205–2211. doi: 10.1016/j.bios.2010.02.025. [DOI] [PubMed] [Google Scholar]
- 20.Abercrombie M. J Clin Pathol. 1978;s3–12:1–6. [PMC free article] [PubMed] [Google Scholar]
- 21.Freitas RA. Nanomedicine, volume I: basic capabilities. Landes Bioscience; Georgetown, TX: 1999. [Google Scholar]
- 22.Ozel RE, Lohith A, Mak WH, Pourmand N. RSC Adv. 2015;5:52436–52443. doi: 10.1039/c5ra06721a. [DOI] [PMC free article] [PubMed] [Google Scholar]
- 23.Umehara S, Pourmand N, Webb CD, Davis RW, Yasuda K, Karhanek M. Nano Lett. 2006;6:2486–2492. doi: 10.1021/nl061681k. [DOI] [PMC free article] [PubMed] [Google Scholar]
- 24.Adam Seger R, Actis P, Penfold C, Maalouf M, Vilozny B, Pourmand N. Nanoscale. 2012;4:5843–5846. doi: 10.1039/c2nr31700a. [DOI] [PMC free article] [PubMed] [Google Scholar]
- 25.Actis P, Maalouf MM, Kim HJ, Lohith A, Vilozny B, Seger RA, Pourmand N. ACS Nano. 2014;8:546–553. doi: 10.1021/nn405097u. [DOI] [PMC free article] [PubMed] [Google Scholar]
- 26.Actis P, Rogers A, Nivala J, Vilozny B, Seger RA, Jejelowo O, Pourmand N. Biosens Bioelectron. 2011;26:4503–4507. doi: 10.1016/j.bios.2011.05.010. [DOI] [PMC free article] [PubMed] [Google Scholar]
- 27.Klenerman D, Korchev Y. Nanomedicine. 2006;1:107–114. doi: 10.2217/17435889.1.1.107. [DOI] [PubMed] [Google Scholar]
- 28.Ying L, Bruckbauer A, Zhou D, Gorelik J, Shevchuk A, Lab M, Korchev Y, Klenerman D. Phys Chem Chem Phys. 2005;7:2859–2866. doi: 10.1039/b506743j. [DOI] [PubMed] [Google Scholar]
- 29.Chen CC, Zhou Y, Baker LA. Annu Rev Anal Chem. 2012;5:207–228. doi: 10.1146/annurev-anchem-062011-143203. [DOI] [PubMed] [Google Scholar]
- 30.Karhanek M, Kemp JT, Pourmand N, Davis RW, Webb CD. Nano Lett. 2005;5:403–407. doi: 10.1021/nl0480464. [DOI] [PubMed] [Google Scholar]
- 31.Vilozny B, Actis P, Seger RA, Vallmajo-Martin Q, Pourmand N. Anal Chem. 2011;83:6121–6126. doi: 10.1021/ac201322v. [DOI] [PMC free article] [PubMed] [Google Scholar]
- 32.Wilson J, Hunt T. Molecular biology of the cell: the problems book. Garland Science; New York: 2007. [Google Scholar]
- 33.Guilbault G, Nanjo M. Anal Chim Acta. 1975;78:69–80. doi: 10.1016/S0003-2670(01)84753-X. [DOI] [PubMed] [Google Scholar]
- 34.Huggett ASG, Nixon D. Lancet. 1957;270:368–370. doi: 10.1016/s0140-6736(57)92595-3. [DOI] [PubMed] [Google Scholar]
- 35.Wang J. Electroanalysis. 2001;13:983. [Google Scholar]
- 36.German SR, Luo L, White HS, Mega TL. J Phys Chem C. 2013;117:703–711. [Google Scholar]
- 37.Hsu PP, Sabatini DM. Cell. 2008;134:703–707. doi: 10.1016/j.cell.2008.08.021. [DOI] [PubMed] [Google Scholar]
Associated Data
This section collects any data citations, data availability statements, or supplementary materials included in this article.


