

Abstract
Liver glycogen is important for the counterregulation of hypoglycemia and is reduced in individuals with type 1 diabetes (T1D). Here, we examined the effect of varying hepatic glycogen content on the counterregulatory response to low blood sugar in dogs. During the first 4 hours of each study, hepatic glycogen was increased by augmenting hepatic glucose uptake using hyperglycemia and a low-dose intraportal fructose infusion. After hepatic glycogen levels were increased, animals underwent a 2-hour control period with no fructose infusion followed by a 2-hour hyperinsulinemic/hypoglycemic clamp. Compared with control treatment, fructose infusion caused a large increase in liver glycogen that markedly elevated the response of epinephrine and glucagon to a given hypoglycemia and increased net hepatic glucose output (NHGO). Moreover, prior denervation of the liver abolished the improved counterregulatory responses that resulted from increased liver glycogen content. When hepatic glycogen content was lowered, glucagon and NHGO responses to insulin-induced hypoglycemia were reduced. We conclude that there is a liver-brain counterregulatory axis that is responsive to liver glycogen content. It remains to be determined whether the risk of iatrogenic hypoglycemia in T1D humans could be lessened by targeting metabolic pathway(s) associated with hepatic glycogen repletion.
Introduction
In the fasted state, healthy humans are able to maintain their blood glucose levels within a very narrow range of approximately 85 to 100 mg/dl. When the glucose level falls below this set point, the initial counterregulatory response is a reduction in insulin secretion (1). If this fails to stop the fall in glucose, a number of additional mechanisms are triggered. First, there is an increase in glucagon secretion (2, 3), which causes a rapid stimulation of hepatic glucose production (HGP) due to a mobilization of liver glycogen (4, 5). This is followed by increased adrenergic drive, which reduces muscle glucose uptake (6, 7) and at the same time increases the release of lactate and alanine from muscle, as well as glycerol and nonesterified fatty acid (NEFA) from fat, all of which promote hepatic gluconeogenesis (4, 8). Thus, glucagon and epinephrine are the primary drivers of the acute counterregulatory response to hypoglycemia, with increases in cortisol and growth hormone playing lesser roles (3, 9). In the event that the blood glucose level continues to fall, the release of these counterregulatory hormones increases in a dose-dependent manner (10).
Iatrogenic hypoglycemia continues to be the single most prominent barrier to the effective management of blood glucose in people with type 1 diabetes (T1D). In fact, it has been estimated that overinsulinization in people with T1D leads to approximately 2 symptomatic hypoglycemic episodes per week and an average of 1 severe hypoglycemic episode (requiring assistance) per year (11). In contrast with healthy individuals, patients with T1D are unable to regulate their circulating insulin levels, and their counterregulatory hormone (i.e., glucagon and epinephrine) and hepatic (i.e., HGP) responses to hypoglycemia are also diminished (6, 10, 12–14). It is of great importance, therefore, to develop strategies that might improve hypoglycemic counterregulation so as to limit the frequency, depth, and duration of hypoglycemia and the comorbidities associated with it.
Previous studies have shown that hepatic glycogen levels are low in people with T1D (15, 16) and that hepatic glycogen mobilization in response to insulin-induced hypoglycemia is markedly reduced (17). In both the healthy human and the dog, approximately 70% to 90% of the glucose produced by the liver during the initial 60 to 90 minutes of hypoglycemia is derived from liver glycogen (4, 18–20). The purpose of the current study, therefore, was to determine the impact of acute changes in hepatic glycogen content on net hepatic glucose output (NHGO) in response to insulin-induced hypoglycemia of approximately 50 mg/dl.
Results
The experimental design and a description of the groups studied can be found in Figure 1. Briefly, each animal underwent an experiment that consisted of a 4-hour glycogen-manipulation period, a 2-hour control period, and then a 2-hour hyperinsulinemic/hypoglycemic experimental period. At the conclusion of each study, hepatic biopsies were taken for the determination of liver glycogen.
Figure 1. Schematic representation of the study.

During the glycogen-manipulation period, most (see explanation below) animals underwent a hyperglycemic-pancreatic clamp where both insulin and glucagon were replaced at basal levels with an intraportal (Po) infusion of the hormones and glucose was clamped using a peripheral (Pe) infusion of dextrose. One group received an intraportal infusion of saline (Gly), and a second group received an intraportal infusion of fructose to increase liver glycogen content (Gly++). The glycogen-loading period (pd) was followed by a 2-hour control period where the respective infusions of either saline or fructose were discontinued and then a 2-hour hypoglycemic/hyperinsulinemic experimental period during which counterregulatory responses were assessed. The GlyMatch group did not have increased liver glycogen content, but glucagon and epinephrine were infused during the hypoglycemic period to match those seen in the Gly++ group. The role of hepatic afferent nerves in the increased counterregulatory hormone levels seen as a result of increased liver glycogen content was assessed in the Gly++DEN group. To determine the effect of a decrease in liver glycogen on hypoglycemic counterregulation, another group of animals received a variable intraportal glucagon infusion during the glycogen-manipulation period (Gly– –). Finally, to determine the role of fructose per se on the responses to insulin-induced hypoglycemia, the sugar was infused into either the carotid and vertebral arteries of the head (GlyHeadFru), or it was infused intraportally under euglycemic conditions (GlyPoFru).
Glycogen-manipulation period.
During the glycogen-manipulation period the arterial plasma glucose level was 2× basal in all but the GlyPoFru group (group receiving intraportal fructose infusion during euglycemia) (Figure 2A). The hepatic sinusoidal insulin level (Figure 2B), on the other hand, remained basal in all groups, as did hepatic blood flow (28 ± 1 ml/kg/min; individual data not shown). Glucagon remained basal (46 ± 2 pg/ml; individual data not shown) during the glycogen-manipulation period in all groups except the Gly– – group (group receiving extra intraportal glucagon). The infusion of fructose intraportally in the Gly++ and Gly++DEN groups (group receiving intraportal fructose and group receiving intraportal fructose after hepatic denervation, respectively) resulted in rates of net hepatic glucose uptake (NHGU) that were much greater than those seen in any of the Gly groups (P < 0.001; Figure 2C). As expected, liver glycogen content prior to the hypoglycemic period was much greater in the Gly++ and Gly++DEN groups (79 ± 5 and 80 ± 4 mg/g liver, respectively) than in the Gly group (group receiving intraportal saline) (45 ± 5 mg/g; Figure 2D; P < 0.01) or any other group. In the Gly– – group, liver glycogen content was lowered by infusing glucagon intraportally at a slowly increasing rate during the glycogen-manipulation period. This strategy resulted in elevated arterial glucagon concentrations that were 71 ± 7, 86 ± 7, 115 ± 10, and 137 ± 10 pg/ml over the 4 hours, respectively, elevated plasma glucose, and reduced liver glycogen, to 29 ± 1 mg/g liver by the outset of the hypoglycemic experimental period (Figure 2D; P < 0.01 compared with Gly).
Figure 2. Data from the glycogen-manipulation period.

Arterial plasma glucose (A), hepatic sinusoidal insulin (B), and NHGU (C) at the 4-hour time point of the 4-hour glycogen-loading period. (D) Resultant liver glycogen content at the beginning of the hypoglycemic/hyperinsulinemic experimental period. *P < 0.01, compared with Gly using repeated measures ANOVA.
Hypoglycemic period.
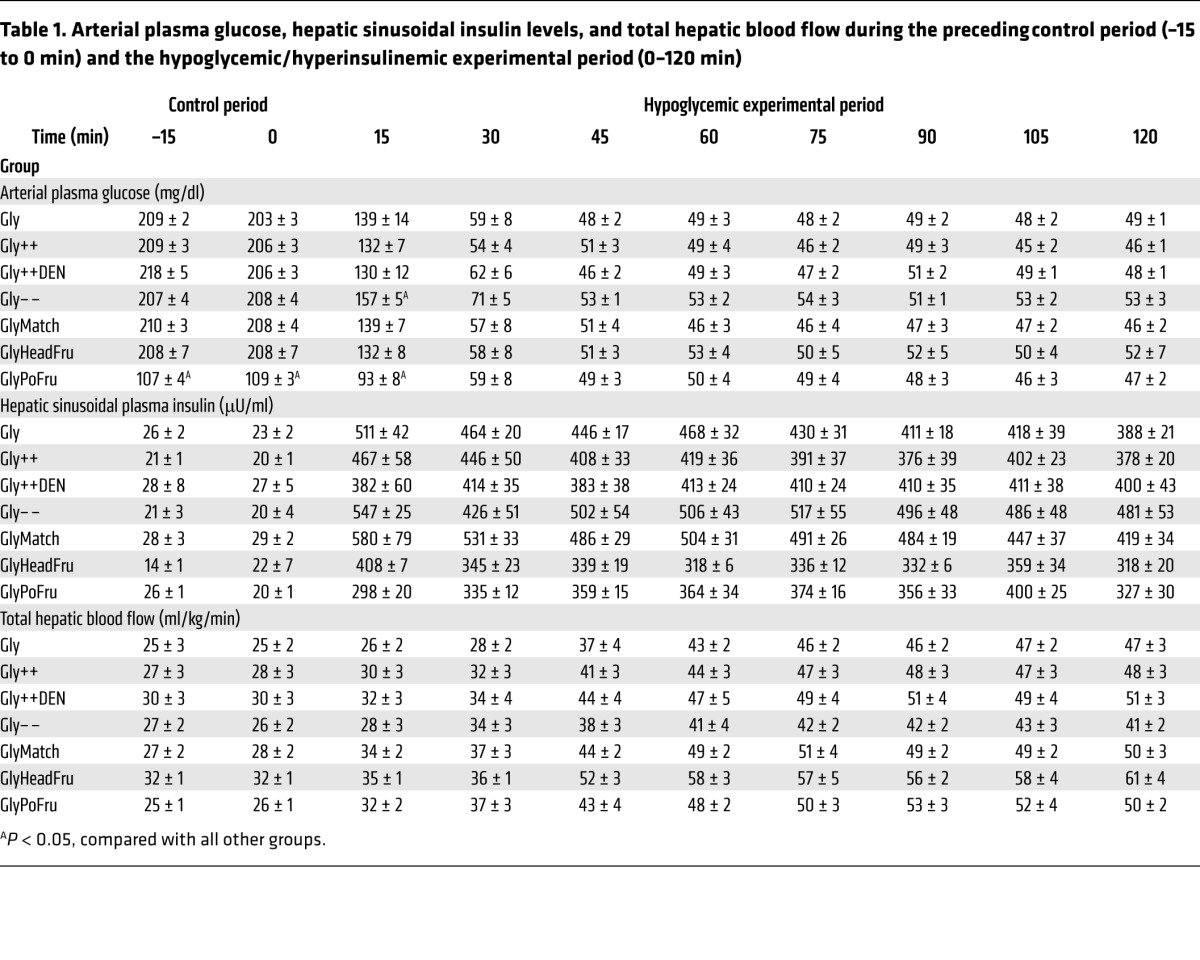
In response to the 16-fold increase in plasma insulin levels, the arterial plasma glucose level was allowed to fall to a similar value (~50 mg/dl) in each group (Table 1). Hypoglycemia caused hepatic blood flow to increase substantially in all groups (Table 1).
Table 1. Arterial plasma glucose, hepatic sinusoidal insulin levels, and total hepatic blood flow during the preceding control period (–15 to 0 min) and the hypoglycemic/hyperinsulinemic experimental period (0–120 min).
In response to hypoglycemia, NHGO was increased 2.3-fold more in the Gly++ than the Gly group (Figure 3A), reducing the amount of exogenous glucose required to maintain the plasma glucose at approximately 50 mg/dl (Figure 3D). The increase in NHGO in Gly++ relative to Gly was accounted for entirely by a stimulation of net hepatic glycogenolysis (Figure 3B), since net hepatic gluconeogenic flux was not different in the 2 groups (Figure 3C). Interestingly, while plasma glucagon, epinephrine, and norepinephrine levels increased in response to hypoglycemia in the Gly animals (Figure 4, B–D), there were markedly greater increases in the arterial levels of glucagon (3-fold) and epinephrine (2-fold) and a tendency (P < 0.10) for a larger increase in norepinephrine in the Gly++ group despite an identical hypoglycemic signal. The rise in plasma cortisol, on the other hand, was similar in both groups (Figure 4A) and was unaffected by liver glycogen content.
Figure 3. Hepatic glucose metabolism during the hypoglycemic period.

Net hepatic glucose balance (A), net hepatic glycogenolysis (GLY) (B), net hepatic gluconeogenesis (GNG) (C) and the peripheral glucose infusion rate required to maintain glycemia (D) prior to and during the 2-hour experimental period. To the right of each graph are the respective AUC values over the final 90 minutes of the hypoglycemic/hyperinsulinemic period. *P < 0.05, Gly++ compared with Gly; †P < 0.05, Gly– – compared with Gly; #P < 0.10, Gly– – compared with Gly, using repeated measures ANOVA.
Figure 4. Counterregulatory hormone responses during the hypoglycemic period.

Arterial plasma cortisol (A), epinephrine (B), norepinephrine (norepi) (C), and glucagon (D) responses during the 2-hour hypoglycemic/hyperinsulinemic experimental period. Histogram bars in the right column represent the ΔAUC from baseline (0 minute time point) data. *P < 0.05, compared with Gly; #P < 0.10, compared with Gly, using repeated measures ANOVA.
We next determined whether the increase in NHGO in Gly++ relative to Gly groups was solely a result of the enhanced counterregulatory hormone response. To address this question, we studied an additional group of animals (GlyMatch) in which the livers were not loaded (i.e., portal saline infusion) with glycogen (49 ± 4 mg/g liver; Figure 2D) but in which both glucagon and epinephrine (Table 2) were infused during the hypoglycemic period so as to match the counterregulatory hormone levels to those in the Gly++ group. This hormone-matching strategy increased NHGO to a rate that was 82% (using the AUC data during the final 90 minutes of the hypoglycemic period; Table 2) of that seen in the Gly++ group (Figure 3). Predictably, this increase in NHGO was accounted for by an increase in hepatic glycogenolysis (Table 2). These data suggest that it was the augmented counterregulatory hormone response in the Gly++ group that was responsible for the majority of the increase in NHGO, with the remainder possibly resulting from the increased glycogen mass per se.
Table 2. Counterregulatory hormone levels and hepatic glucose metabolism prior to and during the hyperinsulinemic/hypoglycemic experimental period in GlyMatch, GlyHeadFru, and GlyPoFru groups.

We next determined whether the signal for the increased counterregulatory hormone response required hepatic innervation. To accomplish this, we studied a group of animals in which the livers were loaded with glycogen as in the Gly++ group, but in which the neural connections between the brain and liver had been surgically severed several weeks earlier (Gly++DEN). Despite hepatic denervation (verified by average liver norepinephrine levels of 5 ± 3 ng/g liver in denervated dogs versus 658 ± 68 ng/g liver in nondenervated animals; ref. 21), NHGU during the glycogen-manipulation period was increased by fructose infusion (Figure 2C), leading to hepatic glycogen levels that were indistinguishable from those in the Gly++ group (79 ± 5 vs 80 ± 4 mg/g liver; Figure 2D). In this case, the counterregulatory hormone responses to insulin-induced hypoglycemia were similar to those that occurred in the Gly group rather than the Gly++ group (Figure 4). As expected, in the absence of the augmented counterregulatory hormone response, NHGO (Figure 3A) was similar in Gly and Gly++DEN groups, and as a result, the glucose infusion rate required to maintain hypoglycemia was also similar in the 2 groups (Figure 3D). Clearly, the decrease in hypoglycemia-driven NHGO caused by hepatic denervation resulted from a reduction in glycogenolysis (Figure 3B). These data indicate that a neural signal, generated in the liver in association with the increased liver glycogen content, must reach the brain, where it triggers an enhanced counterregulatory hormone response to hypoglycemia.
Given that humans with T1D exhibit approximately 25% lower liver glycogen content compared with normal individuals, we set out to determine whether lowering liver glycogen using an intraportal glucagon infusion during the initial 4-hour glycogen-manipulation period (Gly– –) would impair hypoglycemic counterregulation. While the reduction in liver glycogen content did not reduce the adrenergic (Figure 4, B and C) or cortisol (Figure 4A) responses to insulin-induced hypoglycemia, it almost completely abolished the response of glucagon (Figure 4D). In turn, this reduction in glucagon secretion relative to that which occurred in the Gly group was associated with a reduction in NHGO (Figure 3A) as a result of reduced glycogen mobilization (Figure 3B).
To determine whether exposure of the brain to fructose could explain the augmentation of the counterregulatory response to hypoglycemia, we studied another group of animals in which fructose was infused into the carotid and vertebral arteries during the glycogen-manipulation period (GlyHeadFru) at a rate designed to match the head fructose level to that seen in the Gly++ group. This would of course minimize the amount of fructose reaching the liver, thereby limiting hepatic glycogen deposition. Indeed, there was no detectable increase in NHGU (Figure 2C) during the glycogen-manipulation period, and liver glycogen did not increase (48 ± 5 mg/g; Figure 2D) in this group. As with the other groups, the glycogen-manipulation period was followed by a 2-hour control period during which fructose was not infused, allowing for the clearance of the sugar from the blood, and then by a 2-hour hyperinsulinemic/hypoglycemic period. As can be seen in Table 2, prior exposure of the brain to fructose did not result in an augmentation of the subsequent counterregulatory hormone response to hypoglycemia. Predictably, hepatic glucose metabolism in the GlyHeadFru group was similar to that in the Gly group (Table 2). Thus, elevating the fructose level in the brain for 4 hours at 2 hours prior to the hypoglycemic challenge was without effect on the counterregulatory response and cannot explain the elevations seen in the Gly++ group.
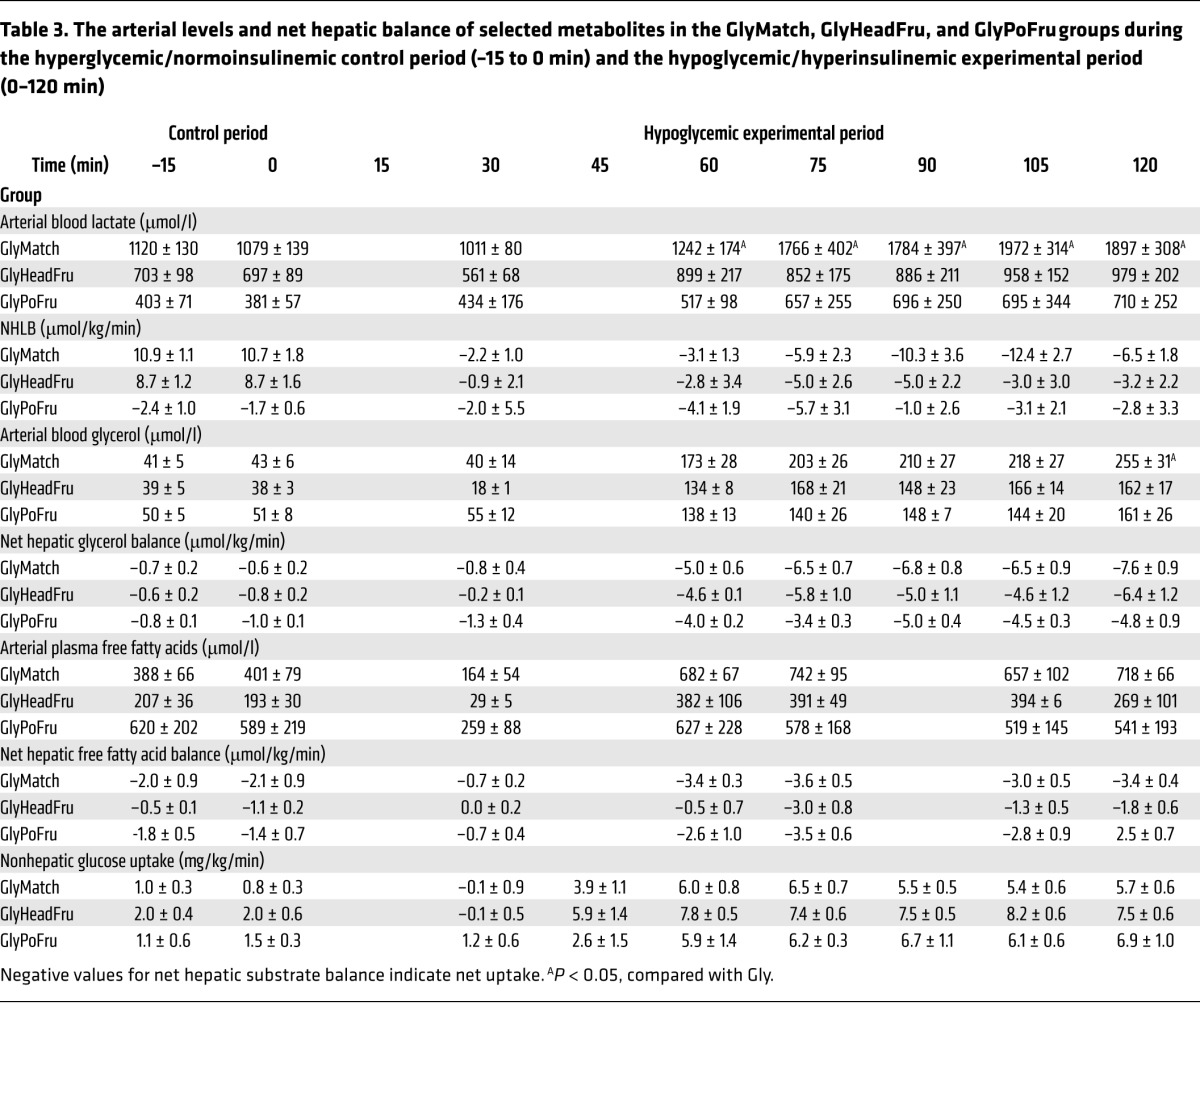
Finally, we performed experiments to determine whether the intraportal infusion of fructose (1.3 mg/kg/min) per se during the glycogen-manipulation period was responsible for the increased hormonal and hepatic responses to the hypoglycemic challenge. In these experiments (GlyPoFru), fructose was infused intraportally at 1.3 mg/kg/min, but glucose levels were not increased (Figure 2A) so as to deny the liver the substrate required for enhanced glycogen deposition. NHGU (Figure 2C) during the glycogen-manipulation period was similar in the Gly and GlyPoFru groups, as was hepatic glycogen (Figure 2D). Likewise, counterregulatory responses during the hypoglycemic experimental period were not elevated in the GlyPoFru group. These data indicate that increasing liver fructose levels during the glycogen-loading period, such as was done in the Gly++ group to increase liver glycogen, does not enhance the counterregulatory response to insulin-induced hypoglycemia (Tables 2 and 3).
Table 3. The arterial levels and net hepatic balance of selected metabolites in the GlyMatch, GlyHeadFru, and GlyPoFru groups during the hyperglycemic/normoinsulinemic control period (–15 to 0 min) and the hypoglycemic/hyperinsulinemic experimental period (0–120 min).
Fat and lactate metabolism.
The hyperinsulinemia used to bring about hypoglycemia had an initial suppressive effect on both arterial plasma free fatty acid and blood glycerol levels (Tables 3 and 4). This suppression, however, was short lived, as hypoglycemic counterregulation caused an increase in both parameters thereafter. By the end of the hypoglycemic period, the blood glycerol levels had increased 3- to 6-fold and were reasonably close to a steady state. Consequently, the rates of hepatic glycerol uptake can be assumed to be roughly equal to the rate of glycerol production, itself a reflection of adipose tissue lipolysis. Thus, lipolysis increased markedly (5- to 10-fold) in all groups, with no obvious difference between them. Plasma NEFA levels were close to or somewhat above baseline by the end of the hypoglycemic period, and net hepatic NEFA uptake was modestly increased (40%–100%). Based on a presumed steady state, this suggests that the production rate of NEFA was increased by no more than approximately 2-fold in any group, indicating that significant reesterification was occurring.
Table 4. The arterial levels and net hepatic balances of selected metabolites during the hyperglycemic/normoinsulinemic control period (-15 to 0 min) and the hypoglycemic/hyperinsulinemic experimental period (0–120 min).
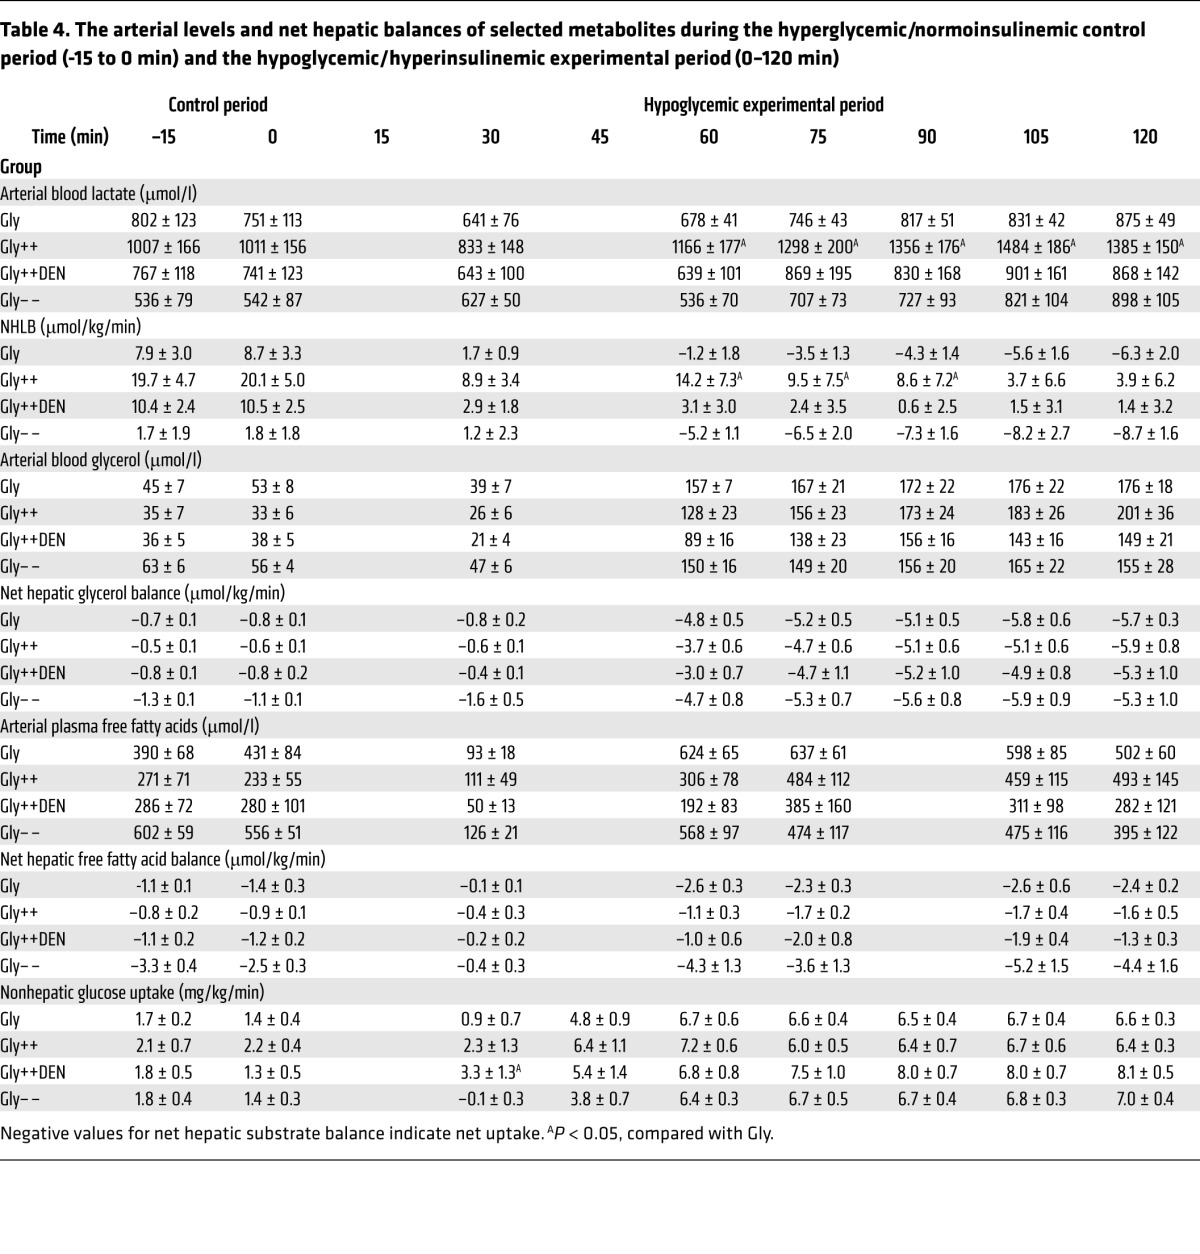
All groups, with the exception of the GlyPoFru group, exhibited net hepatic lactate output (NHLO) (Tables 3 and 4) during the control period, undoubtedly as a consequence of the prevailing hyperglycemia. Initially (30 minutes), the increase in insulin caused a marked reduction in NHLO in all groups. Thereafter, net hepatic lactate balance (NHLB) fell further in response to the rise in the blood lactate level, indicating that muscle was supplying lactate to the liver. All Gly groups eventually exhibited net hepatic lactate uptake that, in turn, provided carbon for gluconeogenesis. In the 2 Gly++ groups, the liver continued to produce lactate, albeit at a much reduced (80%) rate throughout the study. The blood lactate levels were twice as high in the Gly++ and GlyMatch groups, as opposed to the other groups, and were in line with the larger increments in epinephrine.
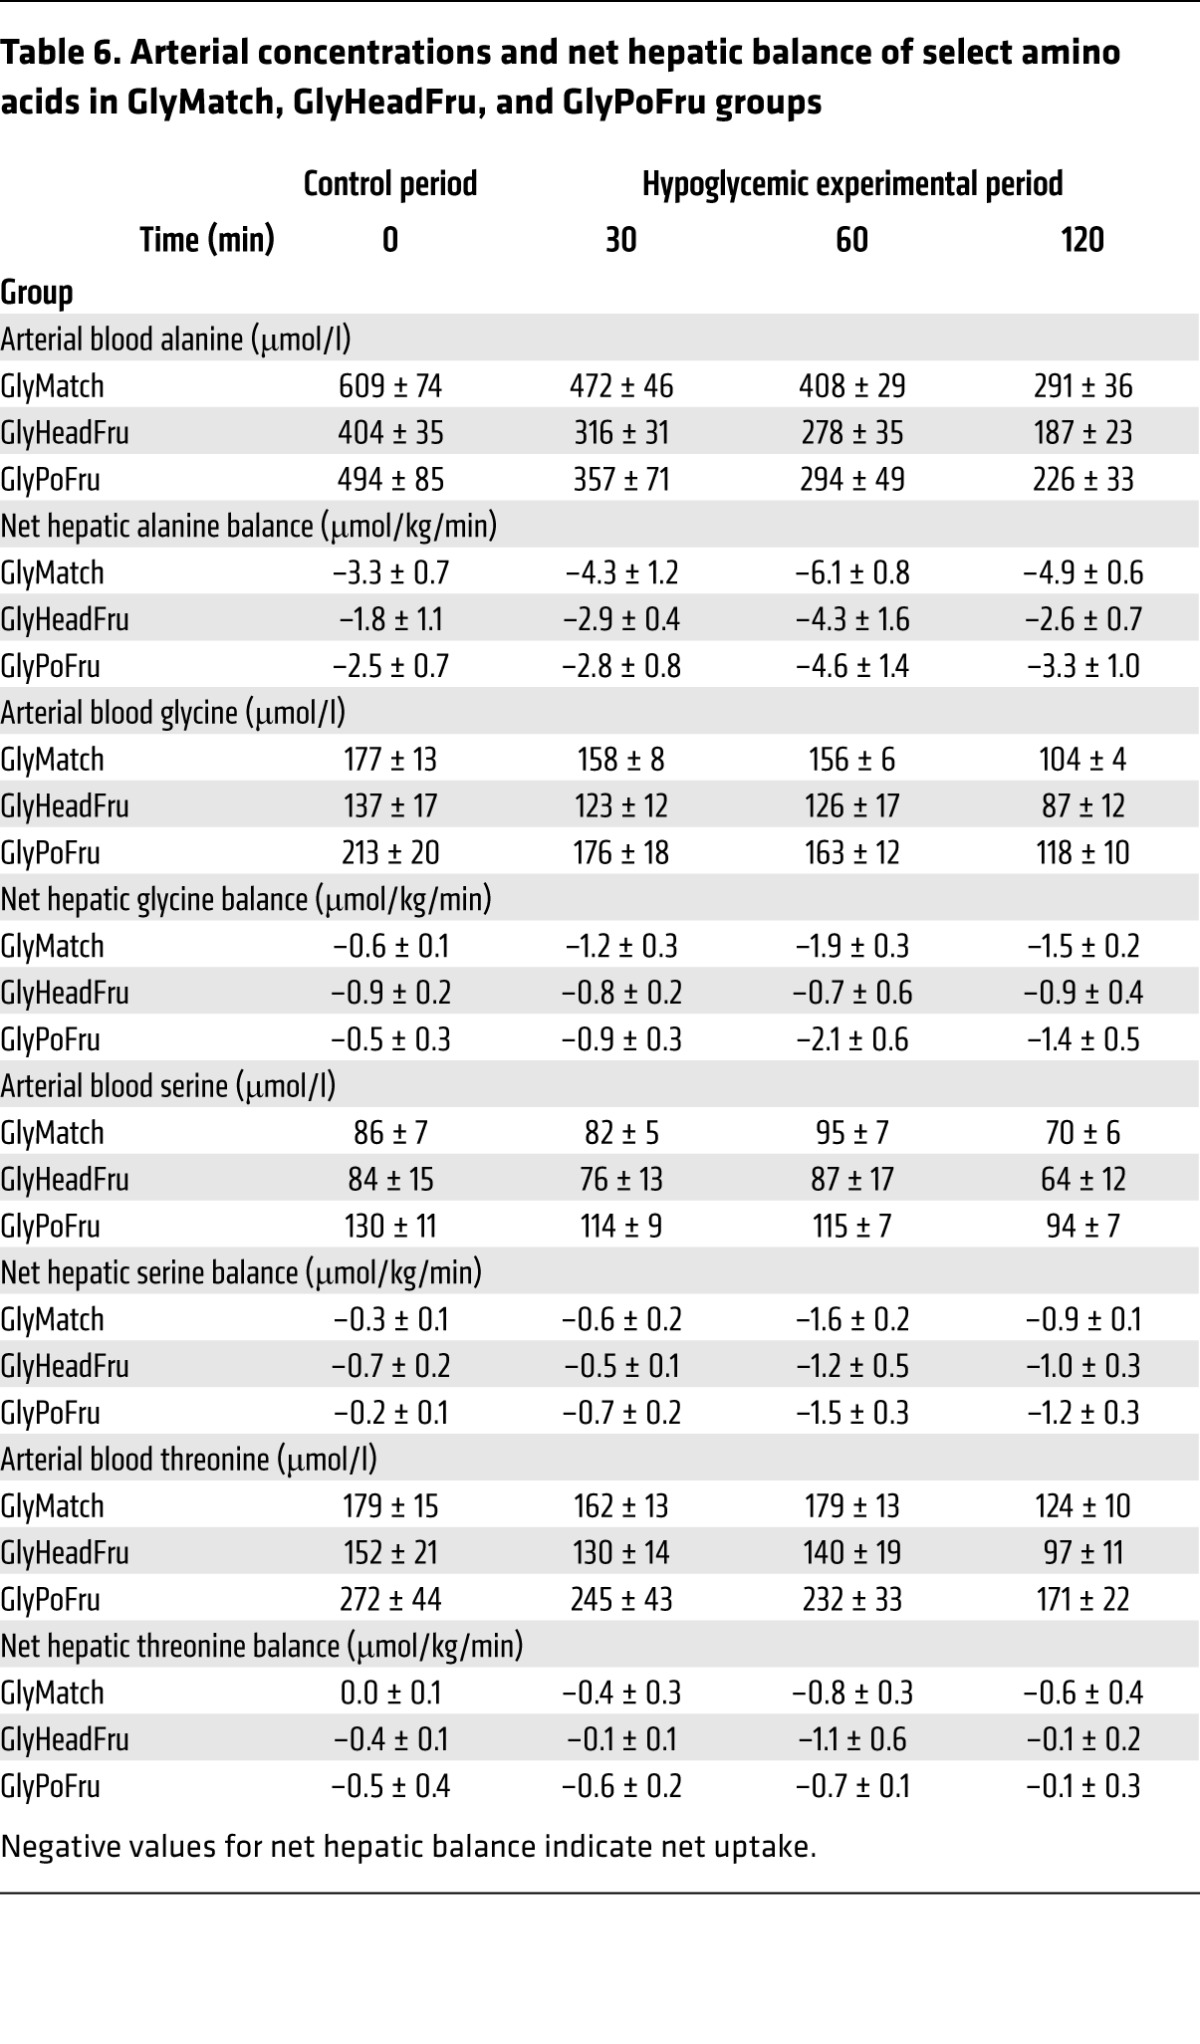
With the exception of the Gly– – group, blood gluconeogenic amino acid levels (Tables 5 and 6) were about 2-fold those of normal in the control period in all groups, which was reflective of the continued hyperglycemia following the glycogen-manipulation period. Net hepatic amino acid uptake was increased in all groups despite a fall in their levels in the blood, indicating an increase in the fractional extraction of gluconeogenic amino acids by the liver. In response to the insulin infusion, nonhepatic glucose uptake increased in all of the groups, even though the plasma glucose levels fell (Tables 3 and 4). In the Gly++ and Gly++DEN groups, the nonhepatic glucose uptake was 6.5 ± 0.4 vs 7.7 ± 0.7 mg/kg/min, respectively, with the difference probably attributable to increased epinephrine in the Gly++ group. Likewise, in the GlyMatch group, in which epinephrine was augmented, nonhepatic glucose uptake was only 5.8 ± 0.4 mg/kg/min.
Table 5. Arterial concentrations and net hepatic balances of select amino acids in Gly, Gly++, Gly++DEN, and Gly– – groups.
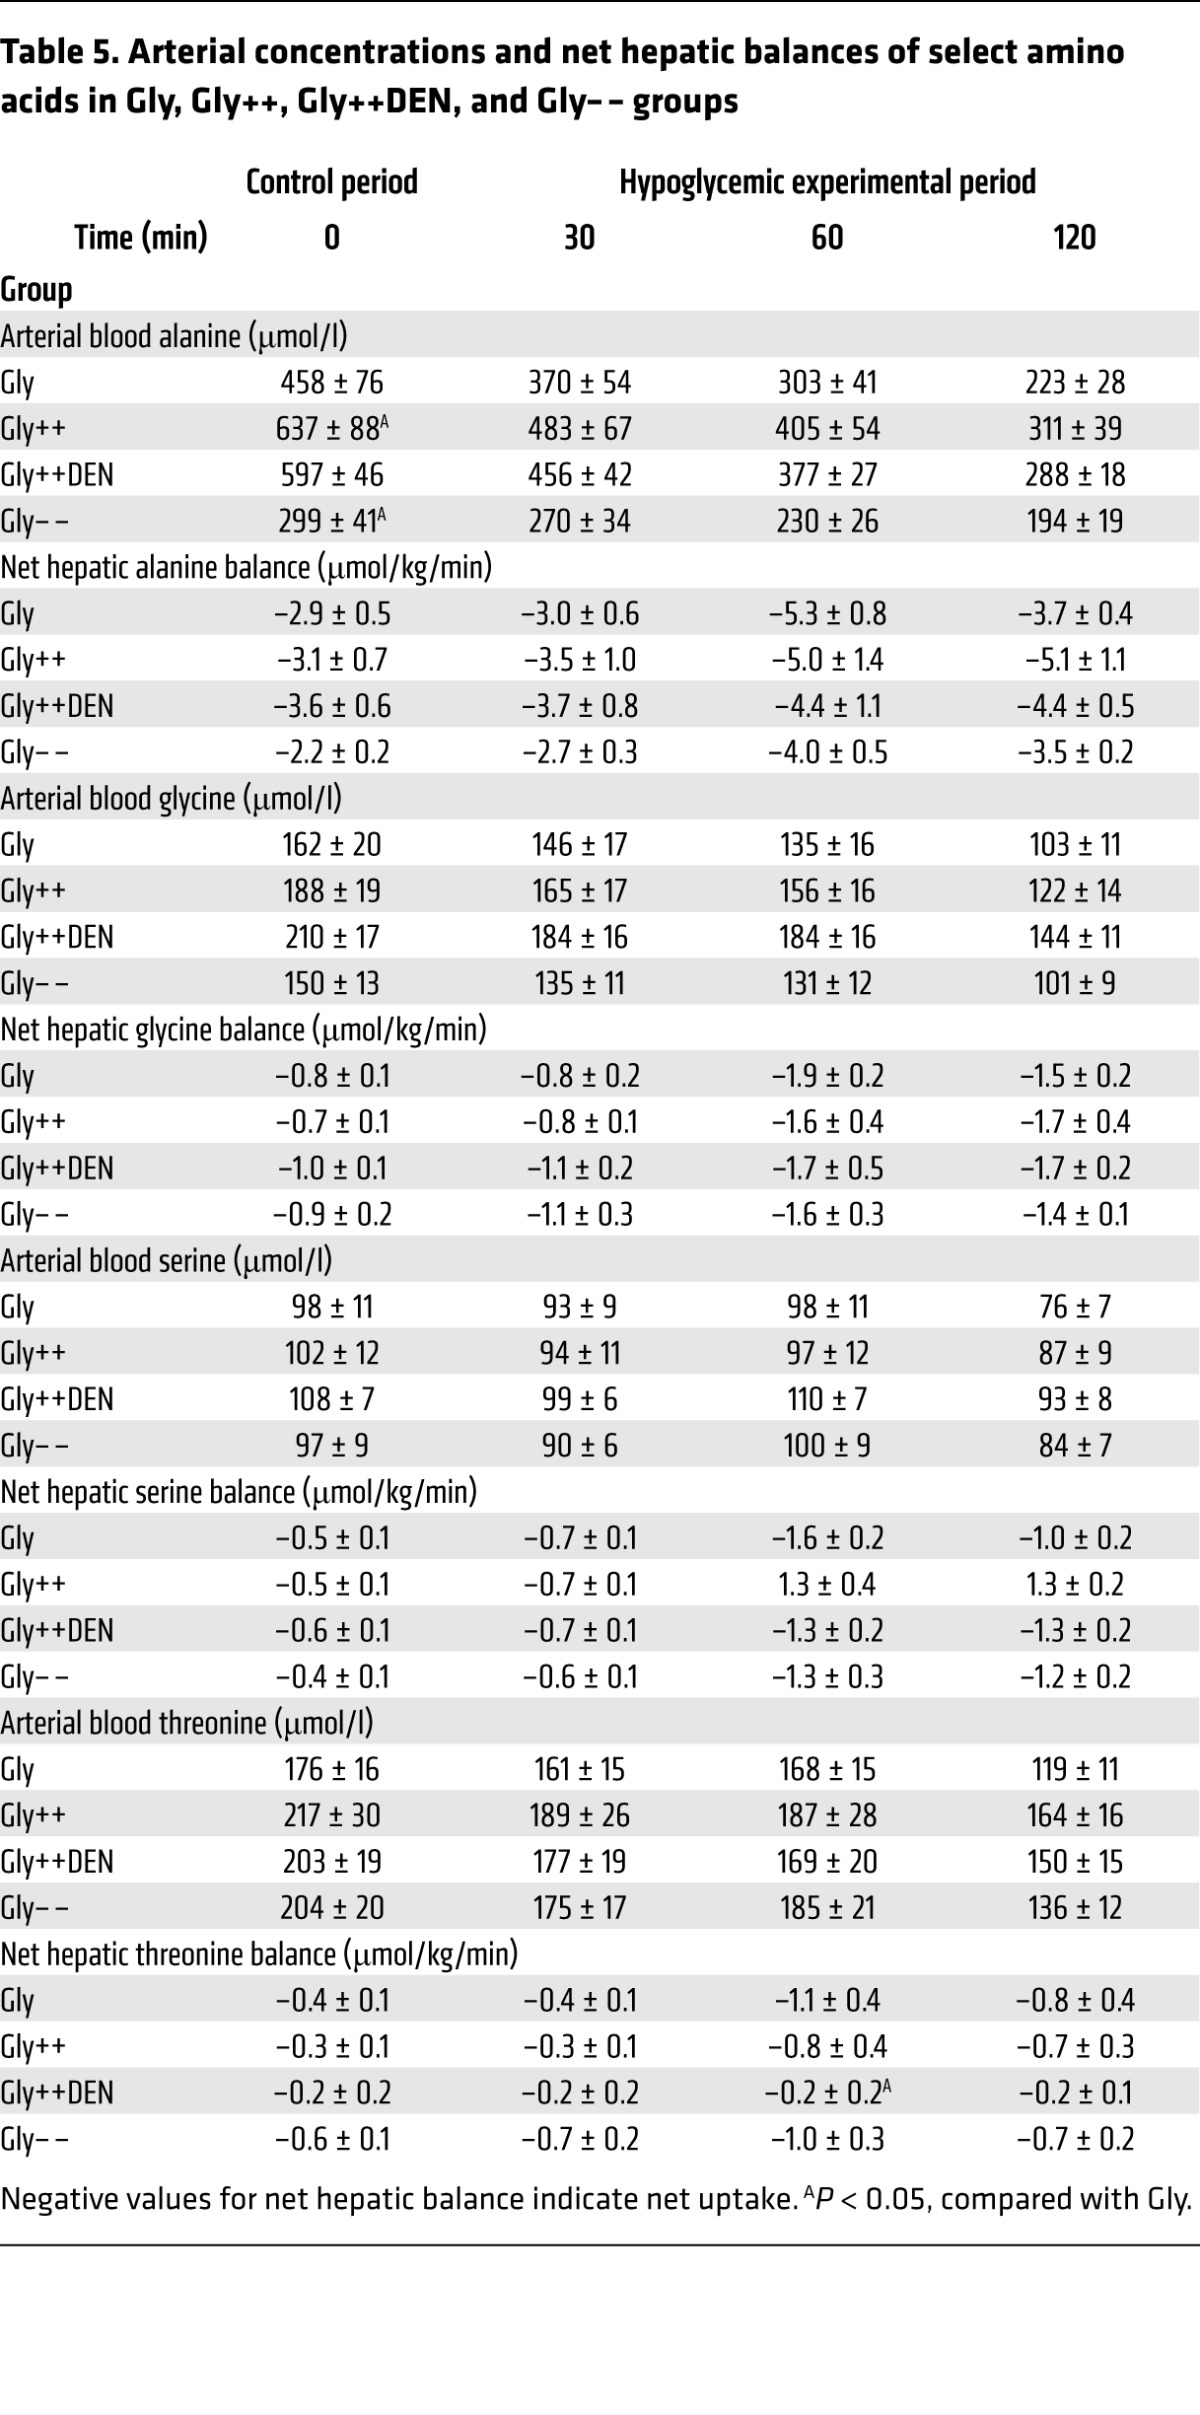
Table 6. Arterial concentrations and net hepatic balance of select amino acids in GlyMatch, GlyHeadFru, and GlyPoFru groups.
Discussion
Iatrogenic hypoglycemia continues to be the most prominent barrier to the effective treatment of T1D. In addition to not being able to acutely lower their circulating insulin levels, individuals with T1D also have markedly attenuated counterregulatory hormone responses to hypoglycemia (6, 10, 12–14, 17). This, in turn, reduces HGP and increases the depth, duration, and frequency of hypoglycemic episodes. People with T1D are also known to have low liver glycogen stores (15, 17), and their ability to mobilize hepatic glycogen during insulin-induced hypoglycemia is also diminished (17). Yet despite previous studies showing that increased liver glycogen content increases glycogenolysis in response to glucagon (22) and exercise (23), no studies have examined how variations in the size of the hepatic glycogen mass affect insulin-induced hypoglycemic counterregulation. This is all the more important since rapid mobilization of hepatic glycogen is critical to the initial response to a fall in blood sugar.
The present data indicate that increased liver glycogen content (i.e., 79 vs. 45 mg/g liver in Gly++ and Gly, respectively) results in an increase in NHGO in response to insulin-induced hypoglycemia. At the end of the 2-hour control period (i.e., immediately prior to the hypoglycemic period), when the glucose load to the liver was 2-fold that of basal and insulin and glucagon levels were clamped at basal values, there was a modest rate of NHGU in both the Gly and Gly++ groups. Then, in response to a 16-fold rise in insulin, the plasma glucose level was allowed to fall to approximately 50 mg/dl, and the livers of animals from the Gly group transitioned from an NHGU to an NHGO of approximately 1.8 mg/kg/min during the final hour of the 2-hour experimental period. Livers from the animals with excess glycogen (Gly++), on the other hand, responded to the same hypoglycemic challenge with a 2.3-fold (P < 0.01) greater rate of NHGO (4.3 mg/kg/min), an increment that was accounted for entirely by an increase in glycogenolysis. Likewise, when liver glycogen content was reduced by 35% in Gly– –, NHGO was lowered to approximately 1.3 mg/kg/min. As was the case in the Gly++ group, the change in NHGO was explained by a reduction in glycogenolysis.
While it is tempting to ascribe these variations in glycogenolysis directly to altered glycogen availability, we also observed an increase in epinephrine and glucagon levels in the Gly++ group compared with the Gly group and a nearly absent glucagon response in the Gly– – group. Because either stimulus (i.e., increased glycogen mass or altered counterregulatory hormones) could affect the rate of glycogen breakdown, it remained unclear from these experiments which was responsible for the altered glycogen metabolism. To answer this question, we studied another group of dogs (i.e., GlyMatch) in which fructose was not infused (so that the liver glycogen level would be similar to that in Gly), but in which glucagon and epinephrine were infused so as to match their levels to those seen in the Gly++ group. In these experiments, NHGO was similar to that in the Gly++ group, indicating that the elevated hormone secretion caused by excess hepatic glycogen accounted for the majority (82%) of the increase in NHGO during hypoglycemia, with the remainder possibly being accounted for by the presence of increased hepatic glycogen per se. As was the case in the Gly++ group, the increment in NHGO seen in the GlyMatch group was due to an increase in glycogenolysis; gluconeogenesis was elevated but remained unaffected by the hormone replacement. The preferential use of glycogen as the primary source of HGP in the 2-hour observation period of the current study is consistent with the importance of glycogenolysis to the initial response to hypoglycemia as reported previously (4).
We next considered the possibility that it was the transmission of an afferent signal from the liver to the brain that was responsible for the enhanced counterregulatory response. Remarkably, when a complete hepatic denervation was performed 2 weeks prior to study (Gly++DEN), the presence of excess hepatic glycogen was unable to augment the counterregulatory response. This was the case despite the fact that the hepatic glycogen levels were identical in the Gly++ and Gly++DEN groups (79 and 80 mg/g liver, respectively). These results demonstrate the presence of an axis of communication between the liver and the brain that can augment both glucagon and epinephrine secretion. Of note, altered neural feedback from the hepatoportal region to the brain has been previously shown to alter counterregulatory hormone secretion in the setting of hypoglycemia, albeit under very different experimental conditions. Elegant studies by Donovan and colleagues (24–27) showed that denervation of the mesenteric region in the rat can alter the counterregulatory responses to insulin-induced hypoglycemia. This effect was only observed, however, when the fall in plasma glucose was slow (i.e., ~0.5 mg/dl/min), whereas disruption of neural input was of no consequence when the fall of the plasma glucose level was rapid (~1.3 mg/dl/min). The fall in plasma glucose in our study was approximately 5.0 mg/dl/min, making it unlikely that this modulatory mechanism was active. Nevertheless, it remains unclear how the rate of fall of plasma glucose affects counterregulatory hormone secretion in the dog. Clearly, however, both our results and those of Donovan et al. show that the counterregulatory hormone response to hypoglycemia can be modified by signals from the splanchnic region.
The proximate cause of the hypoglycemia-induced increase in counterregulatory hormone secretion was most likely a change in AMPK activity in the ventromedial hypothalamus (VMH). Pioneering studies in the rat have established the important role that the VMH plays in hypoglycemic counterregulation (28–30). They have also shown that AMPK plays an important role in this “energy sensing” and that, when activated, it increases the secretion of both epinephrine and glucagon (31, 32). Of interest, there was no effect of AMPK activation in the VMH on corticosterone levels in the above studies (31, 32). This observation is consistent with the absence of a difference in cortisol secretion between any of the groups we studied. It also supports the hypothesis that corticosteroid release during hypoglycemia is regulated by a different mechanism than epinephrine and glucagon and probably does not involve the VMH (32).
The nature of the afferent signal that is associated with hepatic glycogen and increases the secretion of epinephrine and glucagon during hypoglycemia remains unclear. In response to our glycogen-manipulation protocol, we were able to increase hepatic glycogen content by 76% (45 and 79 mg glycogen/g liver in Gly and Gly++, respectively). It has been suggested that increased liver glycogen causes hepatocyte swelling, which may be capable of generating a hormonal response to relieve cellular stress (33, 34). Another potential mechanism involves hepatic AMPK activity. As noted above, previous studies have demonstrated that AMPK activation in the VMH is capable of generating a counterregulatory response to hypoglycemia (31, 32). We have shown that increased hepatic glycogen content is associated with an increase in hepatic AMPK phosphorylation at the Thr172 site (35, 36), an event that is most likely triggered by the enzyme becoming more susceptible to phosphorylation as a result of binding to intracellular glycogen (37). Future studies will be required to determine the event or events that trigger the afferent neural signal and the area or areas of the brain that coordinate altered hormone secretion.
To increase liver glycogen content, we infused fructose intraportally on the background of hyperglycemia and euinsulinemia as we have previously described (35, 36, 38). This was then followed by a 2-hour control period during which fructose was not infused and thereafter by a 2-hour hypoglycemic/hyperinsulinemic clamp. This design took into account the studies in humans by Gabriely et al. (39, 40), which showed that the infusion of fructose intravenously during insulin-induced hypoglycemia was associated with a modest increase in the responses of both glucagon (~30%) and epinephrine (~22%). This led those authors to suggest that this may have resulted from an acute effect of fructose on brain substrate metabolism. In our study, we wanted to avoid such an effect, so we discontinued the fructose infusion well before (2 hours) the start of the experimental period, thereby allowing the blood fructose level to return to baseline before the induction of hypoglycemia. To further explore the potential role of brain fructose in the counterregulatory response to hypoglycemia, we studied another group of animals in which we infused fructose into the carotid and vertebral arteries during the initial 4-hour glycogen-manipulation period at a rate that would match the plasma levels of fructose seen by the brain during the glycogen-manipulation period in the Gly++ group. In these animals, since fructose was not infused into the hepatic portal vein, the level of fructose reaching the liver was low (<15% of that in Gly++) and thus the increase in NHGU and hepatic glycogen deposition seen in the Gly++ group did not occur. Despite the exposure of the CNS to elevated plasma fructose for 4 hours, there was no detectable enhancement relative to the Gly group of the counterregulatory hormone or hepatic responses to the hypoglycemic challenge. Thus, we can rule out the possibility that prior exposure of the brain to fructose led to the increase in counterregulatory hormone secretion that we saw in the Gly++ group during insulin-induced hypoglycemia.
The next question became whether fructose in the liver, per se, could be triggering the response. First, it should be noted that we used a small, catalytic infusion of fructose (<10% of total calories infused during the glycogen-manipulation period) as opposed to a large amount that would be more likely to have lingering effects on hepatic glucose metabolism after being withdrawn. In earlier studies (36, 41), using the same catalytic dose, we showed that the sugar had no effect on the mRNA or protein levels of key metabolic enzymes 4 hours after its infusion had ceased. Furthermore, it had no effect on hepatic AMP or ATP levels at that time. In line with this, Parks et al. (42) showed in humans that, when a meal made of 50% fructose was served for breakfast, it did not affect de novo lipogenesis in the liver 4.5 hours later. Finally, although consumption of large amounts of fructose has been reported to increase corticosterone levels and gluconeogenesis in rodents (43), we did not observe a difference in either cortisol or gluconeogenesis between animals that did or did not receive fructose. Nevertheless, to confirm that prior exposure of the liver to increased levels of fructose (i.e., 1.3 mg/kg/min) per se does not increase the counterregulatory response to insulin-induced hypoglycemia, we infused fructose on a background of euglycemia in the GlyPoFru group. In this way, the livers of these animals received similar exposure to fructose during the glycogen-manipulation period, but there was no increase in liver glycogen content above that in the Gly group because of the absence of hyperglycemia. These animals did not display any augmentation in their counterregulatory responses to hypoglycemia, thereby further supporting our conclusion that it was the increase in liver glycogen content that caused augmented counterregulation in the Gly++ group, not prior exposure of the liver to fructose.
This brings up the issue of whether our finding that liver glycogen can be a determinant of hypoglycemic counterregulation has clinical relevance. Our data raise the possibility that the reduction in liver glycogen seen in T1D patients might contribute to their impaired counterregulatory responses. If this is the case, then it is possible that the incidence of hypoglycemia could be reduced in patients with T1D by restoring the normal circadian rhythm of liver glycogen accretion and utilization. If so, it becomes important to develop new means by which liver glycogen deposition can be increased over the course of the day in such patients.
In summary, our results show that varying levels of liver glycogen can have a marked impact on glycogen mobilization and NHGO seen in response to insulin-induced hypoglycemia. Even more interesting, however, is that this effect is mediated primarily by adjustments in glucagon and epinephrine secretion that require liver innervation. Identification of the cellular mechanism that regulates this liver-brain counterregulatory axis now deserves attention. Future studies will be required to determine whether enhancing liver glycogen deposition lessens the risk of iatrogenic hypoglycemia in patients with T1D.
Methods
Animals and surgical procedures.
Studies were carried out on healthy, conscious 18-hour–fasted mongrel dogs of either sex with a mean weight of 21.9 ± 2.7 kg (mean ± SD). All animals were maintained on a diet of meat and chow (34% protein, 14.5% fat, 46% carbohydrate, and 5.5% fiber based on dry weight; ~1700 kcal/d).
Two weeks prior to being studied, each dog underwent general anesthesia and a laparotomy to permit placement of catheters for intraportal infusion of hormones and substrates and for blood sampling across the liver (44). At the same time, ultrasonic flow probes (Transonic Systems) were placed around the hepatic portal vein and the hepatic artery as described elsewhere (44).
Two days before each experiment, blood was drawn to determine the leukocyte count and hematocrit for each animal. Animals were only studied if they had a leukocyte count of less than 16,000/mm3, a hematocrit count of more than 35%, a good appetite (as evidenced by consumption of the entire daily ration), and normal stools.
On the morning of each experiment, catheters and flow probe leads were exteriorized from subcutaneous pockets under local anesthesia (2% lidocaine, Hospira). Angiocatheters (Deseret Medical, BD) were inserted into a cephalic and a saphenous vein to allow infusion into the peripheral vasculature as desired. The animals stood comfortably in a Pavlov harness throughout the experiment.
Experimental design.
Each experiment consisted of a 4-hour liver glycogen-manipulation period (–360 to –120 min), a 2-hour control period (–120 to 0 min; Figure 1) and a 2-hour hypoglycemic experimental period (0 to 120 min). Each experiment was initiated at minute –360 by the infusion of somatostatin (SRIF) (0.8 μg/kg/min; Bachem) into a peripheral vein to disable the endocrine pancreas. This was accompanied by the intraportal replacement of both insulin (0.3 mU/kg/min; Eli Lilly & Co.) and glucagon (0.55 ng/kg/min; Glucagen, Novo Nordisk) at basal rates (except in the Gly– – group). At the same time, the hepatic glucose load was doubled (with the exception of the GlyPoFru group) by infusing a 50% dextrose solution into a peripheral vein as needed and either 0.9% saline (Gly; n = 7) or fructose (1.3 mg/kg/min; Gly++; n = 7) concomitantly into the hepatic portal vein. The latter causes the translocation of glucokinase (GK) in hepatocytes from the nucleus to the cytosol (where glucose phosphorylation occurs), thereby stimulating NHGU and glycogen deposition even in the absence of a rise in plasma insulin (36, 38, 41). Thus, by the start of the experimental period (i.e., at min 0), the hepatic glycogen content was either modestly (Gly group) or markedly (Gly++ group) elevated relative to the level seen after an 18-hour fast in the dog (~36 mg/g liver; ref. 45). The 4-hour glycogen-manipulation period was followed by a 2-hour hyperglycemic control period during which fructose was not infused, thereby allowing blood fructose concentrations and hepatic glucose metabolism in the Gly++ group to return to values similar to those in the Gly group. During this control period, the basal hormone levels were maintained. At the outset of the final 2-hour experimental period (0–120 min), the SRIF infusion was discontinued, as was the intraportal infusion of glucagon. At the same time, hypoglycemia (~50 mg/dl) was allowed to occur in response to an intraportal infusion of insulin (5.0 mU/kg/min; ~16-fold basal). In all groups, 50% dextrose was infused peripherally to clamp the plasma glucose level at approximately 50 mg/dl and to control the rate of fall in glucose such that it was equal in all groups. Animals in the Gly and Gly++ groups each underwent 2 experiments in a randomized fashion; one under Gly conditions and one under Gly++ conditions. At the conclusion of each animal’s first experiment, their infusion and sampling catheters were replaced in a subcutaneous pouch so that the animals could undergo the second experiment 2 weeks later.
To determine the importance of the increased counterregulatory hormone secretion seen in the Gly++ group to the increase in NHGO, a third group of animals was studied in which liver glycogen was not increased (i.e., they received saline rather than fructose infusion during the initial 4-hour glycogen-manipulation period), but in which the endogenous counterregulatory hormone responses were supplemented with exogenous hormone infusions in order to match the levels seen in the Gly++ group (GlyMatch; n = 6). Thus, in this group (GlyMatch), when the SRIF infusion was discontinued at the start of the 2-hour hypoglycemic period, glucagon was infused intraportally and epinephrine was infused peripherally at the rates required to match the plasma levels of these hormones to those that occurred in the Gly++ group.
To determine the importance of neural communication between the liver and the brain to the increased counterregulatory response seen in the Gly++ group relative to the Gly group, we studied a group of animals with livers that were completely denervated during the surgery for catheter placement (Gly++DEN; n = 6). On the day of study, the animals from this group underwent the same experiment as did the Gly++ animals.
Given that humans with T1D exhibit approximately 25% lower fasting liver glycogen content compared with non-T1D individuals, it was important to establish whether acutely lowering liver glycogen content would impair hypoglycemic counterregulation (Gly– –; n = 9). To lower the liver glycogen content, we used a protocol identical to that used with the Gly group, with the exception that glucagon was infused intraportally at a progressively increasing rate (3×, 5×, 7×, and 8× basal each hour over the 4-hour glycogen-manipulation period) to mobilize liver glycogen and keep the glucose level at approximately 200 mg/dl. This strategy, which lowered liver glycogen and created a hyperglycemic signal indistinguishable from that present in the other groups, was preferable to lowering glycogen using a prolonged fast given the changes in glucose metabolism (e.g., lower basal HGP and insulin levels, etc.) that accompany fasting, which would have complicated data interpretation. After the 4-hour glucagon infusion period, the hormone’s infusion rate was returned to a basal rate for the control period, after which it was turned off completely as in the other groups.
In order to ensure that there was no effect of the prior fructose infusion on hypoglycemic sensing by the brain during the hypoglycemic period, we studied an additional group of animals (GlyHeadFruc; n = 4) in which fructose was infused into both the carotid and vertebral arteries during the glycogen-manipulation period (rather than the hepatic portal vein) at a rate (0.16 mg/kg/min) that would bring about a fructose concentration in the head arteries similar to that seen in the Gly++ group. Because fructose was infused directly into the head instead of the hepatic portal vein, it could be infused at a much lower rate than was used in the Gly++ group (1.3 mg/kg/min), where it was infused directly into the liver. As a result, the brain was exposed to a similar elevated blood fructose level in the Gly++ and GlyHeadFruc groups, but with only a small rise in fructose levels at the liver (i.e., ~15% of that in Gly++), which failed to increase NHGU. In another group (GlyPoFruc; n = 3), fructose was infused intraportally during the glycogen-manipulation period at a rate identical to that in the Gly++ group (1.3 mg/kg/min), but on the background of euglycemia. In this way, the liver was exposed to an identical amount of fructose as in the Gly++ group, but in the absence of the hyperglycemia so that liver glucose uptake and glycogen resembled those in the Gly group, not the Gly++ group. At the conclusion of each study, the animal was euthanized with an overdose of pentobarbital, the abdomen was opened, and the positions of the catheter tips were verified. Liver biopsies were immediately freeze clamped and stored at –80°C for the determination of glycogen content.
Processing and analysis of samples.
The processing of blood samples has been described previously (46). Plasma glucose was analyzed using the glucose oxidase method (Analox Instruments). Insulin, glucagon, cortisol, catecholamines, amino acids, lactate, glycerol, and NEFA concentrations were measured as previously described (47, 48). Liver samples were pulverized under liquid nitrogen and assayed for liver glycogen as described previously (49).
Calculations and data analysis.
Hepatic blood flow was measured using ultrasonic flow probes (Transonic Systems). Because of our study design (a 4-hour period of hepatic glycogen manipulation), we were unable to use 3-3H glucose to measure whole body glucose turnover; instead we assessed net hepatic glucose balance (NHGB) as described previously (50). Net hepatic gluconeogenesis and glycogenolysis were calculated as previously described (35) and liver glycogen content just prior to the hypoglycemic experimental period was calculated as the postexperimental glycogen content (which was measured via biopsy) plus the amount of glycogen mobilized during the experimental period. The sinusoidal insulin and glucagon levels were calculated as described previously (50), and plasma glucose levels were converted to whole blood values for the calculation of NHGB (51, 52). Nonhepatic glucose uptake was calculated as the sum of NHGB and the exogenous glucose infusion rate after correcting for the change in the glucose mass (53).
Statistics.
All data are presented as mean ± SEM, and statistical analyses were performed using SigmaStat (Aspire Software International) software. Data were analyzed using repeated measures ANOVA. Post-hoc comparisons were made as appropriate, and statistical significance was defined as P < 0.05.
Study approval.
The animals were housed in a facility that met American Association for Accreditation of Laboratory Animal Care guidelines, and the study was approved by Vanderbilt University’s Institutional Animal Care and Use Committee.
Author contributions
JJW performed all of the experiments and collected all of the data. GK, JMG, DSE, PW, MZK, M Smith, M Scott, BF, and DN assisted with data collection. PW, BF, DN, and M Smith performed all of the surgeries. IAH, EA, and EPD performed the hormone and substrate analyses under the supervision of DSE. ADC obtained funding for these studies. JJW and ADC analyzed all of the data and wrote the manuscript. All authors provided feedback during the writing of the manuscript.
Acknowledgments
The authors wish to thank Margaret Lautz, Jon Hastings, and Patsy Raymer for their assistance in these studies. Portions of the data were presented at the 2012 American Diabetes Association Conference (Philadelphia, Pennsylvania, USA) and the 2012 (Berlin, Germany) and 2013 (Barcelona, Spain) European Association for the Study of Diabetes Conferences. This work was funded by National Institute of Diabetes and Digestive and Kidney Diseases (NIDDK) grant RO1-DK-18243. Hormone analysis was performed by Vanderbilt’s Hormone Assay and Analytical Services Core, and surgical and experimental expertise were provided by Vanderbilt’s Large Animal Core, both of which are supported by the Vanderbilt Diabetes Research and Training Center (DK-20593). J.J. Winnick was supported by a NIDDK career development award (K01-DK-093799), and J.M. Gregory was supported by a NIDDK fellowship (F32-DK-100114-01A1). Alan Cherrington is the Jacquelyn A. Turner and Dr. Dorothy J. Turner Chair in Diabetes Research.
Footnotes
Conflict of interest: A.D. Cherrington receives income from Biocon and Fractyl; receives research support from Eli Lilly and Co., Merck, Metavention, and Novo Nordisk; and has equity in Fractyl, Metavention, Sensulin, Thetis Pharmaceuticals, and Zafgen.
Reference information:J Clin Invest. 2016;126(6):2236–2248. doi:10.1172/JCI79895.
Contributor Information
Jason J. Winnick, Email: jason.winnick@vanderbilt.edu.
Guillaume Kraft, Email: guillaume.kraft@vanderbilt.edu.
Justin M. Gregory, Email: justin.m.gregory.1@vanderbilt.edu.
Dale S. Edgerton, Email: dale.edgerton@vanderbilt.edu.
Marta Smith, Email: marta.smith@vanderbilt.edu.
Ben Farmer, Email: ben.farmer@vanderbilt.edu.
Doss Neal, Email: dosswneal@gmail.com.
Eric Allen, Email: eric.allen@vanderbilt.edu.
References
- 1.Boyle PJ, Shah SD, Cryer PE. Insulin, glucagon, and catecholamines in prevention of hypoglycemia during fasting. Am J Physiol. 1989;256(5 pt 1):E651–E661. doi: 10.1152/ajpendo.1989.256.5.E651. [DOI] [PubMed] [Google Scholar]
- 2.Flattem N, Igawa K, Shiota M, Emshwiller MG, Neal DW, Cherrington AD. α- and β-cell responses to small changes in plasma glucose in the conscious dog. Diabetes. 2001;50(2):367–375. doi: 10.2337/diabetes.50.2.367. [DOI] [PubMed] [Google Scholar]
- 3.Gerich J, et al. Hormonal mechanisms of recovery from insulin-induced hypoglycemia in man. Am J Physiol. 1979;236(4):E380–385. doi: 10.1152/ajpendo.1979.236.4.E380. [DOI] [PubMed] [Google Scholar]
- 4.Frizzell RT, et al. Role of gluconeogenesis in sustaining glucose production during hypoglycemia caused by continuous insulin infusion in conscious dogs. Diabetes. 1988;37(6):749–759. doi: 10.2337/diab.37.6.749. [DOI] [PubMed] [Google Scholar]
- 5.Rivera N, et al. Insulin-induced hypoglycemia increases hepatic sensitivity to glucagon in dogs. J Clin Invest. 2010;120(12):4425–4435. doi: 10.1172/JCI40919. [DOI] [PMC free article] [PubMed] [Google Scholar]
- 6.Enoksson S, Caprio SK, Rife F, Shulman GI, Tamborlane WV, Sherwin RS. Defective activation of skeletal muscle and adipose tissue lipolysis in type 1 diabetes mellitus during hypoglycemia. J Clin Endocrinol Metab. 2003;88(4):1503–1511. doi: 10.1210/jc.2002-021013. [DOI] [PubMed] [Google Scholar]
- 7.Bolli GB, Gottesman IS, Cryer PE, Gerich JE. Glucose counterregulation during prolonged hypoglycemia in normal humans. Am J Physiol. 1984;247(2 pt 1):E206–E214. doi: 10.1152/ajpendo.1984.247.2.E206. [DOI] [PubMed] [Google Scholar]
- 8.Davis SN, Dobbins R, Tarumi C, Jacobs J, Neal D, Cherrington AD. Paradoxical insulin-induced increase in gluconeogenesis in response to prolonged hypoglycemia in conscious dogs. Am J Physiol. 1995;268(3 pt 1):E521–E530. doi: 10.1152/ajpendo.1995.268.3.E521. [DOI] [PubMed] [Google Scholar]
- 9.Rizza RA, Cryer PE, Gerich JE. Role of glucagon, catecholamines, and growth hormone in human glucose counterregulation. J Clin Invest. 1979;64(1):62–71. doi: 10.1172/JCI109464. [DOI] [PMC free article] [PubMed] [Google Scholar]
- 10.Dagogo-Jack SE, Craft S, Cryer PE. Hypoglycemia-associated autonomic failure in insulin-dependent diabetes mellitus. J Clin Invest. 1993;91(3):819–828. doi: 10.1172/JCI116302. [DOI] [PMC free article] [PubMed] [Google Scholar]
- 11.Cryer PE. The barrier of hypoglycemia in diabetes. Diabetes. 2008;57(12):3169–3176. doi: 10.2337/db08-1084. [DOI] [PMC free article] [PubMed] [Google Scholar]
- 12.Siafarikas A, Johnston RJ, Bulsara MK, O’Leary P, Jones TW, Davis EA. Early loss of the glucagon response to hypoglycemia in adolescents with type 1 diabetes. Diabetes Care. 2012;35(8):1757–1762. doi: 10.2337/dc11-2010. [DOI] [PMC free article] [PubMed] [Google Scholar]
- 13.Barrou Z, Seaquist ER, Robertson RP. Pancreas transplantation in diabetic humans normalizes hepatic glucose production during hypoglycemia. Diabetes. 1994;43(5):661–666. doi: 10.2337/diab.43.5.661. [DOI] [PubMed] [Google Scholar]
- 14.Diem P, et al. Glucagon, catecholamine and pancreatic polypeptide secretion in type I diabetic recipients of pancreas allografts. J Clin Invest. 1990;86(6):2008–2013. doi: 10.1172/JCI114936. [DOI] [PMC free article] [PubMed] [Google Scholar]
- 15.Hwang JH, et al. Impaired net hepatic glycogen synthesis in insulin-dependent diabetic subjects during mixed meal ingestion. J Clin Invest. 1995;95(2):783–787. doi: 10.1172/JCI117727. [DOI] [PMC free article] [PubMed] [Google Scholar]
- 16.Bischof MG, et al. Effects of short-term improvement of insulin treatment and glycemia on hepatic glycogen metabolism in type 1 diabetes. Diabetes. 2001;50(2):392–398. doi: 10.2337/diabetes.50.2.392. [DOI] [PubMed] [Google Scholar]
- 17.Kishore P, et al. Role of hepatic glycogen breakdown in defective counterregulation of hypoglycemia in intensively treated type 1 diabetes. Diabetes. 2006;55(3):659–666. doi: 10.2337/diabetes.55.03.06.db05-0849. [DOI] [PubMed] [Google Scholar]
- 18.Stevenson RW, et al. Similar dose responsiveness of hepatic glycogenolysis and gluconeogenesis to glucagon in vivo. Diabetes. 1987;36(3):382–389. doi: 10.2337/diab.36.3.382. [DOI] [PubMed] [Google Scholar]
- 19.Dobbins RL, Connolly CC, Neal DW, Palladino LJ, Parlow AF, Cherrington AD. Role of glucagon in countering hypoglycemia induced by insulin infusion in dogs. Am J Physiol. 1991;261(6 pt 1):E773–E781. doi: 10.1152/ajpendo.1991.261.6.E773. [DOI] [PubMed] [Google Scholar]
- 20.Lecavalier L, Bolli G, Cryer P, Gerich J. Contributions of gluconeogenesis and glycogenolysis during glucose counterregulation in normal humans. Am J Physiol. 1989;256(6 pt 1):E844–E851. doi: 10.1152/ajpendo.1989.256.6.E844. [DOI] [PubMed] [Google Scholar]
- 21.Dicostanzo CA, et al. Role of the hepatic sympathetic nerves in the regulation of net hepatic glucose uptake and the mediation of the portal glucose signal. Am J Physiol Endocrinol Metab. 2006;290(1):E9–E16. doi: 10.1152/ajpendo.00184.2005. [DOI] [PubMed] [Google Scholar]
- 22.Belanger P, Couturier K, Latour MG, Lavoie JM. Effects of supranormal liver glycogen content on hyperglucagonemia-induced liver glycogen breakdown. Eur J Appl Physiol. 2000;83(4–5):328–335. doi: 10.1007/s004210000286. [DOI] [PubMed] [Google Scholar]
- 23.Vissing J, Wallace JL, Galbo H. Effect of liver glycogen content on glucose production in running rats. J Appl Physiol. 1989;66(1):318–322. doi: 10.1152/jappl.1989.66.1.318. [DOI] [PubMed] [Google Scholar]
- 24.Saberi M, Bohland M, Donovan CM. The locus for hypoglycemic detection shifts with the rate of fall in glycemia: the role of portal-superior mesenteric vein glucose sensing. Diabetes. 2008;57(5):1380–1386. doi: 10.2337/db07-1528. [DOI] [PubMed] [Google Scholar]
- 25.Matveyenko AV, Bohland M, Saberi M, Donovan CM. Portal vein hypoglycemia is essential for full induction of hypoglycemia-associated autonomic failure with slow-onset hypoglycemia. Am J Physiol Endocrinol Metab. 2007;293(3):E857–E864. doi: 10.1152/ajpendo.00283.2007. [DOI] [PubMed] [Google Scholar]
- 26.Hevener AL, Bergman RN, Donovan CM. Novel glucosensor for hypoglycemic detection localized to the portal vein. Diabetes. 1997;46(9):1521–1525. doi: 10.2337/diab.46.9.1521. [DOI] [PubMed] [Google Scholar]
- 27.Bohland M, Matveyenko AV, Saberi M, Khan AM, Watts AG, Donovan CM. Activation of hindbrain neurons is mediated by portal-mesenteric vein glucosensors during slow-onset hypoglycemia. Diabetes. 2014;63(8):2866–2875. doi: 10.2337/db13-1600. [DOI] [PMC free article] [PubMed] [Google Scholar]
- 28.Borg WP, During MJ, Sherwin RS, Borg MA, Brines ML, Shulman GI. Ventromedial hypothalamic lesions in rats suppress counterregulatory responses to hypoglycemia. J Clin Invest. 1994;93(4):1677–1682. doi: 10.1172/JCI117150. [DOI] [PMC free article] [PubMed] [Google Scholar]
- 29.Borg WP, Sherwin RS, During MJ, Borg MA, Shulman GI. Local ventromedial hypothalamus glucopenia triggers counterregulatory hormone release. Diabetes. 1995;44(2):180–184. doi: 10.2337/diab.44.2.180. [DOI] [PubMed] [Google Scholar]
- 30.Borg MA, Sherwin RS, Borg WP, Tamborlane WV, Shulman GI. Local ventromedial hypothalamus glucose perfusion blocks counterregulation during systemic hypoglycemia in awake rats. J Clin Invest. 1997;99(2):361–365. doi: 10.1172/JCI119165. [DOI] [PMC free article] [PubMed] [Google Scholar]
- 31.Fan X, et al. Hypothalamic AMP-activated protein kinase activation with AICAR amplifies counterregulatory responses to hypoglycemia in a rodent model of type 1 diabetes. Am J Physiol Regul Integr Comp Physiol. 2009;296(6):R1702–R1708. doi: 10.1152/ajpregu.90600.2008. [DOI] [PMC free article] [PubMed] [Google Scholar]
- 32.McCrimmon RJ, et al. Key role for AMP-activated protein kinase in the ventromedial hypothalamus in regulating counterregulatory hormone responses to acute hypoglycemia. Diabetes. 2008;57(2):444–450. doi: 10.2337/db07-0837. [DOI] [PubMed] [Google Scholar]
- 33.Vom Dahl S, Hallbrucker C, Lang F, Gerok W, Haussinger D. Regulation of liver cell volume and proteolysis by glucagon and insulin. Biochem J. 1991;278(pt 3):771–777. doi: 10.1042/bj2780771. [DOI] [PMC free article] [PubMed] [Google Scholar]
- 34.Hallbrucker C, vom Dahl S, Lang F, Gerok W, Haussinger D. Modification of liver cell volume by insulin and glucagon. Pflugers Arch. 1991;418(5):519–521. doi: 10.1007/BF00497781. [DOI] [PubMed] [Google Scholar]
- 35.Winnick JJ, et al. Effects of 11β-hydroxysteroid dehydrogenase-1 inhibition on hepatic glycogenolysis and gluconeogenesis. Am J Physiol Endocrinol Metab. 2013;304(7):E747–E756. doi: 10.1152/ajpendo.00639.2012. [DOI] [PMC free article] [PubMed] [Google Scholar]
- 36.Winnick JJ, et al. Hepatic glycogen supercompensation activates AMP-activated protein kinase, impairs insulin signaling, and reduces glycogen deposition in the liver. Diabetes. 2011;60(2):398–407. doi: 10.2337/db10-0592. [DOI] [PMC free article] [PubMed] [Google Scholar]
- 37.McBride A, Hardie DG. AMP-activated protein kinase — a sensor of glycogen as well as AMP and ATP? Acta Physiol (Oxf) 2009;196(1):99–113. doi: 10.1111/j.1748-1716.2009.01975.x. [DOI] [PubMed] [Google Scholar]
- 38.Winnick JJ, et al. A physiological increase in the hepatic glycogen level does not affect the response of net hepatic glucose uptake to insulin. Am J Physiol Endocrinol Metab. 2009;297(2):E358–E366. doi: 10.1152/ajpendo.00043.2009. [DOI] [PMC free article] [PubMed] [Google Scholar]
- 39.Gabriely I, Shamoon H. Fructose normalizes specific counterregulatory responses to hypoglycemia in patients with type 1 diabetes. Diabetes. 2005;54(3):609–616. doi: 10.2337/diabetes.54.3.609. [DOI] [PubMed] [Google Scholar]
- 40.Gabriely I, Hawkins M, Vilcu C, Rossetti L, Shamoon H. Fructose amplifies counterregulatory responses to hypoglycemia in humans. Diabetes. 2002;51(4):893–900. doi: 10.2337/diabetes.51.4.893. [DOI] [PubMed] [Google Scholar]
- 41.Winnick JJ, et al. Liver glycogen loading dampens glycogen synthesis seen in response to either hyperinsulinemia or intraportal glucose infusion. Diabetes. 2013;62(1):96–101. doi: 10.2337/db11-1773. [DOI] [PMC free article] [PubMed] [Google Scholar]
- 42.Parks EJ, Skokan LE, Timlin MT, Dingfelder CS. Dietary sugars stimulate fatty acid synthesis in adults. J Nutr. 2008;138(6):1039–1046. doi: 10.1093/jn/138.6.1039. [DOI] [PMC free article] [PubMed] [Google Scholar]
- 43.Kinote A, et al. Fructose-induced hypothalamic AMPK activation stimulates hepatic PEPCK and gluconeogenesis due to increased corticosterone levels. Endocrinology. 2012;153(8):3633–3645. doi: 10.1210/en.2012-1341. [DOI] [PubMed] [Google Scholar]
- 44.Myers SR, McGuinness OP, Neal DW, Cherrington AD. Intraportal glucose delivery alters the relationship between net hepatic glucose uptake and the insulin concentration. J Clin Invest. 1991;87(3):930–939. doi: 10.1172/JCI115100. [DOI] [PMC free article] [PubMed] [Google Scholar]
- 45.Galassetti P, et al. Effect of fast duration on disposition of an intraduodenal glucose load in the conscious dog. Am J Physiol. 1999;276(3 pt 1):E543–E552. doi: 10.1152/ajpendo.1999.276.3.E543. [DOI] [PubMed] [Google Scholar]
- 46.Galassetti P, Chu CA, Neal DW, Reed GW, Wasserman DH, Cherrington AD. A negative arterial-portal venous glucose gradient increases net hepatic glucose uptake in euglycemic dogs. Am J Physiol. 1999;277(1 pt 1):E126–E134. doi: 10.1152/ajpendo.1999.277.1.E126. [DOI] [PubMed] [Google Scholar]
- 47.Edgerton DS, et al. Effect of 11 beta-hydroxysteroid dehydrogenase-1 inhibition on hepatic glucose metabolism in the conscious dog. Am J Physiol Endocrinol Metab. 2010;298(5):E1019–E1026. doi: 10.1152/ajpendo.00740.2009. [DOI] [PMC free article] [PubMed] [Google Scholar]
- 48.Edgerton DS, et al. Small increases in insulin inhibit hepatic glucose production solely caused by an effect on glycogen metabolism. Diabetes. 2001;50(8):1872–1882. doi: 10.2337/diabetes.50.8.1872. [DOI] [PubMed] [Google Scholar]
- 49. Keppler D, Decker K. Glycogen. New York, New York, USA: Verlag Chemie; 1984:11–18. [Google Scholar]
- 50.Moore MC, et al. Nonesterified fatty acids and hepatic glucose metabolism in the conscious dog. Diabetes. 2004;53(1):32–40. doi: 10.2337/diabetes.53.1.32. [DOI] [PubMed] [Google Scholar]
- 51.Hsieh PS, Moore MC, Neal DW, Venson P, Cherrington AD. Hepatic glucose uptake rapidly decreases after elimination of the portal signal in conscious dogs. Am J Physiol. 1998;275(6 pt 1):E987–E992. doi: 10.1152/ajpendo.1998.275.6.E987. [DOI] [PubMed] [Google Scholar]
- 52.Moore MC, Hsieh PS, Flakoll PJ, Neal DW, Cherrington AD. Differential effect of amino acid infusion route on net hepatic glucose uptake in the dog. Am J Physiol. 1999;276(2 pt 1):E295–E302. doi: 10.1152/ajpendo.1999.276.2.E295. [DOI] [PubMed] [Google Scholar]
- 53.An Z, et al. Portal infusion of escitalopram enhances hepatic glucose disposal in conscious dogs. Eur J Pharmacol. 2009;607(1–3):251–257. doi: 10.1016/j.ejphar.2009.01.042. [DOI] [PMC free article] [PubMed] [Google Scholar]