

Abstract
Multiple studies in animal models have shown that the commonly used food additive carrageenan (CGN) induces inflammation and intestinal neoplasia. We performed the first studies to determine the effects of CGN exposure on human intestinal epithelial cells (IEC) in tissue culture and tested the effect of very low concentrations (1–10 mg/L) of undegraded, high-molecular weight CGN. These concentrations of CGN are less than the anticipated exposure of the human colon to CGN from the average Western diet. In the human colonic epithelial cell line NCM460 and in primary human colonic epithelial cells that were exposed to CGN for 1–8 d, we found increased cell death, reduced cell proliferation, and cell cycle arrest compared with unexposed control cells. After 6–8 d of CGN exposure, the percentage of cells reentering G0–G1 significantly decreased and the percentages of cells in S and G2-M phases significantly increased. Increases in activated p53, p21, and p15 followed CGN exposure, consistent with CGN-induced cell cycle arrest. Additional data, including DNA ladder, poly ADP ribose polymerase Western blot, nuclear DNA staining, and activities of caspases 3 and 7, indicated no evidence of increased apoptosis following CGN exposure and were consistent with CGN-induced necrotic cell death. These data document for the first time, to our knowledge, marked adverse effects of low concentrations of CGN on survival of normal human IEC and suggest that CGN exposure may have a role in development of human intestinal pathology.
Introduction
The common food additive carrageenan (CGN)4 has been widely used for decades in models of intestinal inflammation to test the effects of pharmacological interventions for treatment of inflammatory bowel disease and to study the inflammatory response (1–6). Dozens of studies in animals have demonstrated profound effects of CGN on the intestinal mucosa, producing ulcerations and neoplasms (7,8). The harmful effects of CGN on the intestinal epithelium occur with both high- and low-molecular weight (MW) CGN and with the λ-, κ-, and ι- types of CGN. The effects of low MW CGN have been more widely studied than the effects of the higher MW, undegraded CGN. However, lower MW CGN (<30,000 MW) can be readily produced from the higher MW CGN by acid, heat, mechanical processing, or bacterial action (9–11).
CGN is a natural substance, derived from red algae. In the last half century, the uses of CGN increased and it was incorporated into a wider variety of food products. The 3 major types of CGN (λ-, κ-, and ι-) are used in a variety of manufactured food products, including ice cream, yogurt, chocolate milk, ricotta cheese, soymilk, nutritional supplements, dietetic powders, condensed milk, infant formula, and low-fat sandwich meats (12–15). Because CGN improves texture and solubility of the finished food product, it is often used in low-fat formulations to substitute for higher fat content. The CGN are often used in combination with other hydrocolloids, such as locust bean gum, due to synergism in their effects (16,17). The κ-, λ-, and ι- forms differ in their ability to form gels, their sulfate content (ranging from 1–3 sulfate groups per disaccharide), and the location of sulfate groups. They have the basic structure of a sulfated disaccharide, with galactose residues linked in alternating α-1,3 and β-1,4 bonds (18,19).
Current data in the United States indicate per capita consumption of ~0.082 g person−1·d−1 (20), although individual consumption may vary and has been estimated to be as high as 3.6 g·person−1·d−1 (21). In an extensive study in the 1970s by the Food and Nutrition Board of the National Academy of Sciences, mean CGN intake in the Western diet was calculated as 108 mg/d (22).
Recently, the Joint FAO/WHO Expert Committee on Food Additives modified their position with regard to CGN, declaring its use in infant formula as inadvisable and recommended study of CGN consumption in the diet, in view of new uses of CGN in food (23). Previously, in 2004, the European Union Scientific Committee on Food concluded that the percentage of low-MW CGN (<50,000 MW) consumed should be <5% of the total CGN ingested (24). Although the FDA proposed restricted consumption of low MW CGN in the US, CGN is still considered “generally regarded as safe.” Regulation to reduce the consumption of low MW CGN in food was proposed in 1972 but not enacted, although a more comprehensive regulation was anticipated when the proposed regulation was withdrawn in 1979 (25,26). The regulation for CGN in food products in the U.S. is the stipulation in the Food and Chemical Codex that CGN viscosity be not <5 centipoises (5 mPa·s) for a 1.5% solution at 75°C. However, the viscosity of commercial CGN ranges from ~5 to 800 cps under these conditions, suggesting that this recommendation does little to prevent the inclusion of low MW forms of CGN in food products (7,8,27).
To determine the effects of CGN on normal human intestinal epithelial cells (IEC) in tissue culture, we exposed normal primary human colonocytes and NCM460 cells to low concentrations of CGN, predominantly undegraded λCGN, and report the effects of CGN exposure on cell survival, cell proliferation, cell cycle, and apoptosis.
Materials and Methods
Human colonic epithelial cells
The NCM460 cell line is derived from the normal colonic mucosa of a 68-y-old Hispanic male (28). Cells were maintained in M3:10 media (INCELL). For the majority of experiments, a starting density of 20,000 cells per well of a 6-well cell culture plate was used. Cell doubling time is ~32 h, yielding over 1,000,000 cells per well at 8 d. Normal human colonic tissue was obtained from surgical specimens in accord with a protocol approved by the Institutional Review Board of the University of Illinois at Chicago (29).
Exposure to CGN
The majority of the experiments were performed using undegraded, pure λCGN (Sigma) of MW > 106 at a concentration of 1 mg/L in 3 mL of media (3 μg total CGN) for 1–8 d in a humidified, 5% CO2 environment at 37°C with media changes at 2-d intervals. Undegraded κ- and ι-CGN (Sigma) and degraded CGN of MW < 5000, prepared in the laboratory of Dr. Robert Linhardt (Rensselaer Polytechnic Institute, Troy, New York) by SDS-PAGE, were also tested (30).
Dead cell assay
Assay of dead NCM460 cells was performed with ethidium homodimer-1 (Molecular Probes) following an established protocol (31). NCM460 cells (2 × 10⁴) were exposed to 1–10 mg/L undegraded λCGN for 24 and 48 h. Fluorescence was detected 1 h after addition of ethidium homodimer-1 (4 μmol/L). Standard curves were prepared using known quantities of dead cells. Cells that detached were counted separately and counts of attached and detached cells were added to calculate the total dead cells. KC Junior software (Biotek) was used with FLX800 microplate fluorescence reader (Biotek) at excitation/emission of 530 nm/640 nm to measure the uptake of ethidium.
5-Bromo-2′-deoxyuridine ELISA to measure cell proliferation
Cell proliferation was quantified by measurement of 5-bromo-2′-deoxyuridine (BrdU) incorporation during DNA synthesis in the NCM460 cells by ELISA (Roche) (32). NCM460 cells (1 × 10⁴) were seeded into a 96-well microplate in 200 μL M3:10 media and exposed to λCGN, κCGN, ιCGN, and degraded κCGN (1 mg/L) for 1–8 d. Immune complexes were detected by measuring absorbance at 450 nm with reference at 690 nm.
Cell cycle by flow cytometry
Flow cytometry for DNA content was performed in λCGN-exposed (1 or 10 mg/L) and -unexposed NCM460 and primary colonic epithelial cells on d 2, 4, 6, and 8 (33). NCM460 cells were seeded at an initial density of 10,000 cells per well in 6-well plates and λCGN was added at the time of media changes every 2 d. We collected the treated and control cells and obtained cell cycle phase data with the FACS Calibur flow cytometer and Cell Quest and ModFit software (BD). At least 10,000 cells were analyzed for each time point. The results for each sample were reported as the percentage of cells in each of 5 possible phases: M0 = G0 and G1; M2 = S-phase; M3 = G2/M phase; M4 = DNA content greater than in G2/M; and M5 = sub-G0.
p53 assay by and nucleotide assay
We measured activated nuclear p53 using an oligonucleotide ELISA-based assay (Panomics) (34) following preparation of nuclear extracts of the NCM460 cells (35). Nuclear extract was incubated with a biotinylated oligonucleotide containing a p53 consensus binding site in a binding buffer. The p53 nuclear protein-p53 consensus oligonucleotide complex was immobilized on a streptavidin-coated 96-well assay plate and detected by p53 antibody and horseradish peroxidase-conjugated secondary antibody. Colorimetric readout was measured at 450 nm.
Western blots for p21 and p15
NCM460 whole cell lysates were prepared for treated and control samples following exposure to 1 mg/L λCGN for 1, 2, 4, and 6 d (35). We used 14% SDS-PAGE gels to separate the proteins and probed the gels with mouse monoclonal p21 antibody (BD) at a dilution of 1:250 for 3 h. P15 antibody (Santa Cruz), a rabbit polyclonal IgG, was used at a dilution of 1:50 for 2 h; secondary antibodies were at a dilution of 1:2000. Immunoreactive bands were visualized with the ECL detection kit (Amersham) and compared with the β-actin controls by densitometry.
Western blot for nuclear poly ADP ribose polymerase
Poly ADP ribose polymerase (PARP) antibody (H-250, Santa Cruz) was used to detect PARP in the NCM460 cells exposed to λCGN (1 mg/L) for 1–4 d and in untreated controls. We prepared nuclear extracts of control and treated NCM460 cells (35) and separated proteins in the nuclear extracts by SDS-PAGE on a 12% gel. Protein ladder was used to distinguish MW of PARP and its cleavage products, noting that the MW of PARP was 116 kDa, the apoptotic degradation product was 89 kDa, and the necrotic products were ~50 kDa (36).
Luciferase assay for caspases 3 and 7
Activities of caspases 3 and 7 were measured using a luminescent assay (Caspase-Glo 3/7 Assay; Promega) with a proluminescent caspase-3/7 DEVD-aminoluciferin substrate and a proprietary thermostable luciferase. Relative luminescence units are reported for control and treated samples.
DNA ladder
NCM460 cells were grown under conditions described above. Approximately 2 × 10⁶ cells were harvested and lysed and DNA was prepared and evaluated for ladder characteristic of apoptosis using an apoptotic DNA-ladder kit (Roche) (37). Positive control apoptotic DNA sample was loaded and run simultaneously. Results of gels from d 1, 2, and 4 and from d 4, 6, and 8 were compared with the positive control DNA ladder.
cDNA microarray
cDNA microarray was performed to assess the extent of cellular changes induced by CGN exposure. The Affymetrix Human Gene Chip U133 plus 2.0 system was used, following extraction of total RNA by RNeasy Mini kit (Qiagen) (38). RNA was extracted from replicate biological samples of treated and control samples and separate chips prepared. Each chip had 11 probe set pairs (22 probes total) for every gene identified. Pairwise comparisons of control vs. treated mean values were used to compare the samples. A total of 526 genes had a fold-difference ≥ 1.5 between the control and treated samples. Of these, 184 genes were differentially expressed with a Bonferroni corrected P-value of ≤0.05. A total of 790 transcripts of the 54,613 transcripts present on the chip had uncorrected P-values <0.001. Significant microarray results with fold (T/C) ≥1.495 or ≤−1.50 are provided in Supplemental Table 1. Fold-values <1 are reported as their negative inverse.
Quantitative RT-PCR of Krüppel-like family 4 and junction-mediating and regulatory protein
Quantitative analysis of changes in gene expression was performed using the Stratagene Mx3000P system. Total cellular RNA was prepared using the RNeasy Mini kit (Qiagen). Quantitative RT-PCR (QRT-PCR) was performed using the 1-step Master mix (Stratagene Brilliant for QRT-PCR). Primers were selected using Primer3 software (39), and forward and reverse primers were prepared commercially (Integrated DNA Technologies). Primers were: Krüppel-like family 4 (KLF4) left forward, GCCAAAGAGGGGAAGACGA [NCBI BC029923]; KLF4 right reverse, GCAGGTGTGCCTTGAGATG; junction-mediating and regulatory protein (JMY) left forward, TCTTCCTCCAACACCACCAC [NCBI NM_152405]; and JMY right reverse, CCTCTTCTCATTCCCCTCCTT.
We averaged the cycle thresholds (Ct) for the genes of interest in replicate CGN-treated and untreated samples and used the means of the Ct to determine the differences in expression among the different samples, with β-actin expression as a reference. Differences in Ct were interpreted as an exponent that represents the difference in the number of RNA duplications and were used to calculate the fold-difference in gene expression.
Confocal microscopy of human intestinal cells treated with CGN
NCM460 cells were grown on collagen-coated transwell inserts or 4-chamber tissue culture slides for 24 h and exposed to 1 mg/L λCGN for 6 h to 5 d. Cells were prepared for confocal microscopy by an established protocol (35) and observed using a Zeiss LSM 510 laser scanning confocal microscope.
Statistical analysis
cDNA microarray data were analyzed using the robust microarray analysis method and signal intensities were normalized using background correction, mismatch correction, and quantile normalization. The S+ArrayAnalyzer was used to determine the Local Pooled Error (LPE) t test. P-values were calculated for the pairwise comparisons between treated and control samples and adjusted for multiple comparisons using a Bonferroni correction. Corrected P-values <0.05 were considered significant. Densitometry of Western blots was measured from scanned images using Image J software (NIH). Other data were analyzed by 1-way ANOVA with Tukey-Kramer post test for multiple comparisons. Reported P-values are for the significance of the differences between CGN-treated and control samples at the same time point unless another comparison is indicated. Paired 2-tail t test was used for comparison of densitometry between CGN-treated and control samples. Statistical analysis was performed using GraphPad InStat software. Three independent experiments with 2 technical replicates of each determination were performed, unless stated otherwise. Values in results and figures are means ± SD.
Results
Declines in cell viability and proliferation following CGN exposure
Cell death, as measured by uptake of ethidium homodimer-1, was 5 and 11.5% greater in cells exposed for 1 d to 1 and 10 mg/L λCGN, respectively, compared with the control (P < 0.001) (Fig. 1A). Increased cell death following CGN exposure was also associated with exposure to increased CGN concentration (P < 0.001).
FIGURE 1.
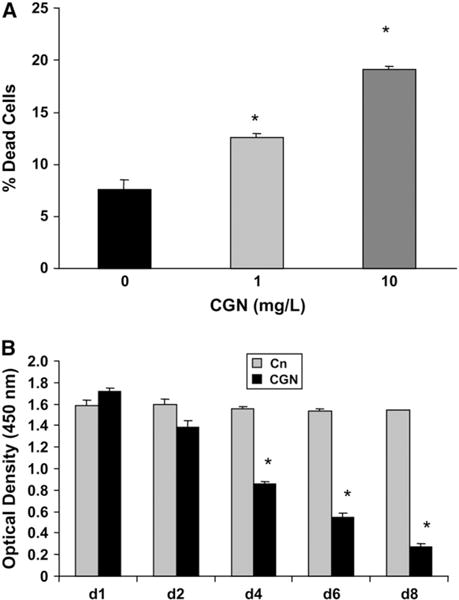
NCM460 viability and proliferation following CGN exposure. (A) Percentage of dead cells following exposure to λCGN (1 and 10 mg/L × 24 h) was determined by uptake of ethidium homodimer-1. Exposure to λCGN was associated with increased cell death in exposed vs. control and with exposure to higher CGN concentration (P < 0.001, 1-way ANOVA with Tukey-Kramer post test). Results are means ± SD, n = 3 independent observations. (B) BrdU ELISA was performed on d 1, 2, 4, 6, and 8 to determine extent of cell proliferation in NCM460 cells exposed to undegraded λCGN, κCGN, and ιCGN and to degraded κCGN (1 mg/L) compared with untreated controls. Cell proliferation was markedly reduced following all forms of CGN, compared with the control cells. Data are shown for λCGN (P < 0.001 for d 4, 6, and 8; P < 0.05 for d 2; 1-way ANOVA with Tukey-Kramer post test). Results are means ± SD, n = 3 independent observations. Similar results were obtained with κCGN, ιCGN, and degraded κCGN (n = 3 independent observations).
Compared with control cells on the same day, cell proliferation, measured by BrdU incorporation, in the CGN-treated NCM460 cells was 10–14% lower by d 2, 37–46% lower by d 4, 53–64% lower by d 6, and 69–76% lower by d 8 following exposure to undegraded λCGN (Fig. 1B), κCGN, ιCGN, and degraded κCGN (P < 0.05, d2; P < 0.001, d 4, 6, and 8). Similar declines occurred following exposure to each form of CGN.
Cell cycle arrest demonstrated by flow cytometry following CGN exposure
Between d 2 and 6, the attached (living) cells in G0-G1 declined >16% with CGN exposure, to 69.8 ± 0.1%, from a baseline value of 86.4 ± 0.3%. In contrast, the d 2 and 6 control values were similar and unchanged (86.0 ± 0.8% and 85.7 ± 0.2%) (Table 1). The percentages of the attached CGN-treated cells in G0-G1 at d 6 and d 8 were less than the percentages of the same day control cells (P < 0.001). Also, the percentages of the attached CGN-treated cells were greater than the attached control cells in S and G2-M phases for d 6 and 8 (P < 0.001) and in the sub-G0 phase (P < 0.01). In the detached cells, only the difference in CGN-treated and control cells in the S-phase on d 6 achieved significance (P < 0.05).
TABLE 1.
Cell cycle phase distribution of CGN-exposed and unexposed NCM460 cells1
| 2 d
|
4 d
|
6 d
|
8 d
|
||||||
|---|---|---|---|---|---|---|---|---|---|
| CGN | Control | CGN | Control | CGN | Control | CGN | Control | ||
| Attached cells | % | ||||||||
| G0-G1 | 86.4 ± 0.3 | 86.0 ± 0.8 | 83.4 ± 1.0 | 81.0 ± 0.4 | 69.8 ± 0.1 | 85.7 ± 0.2 | 70.4 ± 1.0 | 86.5 ± 0.5 | |
| S | 5.5 ± 0.4 | 5.4 ± 0.4 | 7.9 ± 0.5 | 9.5 ± 0.01 | 12.1 ± 0.2 | 5.4 ± 0.3 | 11.2 ± 0.2 | 5.7 ± 0.5 | |
| G2-M | 4.4 ± 0.04 | 4.2 ± 0.1 | 5.9 ± 0.3 | 6.7 ± 0.4 | 8.3 ± 0.06 | 4.9 ± 0.4 | 8.4 ± 0.2 | 3.8 ± 0.4 | |
| Sub-G0 | 2.1 ± 0.7 | 3.0 ± 0.2 | 1.6 ± 0.8 | 1.2 ± 0.7 | 6.7 ± 0.5 | 2.6 ± 0.1 | 6.9 ± 1.3 | 2.8 ± 0.5 | |
| Detached cells | |||||||||
| G0-G1 | 62.8 ± 2.3 | 56.3 ± 1.7 | 59.8 ± 2.7 | 58.8 ± 1.0 | |||||
| S | 8.3 ± 0.01 | 10.8 ± 0.5 | 9.2 ± 1.0 | 10.2 ± 0.4 | |||||
| G2-M | 9.2 ± 0.6 | 8.1 ± 0.9 | 9.0 ± 0.6 | 7.0 ± 1.0 | |||||
| Sub-G0 | 11.9 ± 0.5 | 18.5 ± 0.6 | 15.3 ± 2.8 | 18.4 ± 1.5 | |||||
Values are means ± SD of 2 independent measurements, each of which measured >10,000 cells in the attached cells, and 5000–10,000 in the detached cells. Differences between CGN-exposed and control cells were significant at d 6 and 8 for the G0-G1, S, and G2-M cell cycle phases, P < 0.001; 1-way ANOVA with Tukey-Kramer post test, and for the sub-G0 phase, P < 0.01. In the detached cells, only the difference in CGN-treated vs. control cells in S-phase on d 6 achieved significance, P < 0.05.
These differences between the percentage of CGN-treated and control cells were consistent with cell cycle arrest and with reduced reentry of the CGN-treated cells into G0-G1. When λCGN at 10-fold higher concentration (10 mg/L) was used, similar percentages of cells in G0-G1, S, G2-M, and sub-G0 on d 6 and 8 were detected (data not shown).
Increase in activated p53 by oligonucleotide assay
By 24 h, the activated p53 was 14% greater in the CGN-exposed cells than in the control cells (P < 0.001) (Fig. 2) and by 48 h, activated p53 in the CGN-treated cells was 36% greater than the same day control (P < 0.001). By d 4, activated p53 increased to 71% greater than baseline and 52% greater than the same day control (P < 0.001).
FIGURE 2.
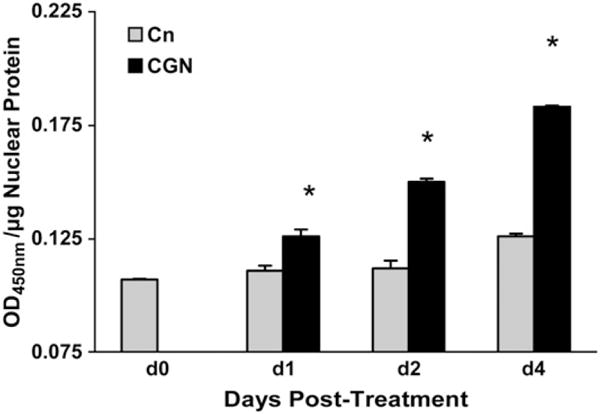
Activated p53 and total p53 in CGN-exposed and control NCM460 cells. ELISA of activated p53 oligonucleotide demonstrates increase in activated nuclear p53 on d 1, d 2, and d 4 in CGN-exposed cells, compared with same day control cells (P < 0.001; 1-way ANOVA with Tukey-Kramer post test). Results are means ± SD, n = 3 independent observations.
cDNA microarray
A total of 184 genes (166 named) were found to be differentially expressed following CGN exposure, with a Bonferroni corrected P-value of ≤5 × 10⁻², corresponding to an uncorrected P-value of <1 × 10⁻⁶. Of these 184 genes, only 19 were downregulated, with the remainder upregulated to at least 1.4 times the control. A total of 526 genes had differences in expression of at least 1.5-fold; of these, 105 were down-regulated.
Several genes associated with p53, cell cycle, and cell stress response were up-regulated following exposure to λCGN (1 mg/L for d 4) (Table 2; Supplemental Table 1). These upregulated genes included p21 [cyclin-dependent kinase (CDK) N1A] and p15 (CDKN2B), consistent with the observed cell cycle arrest. p21 expression was 1.7 times the control value (corrected P = 3.0 × 10⁻²). P15 was increased to 2.6 times the control value (corrected P = 5.6 × 10⁻⁸). The intestinal proto-oncogene KLF4, which mediates p53 effects and is associated with growth arrest, was expressed at 1.7 times the control level (corrected P = 5 × 10⁻³). JMY, which complexes with p300 and induces p53-mediated cell cycle arrest, was also increased, to 2.1 times the control value (corrected P = 8.1 × 10⁻⁵). Significantly increased expression of heat-shock proteins also followed exposure to 1 mg/L of λCGN for d 4, consistent with significant cell stress induced by CGN.
TABLE 2.
Selected genes in NCM460 cells significantly affected by 4 d of exposure to λCGN (1 mg/L)1
| Gene | Gene symbol | Bonferroni corrected P-value2 | Fold (treated/control) | Reference |
|---|---|---|---|---|
| Cell-cycle and/or p53-related | ||||
| Activating transcription factor 3 | ATF3 | 3 × 10⁻¹⁶ | 2.9 | NM_001674 |
| Cell-cycle progression 1 | CCPG1 | 3 × 10⁻² | 1.7 | NM_004748 |
| CDK inhibitor 1A | CDKN1A;p21 | 3 × 10⁻² | 1.7 | NM_000389 |
| CDK inhibitor 2B | CDKN2B;p15 | 6 × 10⁻⁸ | 2.6 | NM_004136 |
| Dual-specificity phosphatase | DUSP5 | 3 × 10⁻¹⁰ | 2.2 | NM_004419 |
| Growth differentiation factor 15 | GDF15 | 3 × 10⁻¹² | 1.9 | NM_004864 |
| JMY | JMY | 8 × 10⁻⁵ | 2.1 | NM_152405 |
| KLF4 (gut) | KLF4 | 5 × 10⁻³ | 1.7 | NM_004235 |
| Stress-related | ||||
| BCL10 | 5 × 10⁻³ | 2.0 | NM_003921 | |
| Decay accelerating factor for complement | DAF | ~0 | 2.9 | NM_000574 |
| DnaJ (Hsp40) | DNAJB9 | ~0 | 4.7 | NM_012328 |
| Early growth response gene 1 | EGR1 | 5 × 10⁻⁴ | 1.7 | NM_001964 |
| Heat shock 70 kDA | HSPA5 | 5 × 10⁻⁷ | 1.5 | NM_005347 |
| Mitogen-inducible gene 6 | MIG-6 | 6 × 10⁻⁶ | 1.7 | NM_018948 |
| Stress-associated endoplasmic reticulum protein 1 | SERP1 | 2 × 10⁻⁴ | 1.6 | NM_014445 |
| Stress 70 protein chaperone | STCH | 9 × 10⁻¹³ | 2.4 | NM_006948 |
| Ubiquitin specific protease 53 | USP53 | 1 × 10⁻³ | 2.0 | H25097 NCBI |
Biological replicates of NCM460 mRNA were tested; each gene was probed by 11 probe-set pairs on the array and analyzed, as described in “Methods.”
P-values were corrected for multiple comparisons by the Bonferroni correction.
Confirmation of increases in p21 and p15 by Western blot and for KLF4 and JMY by QRT-PCR
Western blot (Fig. 3) confirmed the increases in p21 and p15 on d 1, 2, 4, and 6 following CGN treatment, compared with untreated control cells. P21 protein expression was not detectable in the control cells, in contrast to the CGN-treated cells. Densitometry was performed of replicate Western blots for p15 at multiple time points and showed increased p15 expression following CGN exposure (P = 0.005). These results support the increased expression of p21 and p15 identified by the cDNA microarray analysis.
FIGURE 3.
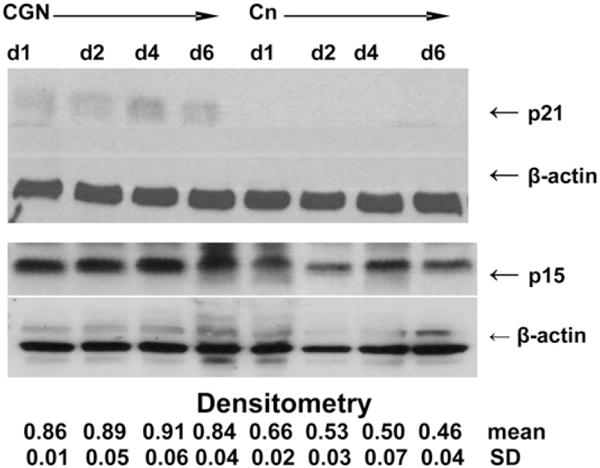
Western blot of p21 and p15 in CGN-exposed vs. control NCM460 cells. Representative Western blots demonstrate relative increases in p21 and in p15 on d 1, 2, 4, and 6. P21 was absent in the control cells on d 1, 2, 4, and 6, in contrast to the CGN-treated cells, indicating an increase in expression following CGN exposure. Densitometric analysis was used to calculate the p15:β-actin ratios that demonstrate significant differences between CGN-treated and control cells (P = 0.005; paired t test, 2-tail, n = 2).
QRT-PCR confirmed the increased expression of KLF4 and JMY. Transcript abundance for KLF4 was 80 times the baseline level on d 1 and 149 times the baseline level on d 2 when exposed to 1 mg/L of λCGN. JMY mRNA was undetectable in control cells on d 1, 2, and 4 but present following CGN exposure.
Nuclear PARP indicates necrosis, not apoptosis
The Western blot of PARP from nuclear extract of CGN-treated and control NCM460 cells on d 1, 2, 4, and 6 demonstrated that the band density of uncleaved PARP (MW 116 kDa) was unchanged in the CGN-exposed NCM460 cells compared with the untreated cells (Fig. 4). Band density of lower MW fragments was increased for the 50-kDa fragment following CGN treatment, consistent with evidence of necrosis, rather than apoptosis. The 89-kDa fragment, associated with apoptosis, did not appear increased in the CGN or control cells.
FIGURE 4.
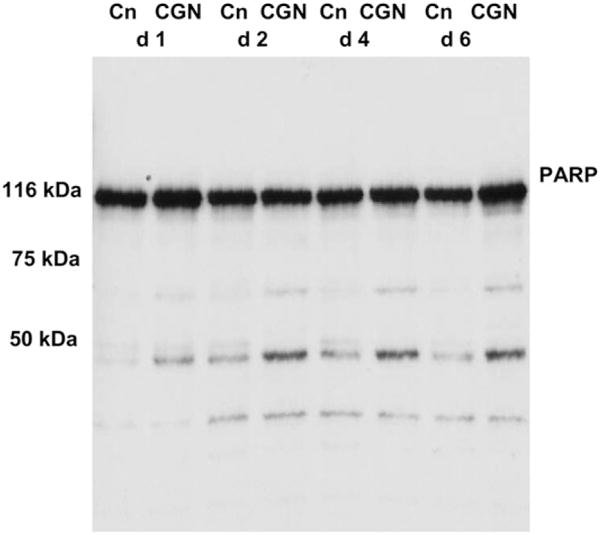
Representative Western blot of PARP (116 kDa) from nuclear extract of NCM460 cells. No 89-kDa band is present in either the CGN-exposed or control cells on d 1, 2, 4, or 6, consistent with the lack of significant apoptosis. Instead, 50- to 70-kDa bands appear increased in the CGN-treated cells, suggestive that the observed increase in cell death is attributable to necrosis.
Caspases 3 and 7 not increased following CGN exposure
Activity of caspases 3 and 7 was measured in the NCM460 cells on d 1 and d 2 following CGN-exposure (1 mg/L). Activities of caspases 3 and 7 did not differ between control and treated cells and did not change over time (data not shown).
Integrity of DNA maintained following CGN exposure
No differences were identified in the DNA ladder between DNA from CGN-treated (1 mg/L for d 1–8) and untreated NCM460 cells (data not shown). No DNA bands suggestive of fragmentation were identified, when compared with a representative apoptotic DNA ladder with characteristic “rungs” at 180-bp intervals. This indicated that nucleases associated with apoptosis were not released following CGN exposure.
Similarly, when confocal microscopy of NCM460 cells was performed following fluorescent nuclear staining of CGN-treated and control cells, the DNA pattern between control and treated cells at 24 h was similar, without evidence of apoptotic changes (data not shown). At earlier (6 h) and later (d 5) time points, integrity of DNA in the CGN-exposed cells appeared similar to control cells without evidence of chromatin condensation.
Discussion
The studies presented in this report demonstrate activation of the p53 tumor suppressor network and the occurrence of cell cycle arrest and cell death following exposure of normal human IEC in tissue culture to low concentrations of λCGN. DNA fragmentation analysis, PARP fragmentation, confocal imaging, and determinations of caspases 3 and 7 activity indicated no increase in apoptosis following λCGN treatment. Hence, the increased cell death appears to be attributable to necrosis rather than apoptosis.
The induction of p53-associated responses following exposure to CGN occurs as part of the cellular reaction to stress to limit cell damage and reproduction of damaged cells (40). Cell cycle data from flow cytometry revealed an impasse at G0-G1 associated with increased CDK inhibitors p21 and p15 (41,42). The antiproliferative response, measured by decline in BrdU incorporation, occurred following exposure to undegraded λ-, κ-, and ι-CGN as well as degraded κ-CGN. The p53-responsive gene p21 was significantly upregulated following exposure to λCGN. Fold-increase for p15 was also greater, suggesting involvement of cell-cycle regulatory mechanisms related to transforming growth factor β. In addition to these mediators, changes in JMY and KLF4 were observed, suggesting effects on additional p53-responsive genes involved in cell cycle regulation (43,44).
The explicit sequence of events that occurs in the IEC can not yet be ascertained. We have observed in other experiments an increase in B-cell CLL/lymphoma 10 (Bcl10), nuclear factor κB, and interleukin-8 following exposure to CGN, indicating that CGN activates an inflammatory response in the IEC (29). The observed cell cycle arrest may occur in response to activation of a stress-associated response, consistent with the activation of an immune response mediated by Bcl10. CGN possesses an α-1,3-galactosidic bond that is immunogenic in human cells and associated with absence of the α-1,3-galactosyl transferase enzyme (45,46). This unusual galactosidic linkage in CGN may be significant in its activation of an innate immune, inflammatory response in IEC (29).
We observed marked reduction in overall proliferation beginning by d 2. We have observed in other experiments that CGN induces a decline in bone morphogenetic protein 4 and an increase in wnt 9a and β-catenin, consistent with known pathways of polyp formation in both juvenile polyposis and sporadic polyposis (47). These pathways may converge so that cell cycle arrest and increased cell death may provoke ulcerations and tissue repair mechanisms that are associated with aberrant wnt and bone morphogenetic protein 4 signaling, predisposing to development of neoplasms.
The effects of CGN may be partially attributable to resemblance to the naturally occurring glycosaminoglycans (GAG). Due to its sulfated di-galactose backbone, CGN resembles to some extent keratan sulfate, dermatan sulfate, and chondroitin sulfate, which also contain sulfated galactose or N-acetylgalactosamine residues. Some of the harmful effects of CGN may arise by mimicry or interference with the effects of these GAG or the proteoglycans with which they are associated, including decorin, biglycan, aggrecan, and versican, because the proteoglycans of the cell surface and matrix are involved with cell signaling and cell-cell interactions (48). Also, the α-1,3-galactosidic linkage of CGN is not found in the naturally occurring GAG and can not be metabolized by the normal human galactosidases.
Previous reports have detailed harmful effects of CGN in the intestine in animal models (7,8). The evidence presented in this report demonstrates for the first time deleterious effects of small quantities of CGN on cell cycle progression and on viability of normal human IEC in tissue culture. It is possible that the increase in cell death and the reduction in cell proliferation following CGN exposure may contribute to evolution of intestinal ulcerations in vivo, such as those that are characteristic of inflammatory bowel disease.
The consumption of CGN in the U.S. has increased from 1.8 × 10⁶ kg in 1971 to 9.1 × 10⁶ kg in 2004 (19,49). On a per capita basis, this represents a change from ~24 mg person−1·d−1 to ~82 mg person−1·d−1. In colonic contents of 1.5 L (50), the CGN concentration would be ~56 mg/L, substantially higher than the concentration used in the experiments presented in this report (1 mg/L). In vivo, mitigating factors to reduce the direct exposure of the colon to CGN include the presence of bacterial microflora, intestinal motility, and coconsumption of other non-CGN containing foods. The precise effects of these processes on CGN metabolism and toxicity require further study.
The study findings of increased IEC death, reduced cell proliferation, and cell cycle arrest indicate that CGN has induced very profound effects in the human IEC and suggest that CGN exposure may induce similar effects in vivo. These findings extend earlier reports that implicate CGN in development of intestinal inflammation and neoplasms in animal models to include harmful effects in human IEC and suggest that ongoing exposure to CGN in the diet may have a role in development of human intestinal disease.
Supplementary Material
Acknowledgments
We thank Rafael Nunez M.D., M.S. for assistance with flow cytometry, Robert Linhardt Ph.D. for preparation of degraded κCGN, Ravinder Gill Ph.D. and Mei Ling Chen M.D. for assistance with confocal microscopy, Nitika Pant B.S. for assistance with Western blots, and Phyllis Stumbo R.D., Ph.D. for assistance with CGN references.
Footnotes
Supported by the Department of Veterans Affairs and by NIDDK grants (DK68324 and DK54016 to P.K.D.).
Author disclosures: S. Bhattacharyya, A. Borthakur, P. K. Dudeja, and J. K. Tobacman, no conflicts of interest.
Supplemental Table 1 is available with the online posting of this paper at jn.nutrition.org.
Abbreviations used: Bcl10, B-cell CLL/lymphoma 10; BrdU, bromo-deoxyuridine; CDK, cyclin-dependent kinase; CGN, carrageenan; GAG, glycosaminoglycan; IEC, intestinal epithelial cell; JMY, junction-mediating protein; KLF4, Krüppel-like family 4; PARP, poly-adenosine diphosphate ribose polymerase; QRT-PCR, quantitative RT-PCR; RLU, relative luminescence unit.
Literature Cited
- 1.Jaysekhar P, Rao SB, Santhakumari G. Effect of 5-substituted benzylideneaminosalicylic acid on CGN-induced ulcerative colitis. Boll Chim Farm. 2004;143:309–13. [PubMed] [Google Scholar]
- 2.Goto M, Okamoto Y, Yamamoto M, Aki H. Anti-inflammatory effects of 5-aminosalicylic acid conjugates with chenodeoxycholic acid and ursodeoxycholic acid on CGN-induced colitis in guinea-pigs. J Pharm Pharmacol. 2001;53:1711–20. doi: 10.1211/0022357011778115. [DOI] [PubMed] [Google Scholar]
- 3.Watt J, Marcus SN, Marcus AJ. The comparative prophylactic effects of sulphasalazine, prednisolone, and azathioprine in experimental colonic ulceration. J Pharm Pharmacol. 1980;32:873–4. doi: 10.1111/j.2042-7158.1980.tb13100.x. [DOI] [PubMed] [Google Scholar]
- 4.Kitano A, Matsumoto T, Oshitani N, Nakagawa M, Yasuda K, Watanabe Y, Tomobuchi M, Obayashi M, Tabata A, et al. Distribution and anti-inflammatory effect of mesalazine on CGN-induced colitis in the rabbit. Clin Exp Pharmacol Physiol. 1996;23:305–9. doi: 10.1111/j.1440-1681.1996.tb02828.x. [DOI] [PubMed] [Google Scholar]
- 5.Sharratt M, Grasso P, Carpanini F, Gangolli SD. Carrageenan ulceration as a model for human ulcerative colitis. Lancet. 1971;1:192–3. doi: 10.1016/s0140-6736(71)91971-4. [DOI] [PubMed] [Google Scholar]
- 6.Kim H-S, Berstad A. Experimental colitis in animal models. Scand J Gastroenterol. 1992;27:529–37. doi: 10.3109/00365529209000116. [DOI] [PubMed] [Google Scholar]
- 7.Tobacman JK. Toxic considerations related to ingestion of carrageenan. In: Preedy VR, Watson RR, editors. Reviews in food and nutrition toxicity. Vol. 1. New York: Taylor & Francis; 2003. pp. 204–29. [Google Scholar]
- 8.Tobacman JK. Review of harmful gastrointestinal effects of carrageenan in animal experiments. Environ Health Perspect. 2001;109:983–94. doi: 10.1289/ehp.01109983. [DOI] [PMC free article] [PubMed] [Google Scholar]
- 9.Marrs WM. The stability of carrageenan to processing. In: Williams PA, Phillips GO, editors. Gums and stabilizers for the food industry. Cambridge (UJ): The Royal Society of Chemistry; 1998. pp. 345–357. [Google Scholar]
- 10.Ekstrom L-G. Molecular weight distribution and the behavior of kappa-carrageenan on hydrolysis. Carbohydr Res. 1985;135:283–9. [Google Scholar]
- 11.Ekstrom L-G, Kuivinen J, Johansson G. Molecular weight distribution and hydrolysis behavior of carrageenans. Carbohydr Res. 1983;116:89–94. [Google Scholar]
- 12.Shah Z, Huffman F. Current availability and consumption of carrageenan-containing foods. Ecol Food Nutr. 2003;42:357–71. [Google Scholar]
- 13.Camacho MM, Martinez-Navarrete N, Chiralt A. Rheological characterization of experimental dairy creams formulated with locust bean gum and Lambda-carrageenan. Int Dairy J. 2005;15:243–8. [Google Scholar]
- 14.Lin KW, Mei MY. Influences of gums, soy protein isolate and heating temperatures on reduced-fat meat batters in a model system. J Food Sci. 2000;65:48–52. [Google Scholar]
- 15.Molina Ortiz SE, Puppo MC, Wagner JR. Relationship between structural changes and functional properties of soy protein isolates-carrageenan systems. Food Hydrocoll. 2004;18:1045–53. [Google Scholar]
- 16.Kelco CP. GENU carrageenan. Product information. Available from: http://www.cpkelco.com/food/carrageenan.html.
- 17.CEAMSA. Compañia Española de Algas Marina, S.A. Carrageenan. 2002 Available from: http://www.CEAMSA.com.
- 18.Hernandez MJ, Dolz J, Dolz M, Delegido J, Pellicer J. Viscous synergism in carrageenans (κ and λ) and locust bean gum mixtures: influence of adding sodium carboxymethylcellulose. Food Sci Technol Int. 2001;7:383–91. [Google Scholar]
- 19.Yuguchi Y, Thuy TTT, Urakawa H, Kajiwara I. Structural characteristics of carrageenan gels: temperature and concentration dependence. Food Hydrocoll. 2002;16:515–22. [Google Scholar]
- 20.Somogyi LP, Miller S, Kishi A. Food additives. Vol. 76. San Francisco: SRI Consulting: Specialty Chemicals; 2005. p. 106. [Google Scholar]
- 21.FDA. Processed eucheuma seaweed. Working paper. 1992 [Google Scholar]
- 22.Food and Nutrition Board NRC. Estimating distribution of daily intakes of Chondrus extract (carrageenan): Committee on GRAS List Survey-Phase III. Washington, DC: National Academy of Sciences; 1976. pp. 1–7. [Google Scholar]
- 23.Joint FAO/WHO Expert Committee on Food Additives. Sixty-eighth meeting, 2007. Summary and conclusions. Available from: http://www.Jecfa68meeting.pdf.
- 24.Scientific Committee on Food. European Commission Health and Consumer Protection Directorate-General. Opinion of the Scientific Committee on Food on Carrageenan. 2003 Mar 5; Available from: http://europa.eu.int/comm/food/fs/sc/scf/out164_en.pdf.
- 25.Proposed Revision of Food Additive Regulations and Deletion of Chondrus Extract (Carrageenin) from Generally Regarded as Safe (GRAS) List. 1972, 37 Fed Reg 15434.
- 26.Carrageenan, salts of carrageenan and chondrus extract (carrageenin); withdrawal of proposal and termination of rulemaking proceeding. Fed Reg. 1979;44:40343–40345. [Google Scholar]
- 27.NRC. Food chemicals codex. 4th. Washington, DC: National Academy of Science; 1996. [Google Scholar]
- 28.Moyer MP, Manzano LA, Merriman RL, Stauffer JS, Tanzer LR. NCM460, a normal human colon mucosal epithelial cell line. In Vitro Cell Dev Biol Anim. 1996;32:315–7. doi: 10.1007/BF02722955. [DOI] [PubMed] [Google Scholar]
- 29.Bhattacharyya S, Borthakur A, Dudeja PK, Tobacman JK. Carrageenan induces interleukin-8 production through distinct Bcl10 pathway in normal human colonic epithelial cells. Am J Physiol Gastrointest Liver Physiol. 2007;292:G829–38. doi: 10.1152/ajpgi.00380.2006. [DOI] [PubMed] [Google Scholar]
- 30.Yu G, Guan H, Ioanoviciu AS, Sikkander SA, Thanawiroon C, Tobacman JK, Toida T, Linhardt RJ. Structural studies on κ-CGN derived oligosaccharides. Carbohydr Res. 2002;337:433–40. doi: 10.1016/s0008-6215(02)00009-5. [DOI] [PubMed] [Google Scholar]
- 31.Liu M-L, Hong S-T. Early phase of amyloid β42-induced cytotoxicity in neuronal cells is associated with vacuole formation and enhancement of exocytosis. Exp Mol Med. 2005;37:559–66. doi: 10.1038/emm.2005.69. [DOI] [PubMed] [Google Scholar]
- 32.Wittstock M, Rehfeldt C, Mix E, Zettl UK. Comparison of three different proliferation assays for mouse myoblast cultures. Anal Biochem. 2001;292:166–9. doi: 10.1006/abio.2001.5061. [DOI] [PubMed] [Google Scholar]
- 33.Nunez R. DNA measurement and cell cycle analysis by flow cytometry. Curr Issues Mol Biol. 2001;3:67–70. [PubMed] [Google Scholar]
- 34.Hur J, Bell DW, Dean KL, Coser KR, Hilario PC, Okimoto RA, Tobey EM, Smith SL, Isselbacher KJ, et al. Regulation of expression of BIK proapoptotic protein in human breast cancer cells: p53-dependent induction of BIK mRNA by fulvestrant and proteasomal degradation of BIK protein. Cancer Res. 2006;66:10153–61. doi: 10.1158/0008-5472.CAN-05-3696. [DOI] [PubMed] [Google Scholar]
- 35.Bhattacharyya S, Borthakur A, Pant N, Dudeja PK, Tobacman JK. Bcl10 mediates lipopolysaccharide (LPS)-induced activation of NFκB and IL-8 in human intestinal epithelial cells. Am J Physiol Gastrointest Liver Physiol. 2007;293:G429–37. doi: 10.1152/ajpgi.00149.2007. [DOI] [PubMed] [Google Scholar]
- 36.Shah GM, Shah RG, Poirier GG. Different cleavage pattern for poly (ADP-ribose) polymerase during necrosis and apoptosis in HL-60 cells. Biochem Biophys Res Commun. 1996;229:838–44. doi: 10.1006/bbrc.1996.1889. [DOI] [PubMed] [Google Scholar]
- 37.Khan MAS, Oubrahim H, Stadtman ER. Inhibition of apoptosis in acute promyelocytic leukemia cells leads to increases in levels of oxidized protein and LMP2 immunoproteasome. Proc Natl Acad Sci USA. 2004;101:11560–5. doi: 10.1073/pnas.0404101101. [DOI] [PMC free article] [PubMed] [Google Scholar]
- 38.Affymetrix. Human Genome U133 Plus2.0. NetAffx™ Analysis Center; Products and applications. Gene Chip System. Gene Chip Arrays. Available from: https://www.affymetrix.com. [Google Scholar]
- 39.Whitehead Institute for Medical Research. Primer 3. Cambridge (MA): Available from: http://frodo.wi.mit.edu. [Google Scholar]
- 40.Staib F, Robles AI, Varticovski L, Wang XW, Zeeberg BR, Sirotin M, Zhurkin VB, Hofseth LJ, Hussain SP, et al. The p53 tumor suppressor network is a key responder to microenvironmental components of chronic inflammatory stress. Cancer Res. 2005;65:10255–64. doi: 10.1158/0008-5472.CAN-05-1714. [DOI] [PMC free article] [PubMed] [Google Scholar]
- 41.Xiong Y, Hannon GJ, Zhang H, Casso D, Kobayashi R, Beach D. P21 is a universal inhibitor of cyclin kinases. Nature. 1993;366:701–4. doi: 10.1038/366701a0. [DOI] [PubMed] [Google Scholar]
- 42.Hannon GJ, Beach D. P15INK4B is a potential effector of TGF-beta-induced cell cycle arrest. Nature. 1994;371:257–61. doi: 10.1038/371257a0. [DOI] [PubMed] [Google Scholar]
- 43.Shields JM, Christy RJ, Yang VW. Identification and characterization of a gene encoding a gut-enriched Krüppel-like factor expressed during growth arrest. J Biol Chem. 1996;271:20009–17. doi: 10.1074/jbc.271.33.20009. [DOI] [PMC free article] [PubMed] [Google Scholar]
- 44.Shikama N, Lee C-W, France S, Delavaine L, Lyon J, Krstic-Demonacos M, LaThangue NB. A novel cofactor for p300 that regulates the p53 response. Mol Cell. 1999;4:365–76. doi: 10.1016/s1097-2765(00)80338-x. [DOI] [PubMed] [Google Scholar]
- 45.Osman N, McKenzie IFC, Ostenried K, Ioannou YA, Desnick RJ, Sandrin MS. Combined transgenic expression of alpha-galactosidase and alpha 1,2 fucosyltransferase leads to optimal reduction in the major xenoepitope Galalpha(1,3)Gal. Proc Natl Acad Sci USA. 1997;94:14677–82. doi: 10.1073/pnas.94.26.14677. [DOI] [PMC free article] [PubMed] [Google Scholar]
- 46.Galili U. The alpha-gal epitope and the anti-Gal antibody in xenotransplantation and in cancer immunotherapy. Immunol Cell Biol. 2005;83:674–86. doi: 10.1111/j.1440-1711.2005.01366.x. [DOI] [PubMed] [Google Scholar]
- 47.Bhattacharyya S, Borthakur A, Dudeja PK, Tobacman JK. Carrageenan reduces bone morphogenetic protein-4 (BMP4) and activates Wnt/β-catenin pathway in normal human colonocytes. Dig Dis Sci. 2007;10:2766–74. doi: 10.1007/s10620-006-9531-4. [DOI] [PubMed] [Google Scholar]
- 48.Delehedde M, Lyon M, Sergeant N, Rahmoune H, Fernig DG. Proteoglycans: pericellular and cell surface multireceptors that integrate external stimuli in the mammary gland. J Mammary Gland Biol Neoplasia. 2001;6:253–73. doi: 10.1023/a:1011367423085. [DOI] [PubMed] [Google Scholar]
- 49.Chemical economics handbook. Menlo Park (CA): Stanford Research Institute; 1976. Water soluble resins. [Google Scholar]
- 50.Vanner SJ. Physiology of the colon. Section 2.3. Absorption and secretion. Thomson ABR, Shaffer EA, editors. First principles of gastroenterology. 2007 Available from: http://www.gastroresource.com/GITextbook/en/Chapter11/11–2.htm.
Associated Data
This section collects any data citations, data availability statements, or supplementary materials included in this article.