

Abstract
The increased threat of radiological terrorism and accidental nuclear exposures, together with increased usage of radiation-based medical procedures, has made necessary the development of minimally invasive methods for rapid identification of exposed individuals. Genetically predisposed radiosensitive individuals comprise a significant number of the population and require specialized attention and treatments after such events. Metabolomics, the assessment of the collective small molecule content in a given biofluid or tissue, has proven effective in the rapid identification of radiation biomarkers and metabolic perturbations. To investigate how the genotypic background may alter the ionizing radiation (IR) signature, we analyzed urine from Parp1−/− mice, as a model radiosensitive genotype, exposed to IR by utilizing the analytical power of liquid chromatography coupled with mass spectrometry (LC–MS), as urine has been thoroughly investigated in wild type (WT) mice in previous studies from our laboratory. Samples were collected at days one and three after irradiation, time points that are important for the early and efficient triage of exposed individuals. Time-dependent perturbations in metabolites were observed in the tricarboxylic acid pathway (TCA). Other differentially excreted metabolites included amino acids and metabolites associated with dysregulation of energy metabolism pathways. Time-dependent apoptotic pathway activation between WT and mutant mice following IR exposure may explain the altered excretion patterns, although the origin of the metabolites remains to be determined. This first metabolomics study in urine from radiation exposed genetic mutant animal models provides evidence that this technology can be used to dissect the effects of genotoxic agents on metabolism by assessing easily accessible biofluids and identify biomarkers of radiation exposure. Applications of metabolomics could be incorporated in the future to further elucidate the effects of IR on the metabolism of Parp1−/− genotype by assessing individual tissues.
Keywords: Metabolomics, DNA repair, Urine, Ionizing radiation, Biomarkers
1. Introduction
In past decades, exposure to ionizing radiation (IR) has increased, particularly for diagnostic and therapeutic purposes. One of the primary concerns, however, remains the threat of radiological terrorism, radiological incidents such as the Fukushima Daiichi accident, and accidental exposures. Rapid identification of exposed individuals with new high-throughput methods can provide early assessment of exposure, within a few hours or days, that can be further fine-tuned through classical yet more time laborious techniques, such as cytogenetics, for effective and appropriate triage and administration of medical treatment. In accordance with the Radiation and Nuclear Countermeasures Program of the National Institute of Allergy and Infectious Diseases (NIAID), our laboratory has focused on identification and characterization of metabolic biomarkers in urine from WT rodents, non-human primates, and total body irradiated humans within the first week post radiation exposure [1–9].
However, through epidemiological studies of the atomic bomb survivors [10,11], Chernobyl, and medical exposures [12], unique populations have begun to emerge that are more radiosensitive than the general population. Females and the pediatric population in particular have been identified as radiosensitive groups [13]. Studies with diagnostic computed tomography (CT) have identified a small risk of radiation-induced cancers in children, and have thus increased awareness to reduce unnecessary medical diagnostic exposures [14,15]. Increased erythema, early after single dose irradiation or following a number of fractions, has also been observed in a number of radiotherapy patients, sometimes severe enough to halt the radiation treatment [16]. A reason for the underlying radiosensitivity is attributed to genetics and therefore, based on inherent genetic mutations and polymorphisms, 2–4% of the general population can be considered radiosensitive [17] and should be treated appropriately. Rapid identification of these individuals can provide medical personnel with appropriate information for personalized medical intervention [18] for both therapeutic planning and radiation injury assessment. To date, biomarkers associated with underlying genetic changes and models for prediction of outcome and cancer risk are not well defined or explored.
Increased radiosensitivity has been strongly associated with mutations in DNA repair associated genes. Base excision repair (BER) is an important pathway associated with IR damage, as it protects cells from oxidative damage [19]. The Poly(ADP-ribose) polymerase 1 (PARP1) protein, the most widely-expressed protein of the PARP family, recognizes not only single-strand breaks and facilitates their repair, but also recruits the BER repair machinery and catalyzes the polymerization of ADP-ribose units from donor NAD+ molecules to target proteins [20]. With low levels of DNA damage, PARP1 can act as a survival factor, while with high levels of DNA damage, it can promote cell death [20]. Parp1−/− mice, a genetic model that is highly radiosensitive, exhibit protection against oxidative stress-induced cell death in the short-term and increase in intracellular NAD+ with subsequent enhanced SIRT1 (NAD-dependent deacetylase sirtuin-1) activity [21,22]. In the long term, mice with this genotype exhibit increased NAD+ availability with subsequent mitochondrial biogenesis and lipid oxidation gene expression, improved β-cell regeneration, and enhanced energy expenditure [22,23]. Less known is the mitochondrial localization of PARP1 and its function. Unlike its role in the nucleus, mitochondrial localization of PARP1 shows that the protein is a negative regulator of mtDNA transactions and repair [24,25]. Depletion of PARP1 leads to increased bioenergetics parameters, including increased activity of TCA cycle enzymes, respiratory reserve capacity, and overall tolerance to oxidative stress [25] and therefore metabolic disease. Taken together, PARP1 is not only a significant component for efficient nuclear DNA repair, but is also a major regulator of metabolism. Mutations in this gene in the human population have been linked to increased risk for cancer susceptibility [26,27].
As such, Parp1−/− mice should exhibit altered metabolic markers when compared to wild type (WT) mice, particularly following exposure to IR. In fact, radiation exposed mice are highly radiosensitive due to increased DNA damage accumulation, G2 arrest and subsequent mitotic catastrophe. This in turn can affect the overall radiation metabolic signature in biofluids and tissues, therefore allowing for the specific identification of particular radiosensitive populations. To test this hypothesis, we employed modern liquid chromatography mass spectrometry (LC–MS) techniques to assess the urinary metabolome of WT and Parp1−/− mice exposed to semi-lethal doses of gamma radiation. The results primarily show perturbations in the TCA cycle that are time-dependent between the two genotypes. These significantly altered levels of metabolites combined with other identified biomarkers, such as amino acids, demonstrate the ability of metabolomics to identify IR and genotype-specific differences in an exposed population.
2. Materials and methods
2.1. Chemicals
All chemicals were of the highest purity available and reagents were of LC–MS grade. All chemicals, utilized as internal standards and for tandem mass spectrometry, were purchased from Sigma-Aldrich (St. Louis, MO, USA), except hexanoylglycine, which was purchased from ONBIO Inc. (Ontario, Canada).
2.2. Animal studies, radiation exposure, and sample collection
Mice homozygous for the knockout mutation in Parp1 (common name ADPRT−) were obtained from the Jackson Laboratory (129S-Parp1tm1Zqw/J) along with wild type (WT) mice from the same vendor and bred at Georgetown University. All animal breeding and radiation studies were conducted according to Georgetown University Institutional Animal Care and Use Committee (GUACUC) protocols (#13-003). Mice were bred and housed at Georgetown University, provided water and food ad libitum, and housed under 12 h light and 12 h dark cycle conditions. Male mice were used for the experiments, 8–10 weeks old at the time of the experiment. A radiation dose that confers an approximate equal percentage of survival vs death (40% survival) was determined to be equal to 6 Gy by Masutani et al. [28] for the Parp1−/− genotype. An approximate equitoxic dose for the WT mice was determined to be 8.8 Gy, as shown in Supplementary Fig. 1. Briefly, 8–10 mice were exposed to either 8.5 or 8.8 Gy, approximately equally distribution in groups, and observed and weighed daily for 30 days. Mice were euthanized when in distress or total body weight loss exceeded 15% of the initial weight, according to IACUC guidelines. Percent survival was calculated and graphed with a Kaplan-Meier curve through the software Prism 6 (GraphPad Software, Inc.). For further studies and comparisons, WT mice were also exposed to an equidose of 6 Gy. The numbers of mice per group are provided in Supplementary Table 1. Mice were exposed to gamma rays with 137Cs source at a dose rate of ∼1.67 Gy/min. Urine collection has been described in detail elsewhere [5]. Mice were euthanized at one day (D1) or three days (D3) after irradiation. Lung and kidney tissues were collected and snap frozen in liquid nitrogen. The urine samples, lung and kidney tissues were stored at −80 °C until further use.
2.3. Sample processing and data acquisition
Urine samples were analyzed as previously described [5,7]. Briefly, urine was deproteinized with 50% acetonitrile: 50% water and 2 μL were injected into an Acquity UPLC H-Class (Waters Corporation, MA) equipped with a BEH C18 column, 130 Å, 2.1 × 50 mm coupled to a Xevo G2 Time-of-Flight mass spectrometer (Waters Corporation, UK) (LC–MS). The capillary voltage was set to 2.5 kV and the source temperature to 120°C. The column temperature was set to 40 °C with a flow rate of 0.5 mL/min. Quality controls (QC) samples were created by pooling samples, deproteinized in an identical manner as individual samples and run every twenty samples for assessment of chromatographic quality and retention time drift. Centroided data was acquired in both positive and negative ionization modes (mass range 50–1200 m/z) with MSE function.
Intermittent injections of leucine enkephalin ([M+H]+= 556.2771 and [M−H]− = 554.2615) in 50% acetonitrile: 50% water + 0.1% formic acid at 2 ng/mL as Lock-Spray® allowed for maintenance of mass accuracy throughout the whole run.
2.4. Data processing, statistical analysis, and validation
Data processing was performed with the software Progenesis QI (Nonlinear Dynamics, Newcastle, UK). Creatinine abundance levels ([M+H]+ = 114.0662) were used for normalization at D1 after irradiation and ion abundances were normalized to all compounds for the D3 samples. Data analysis was performed with the in-house statistical software package MetaboLyzer [29]. Outliers were removed from analysis via 1.5 IQR filtering, zero values were excluded in standard statistical analysis, and a false discovery rate (FDR) correction was applied. Complete-presence ions, which are defined as ions having a presence in at least 75% of the samples in both control and experimental groups, were analyzed via the Mann-Whitney U test for statistical significance (p<0.05, FDR ≤ 0.2). Partial-presence ions, which are defined as ions having a 75% presence in only one group, were analyzed categorically via the Barnard's test for statistical significance (p< 0.05, FDR ≤ 0.2). Pathway annotation and putative identity assignment were performed with a ppm error of <10 and utilizing the metabolite databases HMDB, KEGG, and BioCyc [30–33]. Multidimensional scaling (MDS) plots were constructed by using the top 100 ions as ranked through the machine-learning algorithm Random Forests. Tandem mass spectrometry (MS/MS) was performed with ramping collision energy from 5 to 50 eV. Fragmentation patterns of each putative metabolite were compared and matched to fragmentation patterns of pure chemicals and/or through the MS/MS database METLIN [34].
Graphical representation of mean ± standard error of the mean (SEM) were prepared using Prism 6 (GraphPad Software, Inc.). One-way analysis of variance (ANOVA) was used when comparing within multiple groups. Receiver Operating Characteristic (ROC) curves were constructed to determine the specificity and sensitivity of each validated metabolite in a binary fashion. A p-value of <0.05 was considered statistically significant in all cases.
2.5. Western blotting
For protein expression analysis, frozen lung and kidney tissue (10 mg) from each time point and condition were transferred into RIPA buffer (Thermo Scientific, Waltham, MA) containing protease inhibitors (Sigma-Aldrich, St.Louis, MO) and homogenized thoroughly. The samples were centrifuged and the protein concentration was assessed in the supernatant (BCA protein assay, Thermo Scientific). Total protein (10 μg) from each sample was used for Western blotting and immunoblotted with citrate synthase mAb (1:1000, Proteintech), cleaved caspase-3 (Asp175) mAb (1:1000, Cell Signaling Technology), lactate dehydrogenase mAb (1:1000, Cell Signaling Technology), and β-actin (1:1000, Santa Cruz Biotechnology). The target proteins were detected by Amer-sham Imager 600 (GE Health, Pittsburgh, PA). Quantification was performed with the software ImageJ (National Institutes of Health, Bethesda, MD).
2.6. 8-oxo-dG ELISA assay
The detection and quantification of 8-oxo-dG adducts in DNA from lung and kidney tissue was performed per the manufacturer's specifications (Trevigen, Inc., Gaithersburg, MD). Briefly, DNA was extracted with the PAXgene Tissue DNA kit (Qiagen, Gaithersburg, MD). DNA samples were applied directly on the wells and final absorbance following incubation with the antibodies supplied in the kit was read at 450 nm. Calculations of the final concentration were conducted with a spreadsheet provided by Trevigen
2.7. Citrate synthase activity assay
The citrate synthase activity was determined with the MitoCheck citrate synthase activity assay kit (Cayman Chemical, Ann Arbor, MI) and calculated per the manufacturer's directions. The activity was measured in tissue homogenates from lung and kidney of three independent animals per group and assessed at 412 nm.
3. Results
MDS construction from the top one hundred ions as ranked through RF (Fig. 1A) shows the time effect on the urinary global metabolomic profiles, where on D1 the highest separation appears on dimension 1 signifying the effect of the genotypic differences, while on D3 further separation on dimension 2 indicates the effect of radiation exposure on the overall metabolome. Creatinine levels were assessed as a means of normalization to account for glomerular filtration rates in both D1 and D3, prior to any rigorous data analysis. As depicted in Fig. 2, creatinine levels did not differ statistically at the D1 post irradiation time point. However, variability was increased at D3 (as indicated in a scatter plot in Supplementary Fig. 2), specifically within the irradiated groups, indicating possible radiation injury to the kidney. Normalization to all compounds, a method that has been previously used to account for creatinine differences and minimize the variance [7], was applied to the D3 data. To explain this normalization method briefly, one run was chosen automatically from the software that exhibited the lowest pooled variance. Ratios were created for each compound with regards to the reference and logged to yield a normal distribution. The logged ratio distribution was centered onto the normalization reference, allowing also for the removal of the influence of outliers.
Fig. 1.
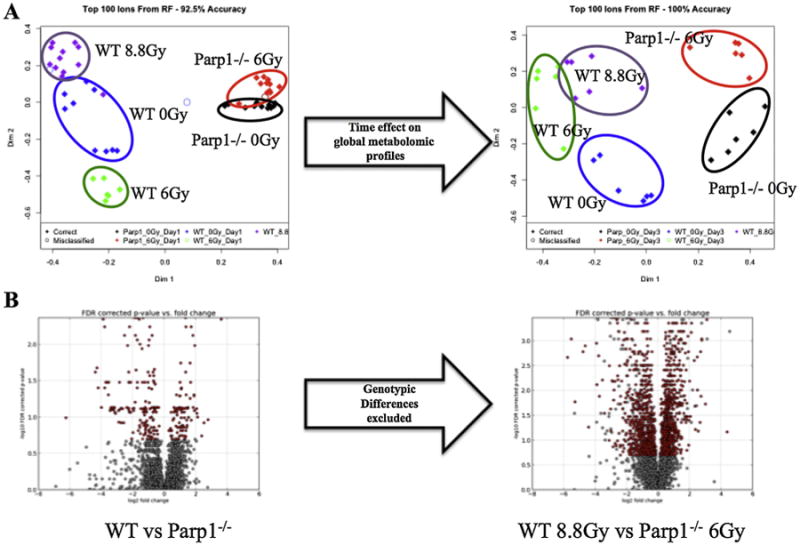
Global metabolomic profiling of urine samples from WT and Parp1−/− mice, with and without exposure to ionizing radiation. A. Multidimensional scaling plots of D1 and D3 post exposure samples reveal the time effect on the radiation signatures and the variation within the groups. B. The volcano plot on the left (WT vs Parp1−/−) depicts the statistically significant differences in urine between the two genotypes (red). Those inherent differences were excluded from the generation of the volcano plot comparing semi-lethally irradiated groups of mice (WT 8.8 Gy vs Parp1−/− 6 Gy) to demonstrate the dysregulation of metabolism from radiation exposure.
Fig. 2.

Excretion levels of urinary metabolites at Day 1 and 3 post irradiation. Relative abundance of creatinine shows the statistically significant differences evident in the D3 samples, with increased levels in the irradiated groups signifying kidney injury. Therefore, D1 samples were normalized to their respective creatinine levels, while D3 samples were normalized to all compounds, a method through the software Progenesis QI. Normalized abundance levels of validated metabolites in urine from unexposed and exposed mice are shown. Evident is a generalized dampening of responses in the Parp1−/− mice compared to WT in the D1 samples, with delayed increased excretion in the D3 samples. Results are represented as mean±SEM, p-values *≤0.05, **≤0.01, ***≤0.001, ****≤0.0001.
Statistically significant differences of combined ESI+ and ESI− features (complete-presence ions) are shown as a volcano plot in Fig. 1B. The volcano plot on the left shows the existence of significant urinary metabolic differences based solely on genotype, and the volcano plot on the right shows the effect of equitoxic doses of IR on metabolism based on the underlying genotypic variability, with baseline genotypic differences excluded from the analysis. Significant dysregulation of the metabolism is observed through the number of statistically significant ions (red). A volcano plot of the results of both genotypes being exposed to equidoses of 6 Gy is presented in Supplementary Fig. 3.
Statistically significant ion identification and characterization was based on the D1 samples, and levels of each validated ion were further investigated in the D3 samples. Through MetaboLyzer, putative identities were assigned to each ion based on results from HMDB and KEGG database searches. Pathway annotation was based on the BioCyc database and graphically presented in Supplementary Fig. 4, displaying energy related pathways as some of the major contributors to the phenotypic differences, both before and after IR. A generalized suppression of metabolic changes is observed in the Parp1−/− responses to IR, in comparison to WT. One prominently significant pathway in the analyses was the tricarboxylic acid (TCA) cycle. Other severely impacted pathways were also associated with some aspect of energy metabolism, i.e. pentose phosphate pathway, fatty acid β-oxidation, pyruvate fermentation to lactate among others. Eleven ions were validated through MS/MS, of which ten were identified as statistically significant through the Mann-Whitney U test. These ions consist of 2-ketobutyric acid, hexanoylglycine, flavin mononucleotide (FMN), cortisol, taurine, 2-oxoglutaric acid (alpha-ketoglutaric acid), cis-aconitic acid, malic acid, citric acid (or citrate), and 4-pyridoxic acid. Creatine levels were also assessed, as creatine is a precursor to creatinine. Specific identifiers and p-values for each metabolite are presented in Supplementary Table 2, along with general metabolic pathway involvement of each metabolite. The mean values for each group are presented in Supplementary Table 3, along with the ANOVA p-values. The only value consistently not statistically significant among groups in both time points was creatine (D1 p = 0.5912 and D3 p = 0.2118).
The TCA cycle, as one of the more prominent pathways exhibiting significant perturbations, is shown in Fig. 3, with graphical representation of the validated ions for D1 and D3. As evident, increased excretion of TCA cycle products is seen on D1 for irradiated WT mice, with levels either returning to normal or reduced by D3. The opposite pattern is apparent for irradiated Parp1−/− mice, with increased TCA cycle product excretion at D3. Unlike the results by Szczesny et al. [25], the citrate synthase protein levels and protein activity extracts from Parp1−/− mice did not differ substantially from WT (Fig. 4 and Supplementary Fig. 5), in both lung and kidney tissue. Citrate synthase activity was only significantly altered in D3 in the kidney tissue between WT-6 Gy vs Parp1−/−-6 Gy and Parp1−/−-Sham vs Parp1−/−-6 Gy. These results are indicative of kidney injury involvement in the increased levels of TCA cycle products and particularly citric acid in the urine of irradiated Parp1−/− mice. On the other hand, levels of lactate dehydrogenase, the enzyme for conversion of pyruvate to lactic acid, were higher on D1 in kidney tissue of WT irradiated mice, indicating a possible shift towards lactic acidosis following loss of TCA cycle metabolites, although the abundance levels of putative lactic acid in the urine did not reveal any statistically significant perturbations (data not shown). Regarding direct products of oxidative stress however, assessment of the 8-oxo-dG adducts in both tissues showed increased levels in both lung and kidney with more prominent increases in the Parp1−/− irradiated mice, although no statistical significance was observed. We further looked into possible elucidation of biomarker presence in urine by evaluating the levels ofcaspase-3 in whole tissue extracts as a means of apoptotic activation (Fig. 4). There was no clear indication of cleaved caspase-3 and initiation of apoptotic pathways (data not shown), although higher levels of the precursor protein in irradiated WT (lung tissue) could be indicative of a possible later initiation of apoptosis. However, studies in Parp1−/− primary fibroblast cells from MEFs exposed to DNA damaging agents, in this case MNU, are indicative of early initiation of apoptosis in the first 4–6 h [35]. These results of altered apoptotic fate can provide answers regarding the processes that contribute to the presence of metabolites in urine, as levels are time-dependent, however further studies will be necessary to fully dissect these processes.
Fig. 3.

Tricarboxylic acid (TCA) cycle specific metabolites. Differences in the TCA cycle are more prominent in the urine of WT mice at day 1 (D1) post irradiation. Reduced TCA cycle products in Parp1−/− mice could correspond to increased overall intracellular TCA cycle activity. Known increased levels of NAD+ in these mice and subsequent activation of Sirt1 could activate this metabolic pathway to maintain the energetic needs of the organism. At day 3 (D3) post irradiation however, increased levels of NAD+ may lead to increased TCA cycle activation in the irradiated Parp1−/− mice, with higher level of intermediates evident in urine. Alternatively, efficient apoptosis in WT mice could be responsible for the TCA cycle products in urine at D1, whereas mitotic catastrophe may be responsible for the D3 observations. Results are represented as mean ± SEM, p-values *≤0.05, **≤0.01, ****≤0.0001.
Fig. 4.

Expression and semi-quantitative analysis of proteins. Western blot analysis of citrate synthase, lactate dehydrogenase, and the active form ofcaspase-3 in lung tissue from sham and irradiated mice at D1 and D3 post irradiation. A. Representative images, B. Semi-quantification of lung band intensities normalized to the intensity of β-actin.
The remaining validated ions (creatine, 2-ketobutyric acid, 4-pyridoxic acid, cortisol, FMN, hexanoylglycine, and taurine) are presented in Fig. 2. In D1, 2-ketobutyric acid, cortisol, and FMN are more responsive in irradiated WT mice, hexanoylglycine is limited to irradiated Parp1−/−, and taurine is a marker for the equitoxic doses for both WT and Parp1−/− mice, as has been previously identified in the C57BL/6 mouse strain [5,36]. At D3, the individual metabolic profiles are significantly altered, with 2-ketobutyric acid, creatine, taurine, and cortisol showing increased excretion only in Parp1−/− mice, while hexanoylglycine and FMN are increased in both irradiated genotypes.
To investigate the sensitivity and specificity of each marker for their predictive ability, ROC curves were constructed (WT Sham vs Parp1−/− Sham, WT 8.8 Gy vs Parp1−/− 6 Gy, and WT 6 Gy vs Parp1−/− 6 Gy). The results are presented in Table 2. Markers with area under the curve (AUC) values of 0.7–0.8 are considered fair markers, 0.8–0.9 good markers, and 0.9–1.0 excellent markers, and p<0.05 is considered statistically significant (in bold in the table). With these criteria, radiation signatures begin to emerge for both equitoxic and equidose comparisons at D1. Markers with the best AUC and lower p-values at D1 (WT8.8 Gy vsParp1−/− 6 Gy)include 2-ketobutyric acid, cortisol, 2-oxoglutaric acid, citric acid, and cis-aconitic acid. Markers with the best AUC and p-values at D3 (WT 8.8 Gy vs Parp1−/− 6 Gy) include hexanoylglycine, FMN, and cis-aconitic acid. To the contrary, populations exposed to equitoxic doses (6 Gy) show a higher number of significant ions, indicating the possible association of these metabolites with the very early stages of the hematopoietic syndrome attributed to semi lethal doses. Based on this analysis, the radiation signature persists at D3, although its predictive power is reduced.
Table 2.
Construction of Receiver Operating Characteristic (ROC) curves determines the specificity and sensitivity of each markers in a binary analysis (bold indicates statistically significant values, p < 0.05).
| ROC curve Results Day 1 | WT Sham vs Parp1−/− Sham | WT 8.8 Gy vs Parp1−/− 6 Gy | WT 6 Gy vs Parp1−/− 6 Gy | |||
|---|---|---|---|---|---|---|
|
|
|
|
||||
| AUC | p-value | AUC | p-value | AUC | p-value | |
| 2-ketobutyric acid | 0.73 | 0.06 | 0.92 | 0.0005 | 0.74 | 0.11 |
| Creatine | 0.52 | 0.85 | 0.54 | 0.73 | 0.79 | 0.05 |
| Hexanoylglycine | 0.50 | 1.00 | 0.67 | 0.17 | 0.86 | 0.01 |
| Flavin Mononucleotide | 0.57 | 0.58 | 0.59 | 0.45 | 0.83 | 0.02 |
| Cortisol | 0.67 | 0.18 | 0.93 | 0.0003 | 0.85 | 0.02 |
| Taurine | 0.66 | 0.20 | 0.75 | 0.04 | 0.99 | 0.001 |
| 2-Oxoglutaric acid (alpha-Ketoglutaric acid) | 0.77 | 0.03 | 0.94 | 0.0002 | 0.78 | 0.06 |
| cis-Aconitic acid | 0.52 | 0.90 | 0.76 | 0.03 | 0.79 | 0.05 |
| Malic acid | 0.51 | 0.95 | 0.63 | 0.27 | 0.92 | 0.01 |
| Citric acid | 0.57 | 0.58 | 0.83 | 0.01 | 0.69 | 0.19 |
| 4-Pyridoxic acid | 0.80 | 0.02 | 0.52 | 0.86 | 0.69 | 0.19 |
| ROC curve Results Day 3 | WT Sham vs Parp1−/− Sham | WT 8.8 Gy vs Parp1−/− 6 Gy | WT 6 Gy vs Parp1−/− 6 Gy | |||
|
|
|
|
||||
| AUC | p-value | AUC | p-value | AUC | p-value | |
|
| ||||||
| 2-ketobutyric acid | 0.73 | 0.06 | 0.61 | 0.52 | 0.94 | 0.01 |
| Creatine | 0.56 | 0.75 | 0.64 | 0.42 | 0.78 | 0.11 |
| Hexanoylglycine | 1.00 | 0.004 | 1.00 | 0.004 | 1.00 | 0.004 |
| Flavin Mononucleotide | 0.69 | 0.26 | 0.89 | 0.03 | 0.72 | 0.20 |
| Cortisol | 0.90 | 0.02 | 0.75 | 0.15 | 0.72 | 0.20 |
| Taurine | 0.67 | 0.34 | 0.81 | 0.08 | 0.94 | 0.01 |
| 2-Oxoglutaric acid (alpha-Ketoglutaric acid) | 0.75 | 0.15 | 0.58 | 0.63 | 0.94 | 0.01 |
| cis-Aconitic acid | 0.67 | 0.34 | 0.92 | 0.02 | 1.00 | 0.004 |
| Malic acid | 0.56 | 0.75 | 0.56 | 0.75 | 0.75 | 0.15 |
| Citric acid | 0.67 | 0.34 | 0.75 | 0.15 | 0.89 | 0.03 |
| 4-Pyridoxic acid | 0.69 | 0.26 | 0.64 | 0.42 | 0.75 | 0.15 |
4. Discussion
As basic research has begun to show, a common understanding is emerging that specific outcomes (i.e. lethality, cancer risk) and treatments should be approached from an individualized perspective. Animal survival studies have demonstrated that two identically treated animals of same sex, age, and genetic background may have different outcomes. However, the effect of genetics on individual radiosensitivity has been well documented through syndromes with DNA repair damage mutations [i.e. ataxia telangiectasia, Fanconi anemia, Nijmegen breakage syndrome [37]]. Evidence of such individual radiosensitivity has also accrued from radiotherapy cases, where the incidence of erythema following radiation treatment for breast cancer is more prevalent in a number of women, and severity in some cases leads to interruption of the therapeutic regimen [38,39].
Metabolomic assessment of radiation responses has provided ample biomarkers in easily accessible biofluids, such as urine and blood. Research in different species (mice, rats, non-human primates, humans) has provided cross-species validation of the consistency of specific metabolites as radiation markers [6,9,36,40,41] in time points within the first week post irradiation, that is consistent with the Radiation and Nuclear Countermeasures Program's objectives. The effect of genotype, however, has yet to be investigated with regards to how it may alter the radiation metabolomic signature, and subsequently the medical triage necessary for these special populations. To address this issue, we explored the urine from WT and Parp1−/− mice exposed to semi-lethal doses with LC–MS approaches. WT mice irradiated with an LD50/30 dose typically expire from hematopoietic failure after the second week of irradiation. The doses and time points were chosen to comply with NIAID priorities, since individuals exposed to high doses will require immediate medical intervention following a radiological event, such as hematopoietic stem cell transplantation and cytokine administration. While creatinine levels remained relatively unchanged at D1 and were therefore utilized for urinary normalization, at D3 levels were significantly elevated in irradiated groups, signifying kidney injury. Although we have not explored creatinine levels past this time point, radiation-induced kidney injury (direct or indirect) has been well documented and is an area of intense research [42–44]. Increased levels of creatine, the precursor to creatinine, have also been identified in a dose-dependent manner, and maybe attributed to radiation muscle injury [9,41,45].
Despite its well-recognized nuclear role, PARP1 localization assays have shown that the protein is also localized in mitochondria with opposing roles to its nuclear counterpart [21,22,24,25]. Parp1−/− mice are characterized by enhanced energy expenditure and increased number of mitochondrial content, particularly in brown adipose tissue and muscle [22]. Differences in energy-related pathways were also observed in urine through pathway enrichment (Supplementary Fig. 4), where some of the most prevalent pathways included fatty acid β-oxidation, the TCA cycle, l-carnitine biosynthesis, and acetyl-CoA biosynthesis from citric acid. We can therefore conclude that the TCA cycle, which takes place in the mitochondria, and its products, with the ultimate goal being the generation of ATP, will be severely affected not only in Parp1−/− mice, but in any IR exposed mice as well. Although in our studies the citrate synthase activity assay from whole tissue homogenates did not show differences in activity between sham WT and sham Parp1−/− based on the citrate synthase activity assay, taken together with the lower protein levels in both lung and kidney could indicate a higher enzyme efficiency in both tissues resulting in increased citric acid levels. Furthermore, increased activity of the enzyme in D3 in both genotypes irradiated with 6 Gy could further explain the presence of citric acid in urine. Additionally, increased intracellular pools of NAD+, since PARP1 absence cannot utilize NAD as a substrate for PARPylation of proteins, may further activate the TCA NAD+ dependent cycle in Parp1−/− mice. Our studies indeed demonstrate that markers of mitochondrial involvement following radiation exposure can be identified in urine. Products of the TCA cycle showed a marked increased excretion in the first 24 h after irradiation in WT mice. However, while levels returned to normal in WT, the Parp1−/− mice exhibited a “delayed” response with respect to this metabolic pathway. Considering this result, it can be assumed that there is a significant shift towards the TCA cycle instead of the glycolytic pathway in intermediate product excretion. Additionally, since Parp1−/− mice have increased mitochondrial content [22], they may be able to deal with the radiation-induced oxidative stress more efficiently at least temporarily, as shown by the levels of 8-oxo-dG present in DNA (Supplementary Fig. 6) that remain stable in lung but are efficiently cleared by D3 in kidney. This is consistent with the observations of Hooten et al. [46] of reduced expected 8-oxoG levels in response to DNA-damaging agents following PARP1 inhibition; the clearing of the lesions in WT mice however can be attributed to efficient BER. Ultimately, the significant damage from the high doses leads to leakage of mitochondrial contents and increased concentrations of the metabolites in urine.
A combination of the TCA cycle metabolites and various others shown in Table 1 contribute to the generation of a radiation-specific signature for the Parp1−/− genotype and demonstrate the ability of metabolomics to identify genotypic differences and responses to genotoxic agents. Fold-changes of irradiated Parp1−/− vs WT (equitoxic doses and equidoses) show a generalized decrease in the overall responses, implying an increased response of the metabolome in WT with regards to radiation exposure. The increased levels of metabolites may be attributed to increased necrosis in the WT mice, as apoptosis may not have been initiated yet (Fig. 4), at least in lung tissue. As mentioned earlier [35], exposure of Parp1−/− cells to genotoxic agents leads to apoptosis initiation at 4–6 h after exposure and the clearance of those intercellular products through urine elimination. PARP1 activation in WT cells and consequent drop in NAD and ATP levels in response to DNA damage may block damaged cells from undergoing apoptosis, as ATP is required for this process, and instead die by necrosis, increasing TCA product excretion at D1 [47]. Parp1−/− cells, on the other hand, maintain NAD and ATP levels to some extent and undergo apoptosis to clear damaged cells earlier. Increases of the urinary small molecule urinary content at a later time point may further implicate mitotic catastrophe, resulting from inability to repair DNA damage lesions. However, future assessment of the apoptosis in different tissues and assessment of the investigated processed in mitochondria vs cytosolic components may provide answers as to the tissue origin of the urinary biomarkers.
Table 1.
Fold changes of validated metabolites at Day-1 and Day-3 post irradiation.
| Metabolite | Fold changes at Day 1 after irradiation | ||||
|---|---|---|---|---|---|
|
| |||||
| Parp1−/− Sham/WT Sham | WT (8.8 Gy/Sham) | Parp1−/− (6 Gy/Sham) | Parp1−/− 6 Gy/WT 8.8 Gy | Parp1−/− 6 Gy/WT 6 Gy | |
| 2-Ketobutyric acid | 0.81 | 1.27 | 0.92 | 0.59 | 0.81 |
| Creatine | 1.03 | 1.00 | 1.07 | 1.10 | 1.57 |
| Hexanoylglycine | 1.01 | 1.05 | 1.28 | 1.24 | 1.51 |
| Flavin Mononucleotide | 1.10 | 1.01 | 1.03 | 1.13 | 0.59 |
| Cortisol | 0.24 | 3.13 | 0.86 | 0.07 | 0.08 |
| Taurine | 1.10 | 1.29 | 1.37 | 1.16 | 1.74 |
| 2-Oxoglutaric acid (alpha-Ketoglutaric acid) | 0.71 | 1.33 | 0.94 | 0.50 | 0.73 |
| cis-Aconitic acid | 0.99 | 1.26 | 1.05 | 0.82 | 0.78 |
| Malic acid | 0.88 | 1.39 | 0.62 | 0.39 | 0.37 |
| Citric acid | 0.89 | 1.28 | 1.03 | 0.72 | 0.89 |
| 4-Pyridoxic acid | 0.73 | 0.76 | 1.02 | 0.98 | 1.11 |
| Metabolite | Fold changes at Day 3 after irradiation | ||||
|
| |||||
| Parp1−/− Sham/WT Sham | WT (8.8 Gy/Sham) | Parp1−/− (6 Gy/Sham) | Parp1−/− 6 Gy/WT 8.8 Gy | Parp1−/− 6 Gy/WT 6 Gy | |
|
| |||||
| 2-Ketobutyric acid | 0.79 | 0.95 | 2.33 | 1.93 | 3.89 |
| Creatine | 1.16 | 1.35 | 1.66 | 1.42 | 2.25 |
| Hexanoylglycine | 2.23 | 1.76 | 1.54 | 1.95 | 2.56 |
| Flavin Mononucleotide | 0.76 | 3.78 | 2.33 | 0.47 | 0.63 |
| Cortisol | 0.02 | 0.94 | 8.70 | 0.20 | 0.49 |
| Taurine | 0.85 | 0.89 | 1.83 | 1.75 | 2.06 |
| 2-Oxoglutaric acid (alpha-Ketoglutaric acid) | 0.73 | 1.04 | 2.69 | 1.91 | 4.36 |
| cis-Aconitic acid | 1.11 | 0.77 | 1.30 | 1.88 | 2.26 |
| Malic acid | 0.84 | 0.78 | 1.57 | 1.70 | 2.29 |
| Citric acid | 0.86 | 0.80 | 1.84 | 1.98 | 2.96 |
| 4-Pyridoxic acid | 1.26 | 1.02 | 0.89 | 1.10 | 1.31 |
Furthermore, the construction of ROC curves provides indications of the possible utility of individual metabolites as biomarkers or in combination with others. Although the comparison between equitoxic doses allowed for the construction of a robust radiation signature at D1, it was the equidose comparison that showed stronger statistical significance. This implies that events associated with the hematopoietic syndrome contribute significantly to the generation of the urinary metabolomic signature. Similar results were shown recently by Li et al. [48], where IR leads to metabolic reprogramming of T cells with substantial effects on glucose uptake, glycolysis, and energy metabolism. It is therefore possible to not only identify exposed individuals through the urinary metabolic phenotype, but more importantly radiosensitive populations that will require more specialized medical attention.
While radiation metabolomics has been well established as a significant contributory technology in expanding the underlying metabolic mechanisms of radiation exposure, it has been primarily limited in areas of total body irradiations and WT organisms. Exploring the effects of genetics with regards to individual radiosensitivity allows us to further dissect the metabolic networks and generation of radiation signatures for countermeasure purposes. This first metabolomics urinary study with genetic mutant mice has provided us with information regarding the energy metabolism and the differences in metabolic markers that can allow identification of exposed and radiosensitive populations and the administration of appropriate triage in case of a radiological incident.
5. Conclusions
Rapid identification of radiation-exposed individuals can be conducted with high throughput technologies such as metabolomics. However, identification of radiosensitive populations that require special medical management has not been fully explored. In Parp1−/− mice, used as a model radiosensitive genotype, that were exposed to a semi-lethal dose radiation metabolomic signatures were constructed specific for D1 or D3 post IR. The metabolic perturbations also pointed to a generalized energy metabolism dysregulation that was distinct between D1 and D3, involving primarily intermediate products of the TCA cycle. Finally, the distinct excretion patterns between WT and Parp1−/− mice may be attributed to different mechanisms of cell death in the different genotypes. Taken together, this first study of metabolomics of radiation exposed genetic mutant models in an easily accessible biofluid such as urine illustrates the ability to differentiate not only exposed from unexposed populations, but also take into account the contribution of the genetic background. Future directions of comprehensive tissue studies to specify the potential origin of these biomarkers will provide information on the physiology of an organism and specific tissue injury mechanisms following exposure to ionizing radiation.
Supplementary Material
Acknowledgments
This work was funded by the National Institutes of Health (National Institute of Allergy and Infectious Diseases) grant U19AI067773 (P.I. David J. Brenner, performed as part of the Columbia University Center for Medical Countermeasures against Radiation). The project described above was also supported by Award Number P30 CA051008 (P.I. Louis Weiner) from the National Cancer Institute. The content is solely the responsibility of the authors and does not necessarily represent the official views of the National Cancer Institute or the National Institutes of Health. The authors would like to thank Ms. Pelagie Ake and Mr. Bo-Hyun Moon for assistance with breeding and genotyping, Mr. Victor Jolly for preparation of chemical standards for MS/MS, and Mr. Anirudh Gaur for help with the western blots. We would also like to thank the Lombardi Comprehensive Cancer Proteomics & Metabolomics Shared Resource (PMSR) for data acquisition, particularly Dr. Amrita Cheema and Ms. Kirandeep Gill.
Abbreviations
- IR
ionizing radiation
- LC
liquid chromatography
- MS
mass spectrometry
- TCA
tricarboxylic acid
- WT
wild type
- CT
computed tomography
- PARP1
poly(ADP-ribose)polymerase 1
- BER
base excision repair
- SIRT1
sirtuin-1
- D1
day 1
- D3
day 3
- HMDB
the Human Metabolome Database
- KEGG
Kyoto encyclopedia of genes and genomes
- QC
quality control
- FDR
false discovery rate
- SEM
standard error of the mean
- ANOVA
one-way analysis of variance
- ROC
receiver characteristic curves
- FMN
flavin mononucleotide
Footnotes
Conflict of interest: The authors declare that there are no conflicts of interest.
Appendix A. Supplementary data: Supplementary data associated with this article can be found, in the online version, at http://dx.doi.org/10.1016/j.mrfmmm.2016.03.003.
References
- 1.Coy SL, Cheema AK, Tyburski JB, Laiakis EC, Collins SP, Fornace AJ., Jr Radiation metabolomics and its potential in biodosimetry. Int J Radiat Biol. 2011;87:802–823. doi: 10.3109/09553002.2011.556177. [DOI] [PMC free article] [PubMed] [Google Scholar]
- 2.Goudarzi M, Weber W, Mak TD, Chung J, Doyle-Eisele M, Melo D, et al. Development of urinary biomarkers for internal exposure by cesium-137 using a metabolomics approach in mice. Radiat Res. 2014;181:54–64. doi: 10.1667/RR13479.1. [DOI] [PMC free article] [PubMed] [Google Scholar]
- 3.Goudarzi M, Mak TD, Chen C, Smilenov LB, Brenner DJ, Fornace AJ., Jr The effect of low dose rate on metabolomic response to radiation in mice. Radiat Environ Biophys. 2014;53:645–657. doi: 10.1007/s00411-014-0558-1. [DOI] [PMC free article] [PubMed] [Google Scholar]
- 4.Goudarzi M, Weber WM, Mak TD, Chung J, Doyle-Eisele M, Melo DR, et al. A comprehensive metabolomic investigation in urine of mice exposed to strontium-90. Radiat Res. 2015;183:665–674. doi: 10.1667/RR14011.1. [DOI] [PMC free article] [PubMed] [Google Scholar]
- 5.Laiakis EC, Hyduke DR, Fornace AJ., Jr Comparison of mouse urinary metabolic profiles after exposure to the inflammatory stressors γ radiation and lipopolysaccharide. Radiat Res. 2012;177:187–199. doi: 10.1667/rr2771.1. [DOI] [PMC free article] [PubMed] [Google Scholar]
- 6.Laiakis EC, Mak TD, Anizan S, Amundson SA, Barker CA, Wolden SL, et al. Development of a metabolomic radiation signature in urine from patients undergoing total body irradiation. Radiat Res. 2014;181:350–361. doi: 10.1667/RR13567.1. [DOI] [PMC free article] [PubMed] [Google Scholar]
- 7.Laiakis EC, Trani D, Moon BH, Strawn SJ, Fornace AJ., Jr Metabolomic profiling of urine samples from mice exposed to protons reveals radiation quality and dose specific differences. Radiat Res. 2015;183:382–390. doi: 10.1667/RR3967.1. [DOI] [PMC free article] [PubMed] [Google Scholar]
- 8.Mak TD, Tyburski JB, Krausz KW, Kalinich JF, Gonzalez FJ, Fornace AJ., Jr Exposure to ionizing radiation reveals global dose- and time-dependent changes in the urinary metabolome of rat. Metabolomics. 2015;11:1082–1094. doi: 10.1007/s11306-014-0765-4. [DOI] [PMC free article] [PubMed] [Google Scholar]
- 9.Pannkuk EL, Laiakis EC, Authier S, Wong K, Fornace AJ., Jr Global metabolomic identification of long-term dose-dependent urinary biomarkers in nonhuman primates exposed to ionizing radiation. Radiat Res. 2015;184:121–133. doi: 10.1667/rr14091.1. [DOI] [PMC free article] [PubMed] [Google Scholar]
- 10.Miles EF, Tatsukawa Y, Funamoto S, Kamada N, Nakashima E, Kodama Y, et al. Biomarkers of radiosensitivity in a-bomb survivors pregnant at the time of bombings in hiroshima and nagasaki. ISRN Obstet Gynecol. 2011;2011:264978. doi: 10.5402/2011/264978. [DOI] [PMC free article] [PubMed] [Google Scholar]
- 11.Wakeford R, Little MP, Kendall GM. Risk of childhood leukemia after low-level exposure to ionizing radiation. Expert Rev Hematol. 2010;3:251–254. doi: 10.1586/ehm.10.25. [DOI] [PMC free article] [PubMed] [Google Scholar]
- 12.Gilbert ES. Ionising radiation and cancer risks: what have we learned from epidemiology. Int J Radiat Biol. 2009;85:467–482. doi: 10.1080/09553000902883836. [DOI] [PMC free article] [PubMed] [Google Scholar]
- 13.Protection R. ICRP publication 103. Ann ICRP. 2007;37:168–193. doi: 10.1016/j.icrp.2007.10.003. 2. [DOI] [PubMed] [Google Scholar]
- 14.Boice JD. Radiation epidemiology and recent paediatric computed tomography studies. Ann ICRP. 2015;44:236–248. doi: 10.1177/0146645315575877. [DOI] [PubMed] [Google Scholar]
- 15.Brenner DJ. What we know and what we don't know about cancer risks associated with radiation doses from radiological imaging. Br J Radiol. 2014;87:20130629. doi: 10.1259/bjr.20130629. [DOI] [PMC free article] [PubMed] [Google Scholar]
- 16.Glover D, Harmer V. Radiotherapy-induced skin reactions: assessment and management. Br J Nurs. 2014;23(S28):S30–S35. doi: 10.12968/bjon.2014.23.Sup2.S28. [DOI] [PubMed] [Google Scholar]
- 17.Health risks from exposure to low levels of ionizing radiation: BEIR VII Phase 2. 2006;xvi, 406, Ch. 3 [PubMed] [Google Scholar]
- 18.Twardella D, Chang-Claude J. Studies on radiosensitivity from an epidemiological point of view— overview of methods and results. Radiother Oncol. 2002;62:249–260. doi: 10.1016/s0167-8140(01)00491-1. [DOI] [PubMed] [Google Scholar]
- 19.Patrono C, Sterpone S, Testa A, Cozzi R. Polymorphisms in base excision repair genes: breast cancer risk and individual radiosensitivity. World J Clin Oncol. 2014;5:874–882. doi: 10.5306/wjco.v5.i5.874. [DOI] [PMC free article] [PubMed] [Google Scholar]
- 20.Kim MY, Zhang T, Kraus WL. Poly(ADP-ribosyl)ation by PARP-1: ‘PAR-laying’ NAD+ into a nuclear signal. Genes Dev. 2005;19:1951–1967. doi: 10.1101/gad.1331805. [DOI] [PubMed] [Google Scholar]
- 21.Bai P, Cantó C, Oudart H, Brunyánszki A, Cen Y, Thomas C, et al. PARP-1 inhibition increases mitochondrial metabolism through SIRT1 activation. Cell Metab. 2011;13:461–468. doi: 10.1016/j.cmet.2011.03.004. [DOI] [PMC free article] [PubMed] [Google Scholar]
- 22.Bai P, Cantó C. The role of PARP-1 and PARP-2 enzymes in metabolic regulation and disease. Cell Metab. 2012;16:290–295. doi: 10.1016/j.cmet.2012.06.016. [DOI] [PubMed] [Google Scholar]
- 23.Módis K, Gero D, Erdélyi K, Szoleczky P, Dewitt D, Szabo C. Cellular bioenergetics is regulated by PARP1 under resting conditions and during oxidative stress. Biochem Pharmacol. 2012;83:633–643. doi: 10.1016/j.bcp.2011.12.014. [DOI] [PMC free article] [PubMed] [Google Scholar]
- 24.Rossi MN, Carbone M, Mostocotto C, Mancone C, Tripodi M, Maione R, et al. Mitochondrial localization of PARP-1 requires interaction with mitofilin and is involved in the maintenance of mitochondrial DNA integrity. J Biol Chem. 2009;284:31616–31624. doi: 10.1074/jbc.M109.025882. [DOI] [PMC free article] [PubMed] [Google Scholar]
- 25.Szczesny B, Brunyanszki A, Olah G, Mitra S, Szabo C. Opposing roles of mitochondrial and nuclear PARP1 in the regulation of mitochondrial and nuclear DNA integrity: implications for the regulation of mitochondrial function. Nucleic Acids Res. 2014;42:13161–13173. doi: 10.1093/nar/gku1089. [DOI] [PMC free article] [PubMed] [Google Scholar]
- 26.Alanazi M, Pathan AA, Abduljaleel Z, Arifeen Z, Shaik JP, Alabdulkarim HA, et al. Association between PARP-1 V762A polymorphism and breast cancer susceptibility in Saudi population. PLoS One. 2013;8:e85541. doi: 10.1371/journal.pone.0085541. [DOI] [PMC free article] [PubMed] [Google Scholar]
- 27.Alshammari AH, Shalaby MA, Alanazi MS, Saeed HM. Novel mutations of the PARP-1 gene associated with colorectal cancer in the Saudi population. Asian Pac J Cancer Prev. 2014;15:3667–3673. doi: 10.7314/apjcp.2014.15.8.3667. [DOI] [PubMed] [Google Scholar]
- 28.Masutani M, Nozaki T, Nakamoto K, Nakagama H, Suzuki H, Kusuoka O, et al. The response of Parp knockout mice against DNA damaging agents. Mutat Res. 2000;462:159–166. doi: 10.1016/s1383-5742(00)00033-8. [DOI] [PubMed] [Google Scholar]
- 29.Mak TD, Laiakis EC, Goudarzi M, Fornace AJ., Jr MetaboLyzer: a novel statistical workflow for analyzing postprocessed LC–MS metabolomics data. Anal Chem. 2014;86:506–513. doi: 10.1021/ac402477z. [DOI] [PMC free article] [PubMed] [Google Scholar]
- 30.Caspi R, Altman T, Billington R, Dreher K, Foerster H, Fulcher CA, et al. The MetaCyc database of metabolic pathways and enzymes and the BioCyc collection of pathway/genome databases. Nucleic Acids Res. 2014;42:D459–D471. doi: 10.1093/nar/gkt1103. [DOI] [PMC free article] [PubMed] [Google Scholar]
- 31.Kanehisa M, Goto S. KEGG: Kyoto encyclopedia of genes and genomes. Nucleic Acids Res. 2000;28:27–30. doi: 10.1093/nar/28.1.27. [DOI] [PMC free article] [PubMed] [Google Scholar]
- 32.Kanehisa M, Goto S, Sato Y, Kawashima M, Furumichi M, Tanabe M. Data, information, knowledge and principle: back to metabolism in KEGG. Nucleic Acids Res. 2014;42:D199–D205. doi: 10.1093/nar/gkt1076. [DOI] [PMC free article] [PubMed] [Google Scholar]
- 33.Wishart DS, Jewison T, Guo AC, Wilson M, Knox C, Liu Y, et al. HMDB3.0— the Human Metabolome Database in 2013. Nucleic Acids Res. 2013;41:D801–D807. doi: 10.1093/nar/gks1065. [DOI] [PMC free article] [PubMed] [Google Scholar]
- 34.Smith CA, O'maille G, Want EJ, Qin C, Trauger SA, Brandon TR, et al. METLIN: a metabolite mass spectral database. Ther Drug Monit. 2005;27:747–751. doi: 10.1097/01.ftd.0000179845.53213.39. [DOI] [PubMed] [Google Scholar]
- 35.De Murcia JM, Niedergang C, Trucco C, Ricoul M, Dutrillaux B, Mark M, et al. Requirement of poly(ADP-ribose) polymerase in recovery from DNA damage in mice and in cells. Proc Natl Acad Sci U S A. 1997;94:7303–7307. doi: 10.1073/pnas.94.14.7303. [DOI] [PMC free article] [PubMed] [Google Scholar]
- 36.Tyburski JB, Patterson AD, Krausz KW, Slavík J, Fornace AJ, Jr, Gonzalez FJ, et al. Radiation metabolomics. 1. Identification of minimally invasive urine biomarkers for gamma-radiation exposure in mice. Radiat Res. 2008;170:1–14. doi: 10.1667/RR1265.1. [DOI] [PMC free article] [PubMed] [Google Scholar]
- 37.Pollard JM, Gatti RA. Clinical radiation sensitivity with DNA repair disorders: an overview. Int J Radiat Oncol Biol Phys. 2009;74:1323–1331. doi: 10.1016/j.ijrobp.2009.02.057. [DOI] [PMC free article] [PubMed] [Google Scholar]
- 38.Harper JL, Franklin LE, Jenrette JM, Aguero EG. Skin toxicity during breast irradiation: pathophysiology and management. South Med J. 2004;97:989–993. doi: 10.1097/01.SMJ.0000140866.97278.87. [DOI] [PubMed] [Google Scholar]
- 39.Valentin J. Radiopathology of skin and eye and radiation risk. Ann ICRP. 2000;30:25–31. [Google Scholar]
- 40.Johnson CH, Patterson AD, Krausz KW, Kalinich JF, Tyburski JB, Kang DW, et al. Radiation metabolomics. 5. Identification of urinary biomarkers of ionizing radiation exposure in nonhuman primates by mass spectrometry-based metabolomics. Radiat Res. 2012;178:328–340. doi: 10.1667/rr2950.1. [DOI] [PMC free article] [PubMed] [Google Scholar]
- 41.Mak TD, Tyburski JB, Krausz KW, Kalinich JF, Gonzalez FJ, Fornace AJ., Jr Exposure to ionizing radiation reveals global dose-and time-dependent changes inthe urinary metabolome of rat. Metabolomics. 2014:1–13. doi: 10.1007/s11306-014-0765-4. [DOI] [PMC free article] [PubMed] [Google Scholar]
- 42.Kurland IJ, Broin PÓ, Golden A, Su G, Meng F, Liu L, et al. Integrative metabolic signatures for hepatic radiation injury. PLoS One. 2015;10:e0124795. doi: 10.1371/journal.pone.0124795. [DOI] [PMC free article] [PubMed] [Google Scholar]
- 43.Tran LK, Maturen KE, Feng MU, Wizauer E, Watcharotone K, Ellis JH. Renal remodeling inthe first 24 months after abdominal radiotherapy. Pract Radiat Oncol. 2013;3:S6. doi: 10.1016/j.prro.2013.01.021. [DOI] [PubMed] [Google Scholar]
- 44.Tran LK, Maturen KE, Feng MU, Wizauer EJ, Watcharotone K, Parker RA, et al. Renal remodeling after abdominal radiation therapy: parenchymal and functional changes. AJR Am J Roentgenol. 2014;203:W192–W198. doi: 10.2214/AJR.13.12149. [DOI] [PubMed] [Google Scholar]
- 45.Gerber GB, Gertler P, Altman KI, Hempelmann LH. Dose dependency of radiation-induced creatine excretion in rat urine. Radiat Res. 1961;15:307–313. [PubMed] [Google Scholar]
- 46.Noren Hooten N, Kompaniez K, Barnes J, Lohani A, Evans MK. Poly(ADP-ribose) polymerase 1 (PARP-1) binds to 8-oxoguanine-DNA glycosylase (OGG1) J Biol Chem. 2011;286:44679–44690. doi: 10.1074/jbc.M111.255869. [DOI] [PMC free article] [PubMed] [Google Scholar]
- 47.Surjana D, Halliday GM, Damian DL. Role of nicotinamide in DNA damage, mutagenesis, and DNA repair. J Nucleic Acids. 2010;2010 doi: 10.4061/2010/157591. [DOI] [PMC free article] [PubMed] [Google Scholar]
- 48.Li HH, Wang YW, Chen R, Zhou B, Ashwell JD, Fornace AJ., Jr Ionizing radiation impairs T cell activation by affecting metabolic reprogramming. Int J Biol Sci. 2015;11:726–736. doi: 10.7150/ijbs.12009. [DOI] [PMC free article] [PubMed] [Google Scholar]
Associated Data
This section collects any data citations, data availability statements, or supplementary materials included in this article.