

Abstract
Pathological features in Alzheimer’s brains include mitochondrial dysfunction and dystrophic neurites (DNs) in areas surrounding amyloid plaques. Using a mouse model that overexpresses reticulon 3 (RTN3) and spontaneously develops age-dependent hippocampal DNs, here we report that DNs contain both RTN3 and REEPs, topologically similar proteins that can shape tubular endoplasmic reticulum (ER). Importantly, ultrastructural examinations of such DNs revealed gradual accumulation of tubular ER in axonal termini, and such abnormal tubular ER inclusion is found in areas surrounding amyloid plaques in biopsy samples from AD brains. Functionally, abnormally clustered tubular ER induces enhanced mitochondrial fission in the early stages of DN formation and eventual mitochondrial degeneration at later stages. Furthermore, such DNs are abrogated when RTN3 is ablated in aging and AD mouse models. Hence, abnormally clustered tubular ER can be pathogenic in brain regions: disrupting mitochondrial integrity, inducing DNs formation and impairing cognitive function in AD and aging brains
Keywords: Reticulon, RTN3, REEP2, REEP5, tubular endoplasmic reticulum, dystrophic neurites, neuritic plaques, BACE1, Alzheimer’s disease, mitochondrial dynamics
INTRODUCTION
Alzheimer’s disease (AD) is the most common neurodegenerative disease and aging is the most common predisposing factor for the onset of AD and cognitive dysfunction (1). In brains of Alzheimer’s patients, common pathological features are the presence of amyloid plaques, neurofibrillary tangles and dystrophic neurites (DNs), as well as mitochondrial dysfunction (2, 3). Over the past two decades, many genetic and biochemical studies have revealed various molecular mechanisms that contribute to these pathological features (4-6). However, how changes in tubular endoplasmic reticulum (ER) contribute to AD pathologies has never been reported. This study provides both biochemical and morphological evidence that dysfunctional tubular ER induces increases in mitochondrial fission and formation of DNs, two commonly observed pathologies in AD brains.
The link between dysfunctional tubular ER and AD pathogenesis stems from our systematic study of DN origin using human and mouse brain samples. Tubular ER is part of the smooth ER structure and reticulon/Nogo proteins have been identified as tubular ER resident proteins, which function to shape tubular ER structure (7). The reticulon (RTN) family of proteins consists of four members (RTN1 to RTN4) in humans and rodents; each RTN protein is distinguished by the presence of a conserved C-terminal membrane-bound reticulon-homology domain (RHD), while the N-terminal sequences are completely divergent (8-10). The RHD dictates the RTN ω-shape membrane topology in which both the N- and C-terminal domains face the cytosolic side (7, 11). RTN proteins have been previously shown to interact with Alzheimer’s β-secretase (BACE1) and to negatively modulate BACE1 cleavage of amyloid precursor protein (APP) in releasing Aβ peptides, which are major components of amyloid plaques (12, 13). Intriguingly, RTN3, the main RTN expressed by neurons, is also abnormally enriched in DNs and can label broad and abundant populations of DNs in AD brains (14).
Despite the fact that a number of proteins such as APP, neurofilament, ubiquitin, and GAP-43 are reported to label DNs in areas surrounding amyloid plaques in AD brains (15-17), the finding of RTN3 in DNs is more important because RTN3 is the first known protein that can actively participate in forming DNs(18)[17]18[18]18(Hu et al., 2007)[17](Hu et al., 2007)18. We have demonstrated that transgenic mice overexpressing RTN3 under the control of prion promoter (Tg-RTN3) spontaneously develop DNs, also named as RTN3-immunoreactive dystrophic neurites (RIDNs), in Tg-RTN3 hippocampi in an age-dependent manner (18). Such RIDNs can also naturally occur in aging wild-type mouse hippocampi (19), excluding possible artificial formation of RIDNs in this transgenic mouse model. More significantly, our functional and morphological studies demonstrate that the density of RIDNs correlates with impaired cognitive function (18, 20), implicating it as a contributing factor in aging and AD cognitive dysfunction.
To determine how RTN3 is enriched in RIDNs, we conducted a molecular study of RIDNs. We now show that RIDNs in a mouse model and in AD brains contain REEP2 and REEP5, which are ER proteins topologically similar to RTNs and also localized in the tubular ER (7); other types of ER structural proteins including ER stress proteins are not enriched within RIDNs. Morphological examinations of Tg-RTN3 mouse hippocampi revealed that formation of RIDNs was due to gradual accumulation of tubular ER in axonal termini. Such abnormally clustered tubular ER was readily detected in swollen axonal termini from biopsy samples of AD brains. Functionally, abnormally clustered tubular ER was clearly dysfunctional, as enhanced mitochondrial fission was correspondingly induced in the early stages of RIDN formation. Eventually, excessive clusters of tubular ER causes mitochondrial degeneration at later stages. We also demonstrate that dysfunctional tubular ER-associated RIDNs are abrogated when RTN3 is ablated in aging and AD mouse models.
Hence, we show for the first time that clustering tubular ER is functionally impaired, as manifested by disrupted mitochondrial dynamics in aging and AD brains. RTN3, previously identified as a negative modulator of BACE1 (21), appears to play a critical role in this process via altering tubular ER organization. Our data suggest that targeting normal tubular ER organization is an alternative therapeutic strategy for preserving mitochondrial integrity and synaptic function.
Materials and Methods
Mouse strains, cell lines, human biopsy samples, and reagents
Tg-RTN3 mice and RTN3-null mice were generated and genotyping was performed as described previously(18, 22). Tg-APPsw/PSEN1DE9 mice (Tg-PA) were purchased from Jackson Laboratory (stock #004462). RTN3-null; APPsw/PSEN1DE9 mice (R3KOPA) were generated by crossing RTN3-null mice with APPsw/PSEN1DE9 mice. All mice in the study were maintained and used according to protocols approved by the Institutional Animal Care and Use Committee of the Cleveland Clinic Foundation. Human embryonic kidney 293 (HEK-293) cells were maintained at 37°C in a humidified, 5% CO2-controlled atmosphere in Dulbecco’s modified Eagle’s medium supplemented with 10% fetal bovine serum, 50 IU/ml penicillin, 50 mμ/ml streptomycin, and glutamine.
Human biopsy samples were taken from the frontal cortex of two patients (aged 55 and 64 years) who had been included in other clinico-pathological studies with a definite history and clinical presentation of dementia and fulfilling the NINCDSADRDA working group criteria for probable AD. Corresponding tissue from two non-AD control cases (aged 35 and 64 years) were also studied.
All RTN antibodies were generated in the Yan lab. Antibodies R458 and R459 recognize the C terminus of RTN3 and R461 is an antibody specific to the RTN4 C terminus and recognizes all RTN4-A, RTN4-B and RTN4-C isoforms (21). RTN1 and RTN2 antibodies were recently generated in the Yan lab and react with the C terminus of RTN1 or RTN2. Antibodies against Aβ-amyloid peptide (6E10; catalog #NE1003-100UL, RRID: AB_564201), calnexin (C4731, RRID: AB_476845), flag (catalog# F 1804), PDI (catalog # P7496), REEP3 (catalog # SAB 2900870), REEP4 (catalog # HPA042683), and spastin (catalog # S7074) were purchased from Sigma-Aldrich. Antibodies against FIS1 (catalog# 10956-1-AP), GRP78 (BIP, HSPA5; catalog # 11587-1-AP), MFF (catalog # 17090-1AP), MFN1 (catalog # 13798-1-AP), MFN2 (catalog # 12186), REEP1 (catalog # 17988-1-AP), REEP2 (catalog # 15684-1-AP), REEP5 (catalog # 14643-1-AP), and REEP6 (catalog # 12088-1-AP) were purchased from Protein Tech. Anti-DLP1 (catalog #611112) antibody was purchased from BD Transduction Lab. Anti-atlastin (catalog # 2728) antibody was obtained from Cell Signaling Technology. DP1 (K-20; catalog # sc-610) and anti-myc (catalog # SC-40) were purchased from Santa Cruz Biotechnology, Inc. Alexa Fluor 488- and 568-labeled secondary antibodies were purchased from Invitrogen. Complete protease inhibitor tablets were purchased from Roche Biosciences. Four to 12% Bis-Tris NuPAGE gels were purchased from Invitrogen. All RTN3 mutants were prepared as described previously (23).
Immunoprecipitation and western blot assays
For immunoprecipitation experiments with Tg-RTN3 mice brain extract, snap-frozen brain sections were homogenized on ice in 1% CHAPS extraction buffer containing complete protease inhibitors (Roche Bioscience) and 0.1 mM Na3VO4 for inhibiting phosphatase. The homogenates were rotated for 30 min at 4°C to ensure extraction of membrane proteins. After centrifugation at 15,000xg for 120 min, supernatants were collected and protein concentrations were measured with the BCA protein assay reagent (Pierce). Immunoprecipitation with transfected cell lysate was performed as described previously (23). Briefly, HEK293 cells were first grown in Dulbecco’s modified Eagle’s medium for 24 h in 60-mm plates to ~80% confluence and then transfected with the indicated expression constructs. After being cultured for 48 h, cells were lysed and equal amounts of lysates (500μg in 1ml) were used for immunoprecipitation with Myc or Flag-conjugated beads overnight. The extensively washed immunoprecipitates were resolved on a 4–12% NuPage Bis-Tris gel purchased from Invitrogen for Western blot assays. Following incubation with the indicated primary antibody, an appropriate horseradish peroxidase-conjugated secondary antibody was added for incubation. Immunoreactivity was detected by chemiluminescence using Super Signal West PICO reagent (Pierce).
Immunohistochemistry and immunofluorescent confocal microscopy
Immunohistochemical and confocal experiments were performed according to standard methods as described previously(21). Brain tissues from AD patients and mice were sectioned in the sagittal plane at a 14 μm thickness using a cryostat after 4% paraformaldehyde fixation and O.C.T. compound embedding. Brain sections were stored at -80°C. After three washes in PBS (1x), sections were incubated in 0.3% Triton X-100 in PBS (1x) for 30 min. After additional washes in PBS (1x), sections were blocked in 5% goat serum in PBS (1x) for 30 min. Sections were then incubated with the indicated primary antibodies overnight. Sections were washed in PBS (1x) three times and incubated in secondary antibody goat anti-mouse or anti-rabbit IgG conjugated with either Alexa Fluor 488 or Alexa Fluor 568. Lipofucsinautofluorescence is common in human brain sections and produced robust auto-fluorescence in all confocal channels. To reduce auto-fluorescence, fixed AD brain sections were treated with 3% Sudan Black B for 10 min. Nuclei were stained using To-pro dye (1:1000) for 15 min. Images were examined and captured with a Leica SP5 confocal microscope.
Electron microscopy
All human biopsy and mouse brain tissues were fixed in 1.5% glutaraldehyde in cacodylate buffer and post-fixed with 1% osmium tetroxide for 1 h. Tissue was dehydrated in graded ethanols and propylene oxide, embedded in Epon 812, and sectioned at silver interference color. Grids were viewed at 60 kV using a JEOL 100CX electron microscope. Tissue obtained at biopsy was used to determine the cytoarchitecture of DNs in senile plaques. The state of preservation compared well with published studies of optimally preserved tissue taken from animals.
Tubular ER drawing, quantification of mitochondrial numbers, and measuring the size of mitochondria
Nine to ten EM pictures per mouse (three mice in each genotype) were obtained at 23000x magnification, focusing on the neurites near a cell body. The drawing of tubular structure, quantification of mitochondria, and measurement of each mitochondrial area were performed by experimenters blinded to genotypes of the mice. To draw the tubular ER, the cell body was first separated by drawing a thin line (blue) from nearby clustered neurites and the tubular structure in neurites was drawn using Image J software. Mitochondria in somata and in clustered neurites were counted from each EM microgram. The area of each mitochondrion was also quantified using Image J and the size of mitochondria was determined by normalizing obtained values with 1μm2 area scale of the same EM pictures.
RESULTS
Specific interactions between RTN3 and REEP proteins in neurons
To determine the in vivo role of RTN3 in forming RIDNs, we aimed to investigate the molecular composition of RIDNs by identifying proteins that co-exist with RTN3. By performing co-immunoprecipitation (co-IP) experiments using Tg-RTN3 mouse hippocampal protein lysates, we screened a panel of proteins, mainly ER-related or vesicle trafficking proteins, for potential interactions with RTN3. The proteins examined included calnexin, calreticulin, protein disulfide isomerase (PDI), human glucose regulated protein 78 (GRP78), double strand RNA activated protein kinase endoplasmic reticulum kinase (PERK), ATF-6, IRE1, atlastin-1, DP1, spastin, REEP family members, GM130, EEA1, Rab5, APP, etc. We found that only REEP2 and REEP5 effectively co-IPed with RTN3 (see examples in Figure 1a). The rodent REEP family has six members (24) and the interaction between RTN3 with other REEP members in cortical or hippocampal neurons were not detected (data not shown). Unlike the prior report of morphogen complex which contains RTN, REEP, atlastin and spastin (25), we also failed to detect interaction between RTN3 with spastin or atlastin under our IP condition.
Figure 1. Interactions between proteins from the REEP and RTN families.
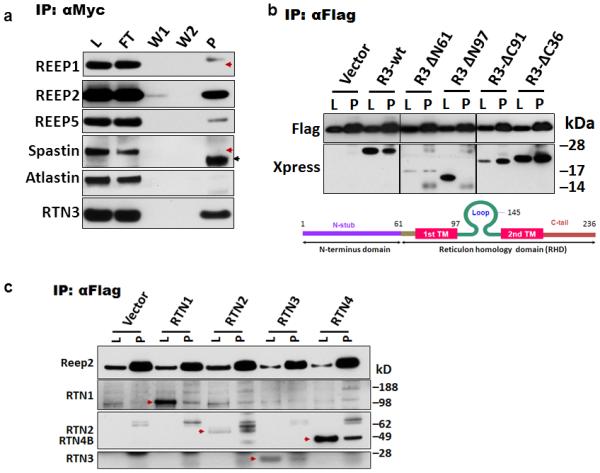
(a) Protein lysates prepared from hippocampi of transgenic mice overexpressing RTN3-myc (Tg-RTN3) were used to immunoprecipitate with myc-antibody. L, protein lysates; FT, flowthrough; W1 and W2, fractions after being washed once and twice; P, precipitated fractions. Red arrowheads refer to the expected size of proteins and black arrowheads indicate IgG light chains. (b) HEK-293 cells were co-transfected with Xpress-tagged RTN3 deletion mutant constructs and flagged-tagged REEP2 and transfected cells were used for co-immunoprecipitation. The names of each construct are depicted by the deleted numbers of residues from either the N-terminal (N) or C-terminal (C) end. Domains in RTN3 and relative positions in the deletion constructs are illustrated in the diagrams. Empty vector construct was co-expressed in control conditions. (c) Flag-tagged REEP2 was co-expressed with RTN1 to RTN4 in HEK-293 cells and protein lysates (L) were precipitated with flagged antibody. The relevant RTN member is specified by red arrowheads.
To further verify the interaction between RTN3 and REEPs, we conducted a domain mapping assay by utilizing various previously-generated RTN3 truncated mutant constructs (23). We showed that the mutated RTN3 (R3ΔN97), lacking the first transmembrane (TM1) domain, failed to co-IP with ectopically-expressed REEP2, while all other RTN3 truncated mutants effectively co-IPed with REEP2 (Figure 1b). The RTN3 mutant (R3ΔC91), lacking the second TM, did not significantly affect the interaction with REEP2. These results suggest that the TM1 domain of RTN3 is more critical for the proper docking of RTN3 on the membrane and for interactions with REEP proteins.
We also tested whether REEP2 interacts with other members of the RTN family (RTN1, RTN2 and RTN4), as all RTN members have a common TM1 region within the RHD domain. Co-IP results showed that REEP2 effectively interacted with all RTN family members (Figure 1c). Since RTN and REEP proteins are suggested to shape tubular ER, these two families of proteins should have resided in close proximity. Our confocal staining confirmed co-localization of these two proteins in cultured COS7 cells (data not shown).
RIDNs contain only tubular ER proteins
Next, we asked whether interactions between RTN3 and REEP proteins impact the formation of RIDNs. Fixed brain sections of Tg-RTN3 mice were immunostained with REEP2 or REEP5 antibody. Remarkably, both REEP2 and REEP5 antibodies specifically labeled neuronal somata and RIDNs in the hippocampal region where RIDNs are developed in this mouse model overexpressing myc-tagged RTN3; no RIDNs were formed in cortical regions of Tg-RTN3 mice and only neurons were positive in staining (Figure 2a). The merged panels show that RTN3 and REEP2 or REEP5 largely co-existed in the hippocampus (Figure 2, merged), indicating that RIDNs contain another family of tubular ER-shaping proteins. This is the first evidence that two families of tubular shaping ER proteins co-exist in RIDNs.
Figure 2. Detection of RIDNs in Tg-RTN3 mouse brains by REEP2 and REEP5.


(a) Fixed Tg-RTN3 mouse brain samples were stained with antibody specific to REEP2 or REEP5 (green) and myc monoclonal antibody (red). Merged panels show almost complete co-existence of RTN3-myc with REEP2 or REEP5. Postmortem brains from AD patients (b) or brains from an AD mouse model (Tg-APPsw/PS1ΔE9 mouse; c) were used to locate RIDNs using a RTN3 antibody (R459) or a REEP5 antibody. The size of RIDNs in Tg-APPsw/PS1ΔE9 mouse brains was smaller when compared to that in human AD samples. The size of each scale bar is specified.
We further examined whether REEPs would also label RIDNs in AD brains. An antibody specific to REEP5 was found to label abundant RIDNs, similar to that shown by RTN3 antibody (Figure 2b). In addition, REEP5 similarly labeled RIDNs in transgenic mice overexpressing swAPP/PS1DE9 (Figure 2c). Noticeably, the size of RIDNs in the AD mouse model was significantly smaller, perhaps related to the age-dependent growth of RIDNs. It should be noted that RIDNs are uniquely labeled by tubular shaping ER proteins REEP2/5 and RTN3, as many other ER proteins, such as the smooth ER protein calnexin (top panels in Supplemental Figure 1) and the ER membrane enzyme PDI (middle panels in Supplemental Figure 1) are not found in RIDNs. ER stress-related proteins, such as GRP78 (lower panels in Supplemental Figure 2), ATF-6, IRE1, and PERK (data not shown), which are more enriched in the ER cisternae (flat ER), were also absent in RIDNs. Taken together, these data show that REEP protein family members label abundant populations of DNs in AD brains similar to RTN3 and that RIDNs predominantly accumulate tubular ER proteins, rather than general smooth ER or stress-activated ER proteins.
Clustering of axonal tubular ER in brains of AD mouse models and AD patients
The above observation prompted us to test a novel hypothesis that RIDNs originate from tubular ER and that aging facilitates tubular ER clustering. To test this hypothesis, we examined the tubular ER ultrastructure by standard electron microscopy (EM) using fixed hippocampal samples from wild-type (WT) and Tg-RTN3 mice. Compared to WT hippocampal samples, we observed that 3-month-old Tg-RTN3 mouse brain samples, which had just begun to develop RIDNs, showed curvier and shorter tubular ER clustered in axonal areas (ER tubules in yellow, Figure 3a-b; unmarked originals in Supplemental Figure 2a-b). At the age of 11 months, compared to normally distributed tubular ER in WT samples, the accumulation of clustered tubular ER in the axonal terminus was remarkable (Figure 3c) and tubular ER morphology was more evident in an enlarged view (see enlarged inset in Figure 3d). Clustered tubular ER was not seen in non-transgenic littermates (Supplemental Figure 2c-d). Clear accumulation of RTN3 within the tubular by ER body was validated immuno-EM results (Supplemental Figure 3). These results suggest that the alteration of tubular ER structure was the beginning of the formation of RIDNs and that tubular ER is abnormally distributed and appears to move toward the axon terminus in an age-dependent manner.
Figure 3. Ultrastructural examinations of RIDNs.


Three-month-old wild-type (a) or Tg-RTN3 (b) mouse hippocampi were examined by electron microscopy (EM). The tubular endoplasmic reticulum (ER) in axons, where synaptic vesicles are visible, is highlighted in yellow. The soma and initial segment of dendrites are highlighted in light blue. (c-d) Samples from 11-month-old Tg-RTN3 hippocampi were similarly examined by EM and clustered tubular ER was enriched in the axonal terminus (enlarged by approximately 3.5 times in d). (e-f) Biopsy samples from Alzheimer’s patients were fixed and examined by EM (enlarged approximately 7 times in f). The tubular ER network was clustered in the inclusion body. Scale bar is 1 μm in all panels.
To determine whether clustered tubular ER structures are present in human brains, we examined surgically-collected cortical biopsy samples from two AD patients and readily observed accumulation of abnormally clustered tubular ER structures within the inclusion body in all samples (Figure 3e; clearer morphology in the enlarged views in f). Such an abnormal tubular ER accumulation was not detected in non-demented control biopsies (data not shown). Thus, ultrastructural examination confirmed that abnormal accumulation of tubular ER is not only present in mouse models, but also in human AD brains, mainly as DN-like inclusion bodies.
Dysfunction of tubular ER
To understand whether clustering of tubular ER causes functional changes, we chose to examine mitochondrial dynamics first, as we noted changes in mitochondrial morphology. Mitochondria were visibly smaller in areas near clustered tubular ER in 2-month-old Tg-RTN3 brains when compared to controls (Figure 3b). Strikingly, mitochondria were either absent or barely visible when tubular ER was extensively enriched within the inclusion body in 11-month-old Tg-RTN3 brains (Figure 3d) and in human biopsy samples (Figure 3e). However, the morphology of mitochondria in other neuronal compartments, where tubular ER was not clustered, appeared comparable in size and electron density to WT controls. To validate this morphological difference, we quantified mitochondria and measured their sizes on captured EM micrograms. The average number of mitochondria was clearly increased in the Tg-RTN3 CA1 region (Figure 4a, 14.7142±1.8898 vs. 22.5714±3.9096 per microgram, n=28, P<0.01), while the size and area of mitochondria were significantly reduced (Figure 4b; 0.1699±0.0329 vs. 0.0980±0.0256 in areas, P<0.01), implicating an increase in mitochondrial fission. We noted that these obvious differences in mitochondrial numbers and sizes between WT and Tg-RTN3 CA1 regions were due to a significance increase in mitochondrial fission in tubular ER enriched area (TER, 6.5714±1.9023 vs. 15.8571±5.9561 for numbers and 0.1382±0.0349 vs. 0.0767±0.0107 for area, respectively; n=28, P<0.01), but not in somata, where rough and smooth flatted ER is enriched (8.1428±1.9518 vs. 6.7142±4.3861 with P=0.18 for numbers and 0.2027±0.0734 vs. 0.1476±0.0449 with P= 0.09 for area, respectively).
Figure 4. Increased mitochondrial fission in relation to abnormal clustering of tubular ER.

The number (a) and area (b) of mitochondria were analyzed based on the same magnification of EM micrograms imaged from 3-month-old wild-type and Tg-RTN3 hippocampal CA1 region. TER refers to tubular ER enriched area, mostly in neuritic regions. (c) Western blot analysis of brain lysates from 6-month-old wild-type and Tg-RTN3 mice was conducted using the specified antibodies. (d) Bar graph represents the normalization of the indicated protein over calnexin. Statistical significance was seen in cortical MFN-1 and hippocampal MFN-2 (n=6 in total, * P<0.05, student t-test).
To decipher the underlying molecular mechanism, we examined levels of proteins that are important for mitochondrial fusion and fission, such as MFN1, MFN2, DLP1, and FIS1. MFN2 levels were the most noticeably decreased in Tg-RTN3 hippocampi, where RIDNs are normally formed, but were less obvious in the cortex (Figure 4c-d). Changes in other examined proteins were less evident. Since tubular ER is suggested to contact mitochondria and to control mitochondrial dynamics in cells (26), altered tubular organization appears to disrupt such a balance.
Prevention of tubular ER clustering
Because levels of RTN3 appear to positively correlate with the formation of RIDNs and aging facilitates RTN3 expression (19, 27), we further asked whether RTN3 deletion would impact RIDN formation. Since we identified that REEP2 and REEP5 co-exist with RTN3 in RIDNs of Tg-RTN3 mice (Figure 2), it became possible to address such a question. By examining different ages of brain samples (3-24 months old), we showed that both REEP2 and REEP5, similar to RTN3 (19), existed in RIDNs in aged brains starting at 12 months of age and were more abundant at 24 months (Supplemental Figure 4a). However, contrary to the age-dependent expression of RTN3, protein levels of REEP2 and REEP5 were not altered during the aging process (Supplemental Figure 4b). When RTN3 expression was knocked out in mice (22), dispersed RIDNs were no longer detectable by REEP2 or REEP5 antibody in aging RTN3-null mice (Figure 5a), indicating that RTN3 deficiency is sufficient to prevent the formation of RIDNs. We also noted that REEP2 protein expression was not altered when RTN3 was ablated in mouse brains, but REEP5 protein levels appeared to be elevated (Figure 5b), likely in order to preserve certain tubular ER functions upon RTN3 deficiency. Together, out data suggest that the level of RTN3 is more critical for the formation of RIDNs during aging.
Figure 5. RTN3 deficiency abolished dystrophic neurites originating from dysfunctional tubular ER.


(a) Fixed brain samples (24 months old) from wild-type (WT) or RTN3-null mice were stained with antibodies against RTN3, REEP2, or REEP5. (b) Protein lysates from the indicated age were tested with antibodies to REEP1, REEP2, REEP5, and RTN3. Calnexin antibody served as a loading control. REEP5 levels were increased in the RTN3-null condition. (c-f) Brain samples (six months old) from PA (c and enlarged view in d) or R3KOPA hippocampi (e and the boxed area is enlarged by 2 times in f) were examined by electron microscopy. Scale bar is 1 μm in panel c and ~0.4 μm in panel e.
In an AD mouse model (i.e. Tg-APPsw/PS1ΔE9), we noted that DNs visualized by EM in fixed brain samples showed extensive accumulation of electron-dense materials, perhaps related to induced multi-laminar, multi-vesicular, or autophagic vesicles by overexpressed mutant APP (28, 29). Notably, the inclusion body that was filled with tubular ER was also present and was commonly found near amyloid plaques in Tg-APPsw/PS1ΔE9 hippocampi (abbreviated as PA in Figure 5c and enlarged in 5d). This type of inclusion body was no longer present when RTN3 was knocked out in Tg-APPsw/PS1ΔE9 hippocampi (R3KOPA samples; Figure 5e and enlarged in 5f). While the overexpression of mutant APP can also disrupt certain neuronal functions such as autophagic functions by facilitating the formation and accumulation of high density, multi-body, vacuole-like structures near amyloid plaques in transgenic mice, our data indicate that RTN3 is critical for the formation of DNs enriched in abnormally clustered tubular ER.
DISCUSSION
ER, the largest cellular organelle with a network-like membranous structure, consists of rough ER, which is associated with ribosomes and controls protein translation, and smooth ER, which includes the nuclear envelope, cytoplasmic cisternae, and tubules (30, 31). Smooth ER is more commonly distributed along the axon to mediate proper organization of the microtubule cytoskeleton and mitochondria (32, 33). Tubular ER is a part of smooth ER and emerging evidence suggests that it is likely to mediate vesicle transport and/or organelle contacts, to control cellular communications, and to regulate mitochondrial fusion and fission (34). RTN and REEP proteins are two identified classes of proteins that are required for the formation of tubular ER (35).
In established mammalian cell lines, both RTN and REEP proteins have been shown to be localized in the tubular ER (36-38). Interestingly, tubular ER in primary cultured hippocampal or cortical neurons and normal neurites has not yet been reported. Localization of RTN3-GFP along axons has been observed (36), but localization of RTN3-GFP in the tubular ER in neurites was not clear. By transfecting RTN3-GFP in cultured hippocampal neurons, we showed that RTN3-GFP was in a tubular structure within a bouton by highly magnified imaging (supplemental Figure 5). Hence, tubular ER is normally distributed along axons.
In this study, our biochemical, morphological, and mouse genetic results revealed an abnormal tubular ER distribution in hippocampal neurons, and such an abnormal distribution has never been reported. We show that a significant increase in neuronal RTN3 expression is sufficient to alter tubular ER organization by clustering tubular ER together, mainly in axons. RTN3 protein levels are elevated in aging mouse brain(19) and were not readily detectable in human brain samples under the age of 60, but were easily detectable in samples from people over the age of 65 under the same staining conditions (27). We noted that the levels of REEP2/5 were not significantly altered during aging (Supplemental Figure 4). Significantly elevated RTN3 during aging is likely sufficient to induce tubular ER clustering, demonstrating the physiological relevance.
How elevated RTN3 induces tubular ER clustering remains to be fully investigated. However, it is established that RTN3 can naturally form dimers, multimers, and oligomers as previously demonstrated (18-20). Likely, elevated expression of RTN3 in hippocampal neurons increases contacts between RTN3 or RTN3 and REEP2/5 on the ER tubules and alters tubular curvatures and eventually induces such abnormal clustering of tubular ER in axons. When tubular ER is no longer evenly distributed along axons, but instead is enriched as an inclusion body (aka, RIDNs), normal tubular ER distribution is disrupted. Future cellular model should be established for this validation.
Abnormal tubular ER distribution in axons causes pathological consequences. We show here that mitochondria, which are normally in contact with tubular ER, are eventually excluded from the tubular ER inclusion body (see Figure 3e, f). The loss of mitochondria in the inclusion body is not only seen in older Tg-RTN3 mouse brains, but also in AD biopsy samples (Figure 3d, e). The loss of normal mitochondria in DN-like inclusion bodies appears to be a sequential process, as increased mitochondrial fission occurred prior to or at the time of the formation of RIDNs (illustrated in Figure 6). Hence, abnormal clustering of tubular ER is deemed to cause tubular ER to become dysfunctional and this arises from impaired contacts between tubular ER and cellular organelles.
Figure 6. Schematic illustration of RIDNs containing clustered tubular ER.

Tubular ER is part of smooth ER, normally distributed along the axon; tubular ER in dendrites and soma are not illustrated. Increased RTN3 expression appears to induce abnormal distribution of tubular ER, especially at the axon terminus, where synaptic vesicles are visible. Increased tubular ER clustering appears sequential and is correlated with visible increases in smaller-sized mitochondria in the affected region. In aged Tg-RTN3 CA1 region, RIDNs are abundantly developed and tubular ER is often found within an inclusion body, where mitochondria are either absent or degenerated.
DNs are a distinguishing feature between diffuse and neuritic plaques in AD brains (15, 39-41). In AD mouse models overexpressing mutant APP, DNs are not detectable prior to the appearance of amyloid plaques (data not shown), indicating that deposition of Aβ can induce the formation of DNs in surrounding amyloid plaques. In APP AD mouse models, antibodies specific to N- or C-termini of APP can detect abundant DNs in surrounding amyloid plaques, relating to the trap of APP in DNs. Interestingly, APP-positive DNs in human AD brains were significantly less abundant than RIDNs (data not shown), indicating the difference between mouse models and AD brains. Although the molecular mechanism underlying the formation of DNs in AD brains is not yet fully understood, we have observed that at least two types of DNs are present in AD and APP mouse brains (Figure 5). DNs filled with high density multi-vesicles or autophagosomes have been previously reported (28, 29, 42), and this type of DN is commonly seen in both AD and APP mouse brains. We demonstrate here that RTN3-immunoreactive DNs are enriched mainly in clustered tubular ER and that this type of DN is age-dependent. We can easily detect clustered tubular ER by electron microscopy in human biopsy samples, indicating that this type of DN is a regular occurrence. Consistent with this observation, an early report showed DN-like inclusion bodies contained tubulovesicular profiles of smooth ER in all 6 brain biopsies of AD patients (43). Although this early study failed to describe tubular ER, a close comparison indicates that these ER profiles appear to be identical to the tubular ER clusters shown in Figure 3e and are also devoid of mitochondria or have only remnants of degenerated mitochondria. Since the density of RIDNs is correlated with impaired cognitive behaviors and the occurrence of RIDNs disrupts synaptic structures such as reducing spine density in mouse models (20), the finding of dysfunctional tubular ER within DNs in human brains implies a contribution of this pathology to cognitive impairments in AD patients.
In AD brains, another common pathological feature is increased mitochondrial fission (26). Our study suggests that abnormal tubular ER organization or clustering can be an upstream inducer that leads to increased fission and eventual mitochondrial dysfunction. Although we did not detect inclusion filled with clustered tubular ER in non-demented human brain biopsy, we cannot exclude the detection of such inclusion in other age-dependent cognition-impaired brains. Aging-dependent RIDNs are found in aging mouse brains (19). With the increasing longevity in human, the presence of such DNs to impair age-dependent cognitive function will be increasing. Hence, preventing abnormal distribution of tubular ER could benefit cognitive functions in AD and elderly people. It may also impede multiple pathogenic processes such as mitochondrial dysfunction and other tubular ER-dependent functions.
Supplementary Material
Acknowledgements
We thank Dr. Xinghua Yin for capturing EM images and Hisashi Fujioka (Case Western Reserve University EM facility) for immune-EM, Drs. Qinyuan Fan and Hailong Hou for their helpful discussions during the study, and Dr. Chris Nelson for critical reading of this manuscript. This work is partially supported by NIH grants to RY (AG025493, NS074256 and AG046929), and an award from Alzheimer’s Association (NPSPAD-10-174543) as well as a gift from the Scholtz family fund to RY. XZ was supported by NIH R01NS083385 and GP was supported by Alzheimer's Association (IIRG-13-284849) and the Semmes Foundation.
Footnotes
Conflict of Interests
All authors declare no conflict of interest in this study.
Reference List
- 1.Terry RD. Normal aging and Alzheimer's disease: growing problems. Monogr Pathol. 1990;(32):41–54. [PubMed] [Google Scholar]
- 2.DuBoff B, Feany M, Gotz J. Why size matters - balancing mitochondrial dynamics in Alzheimer's disease. Trends Neurosci. 2013 Jun;36(6):325–335. doi: 10.1016/j.tins.2013.03.002. [DOI] [PubMed] [Google Scholar]
- 3.Holtzman DM, Mandelkow E, Selkoe DJ. Alzheimer disease in 2020. Cold Spring Harb Perspect Med. 2012 Nov;2(11) doi: 10.1101/cshperspect.a011585. [DOI] [PMC free article] [PubMed] [Google Scholar]
- 4.Tanzi RE. The genetics of Alzheimer disease. Cold Spring Harb Perspect Med. 2012 Oct;2(10) doi: 10.1101/cshperspect.a006296. [DOI] [PMC free article] [PubMed] [Google Scholar]
- 5.Querfurth HW, LaFerla FM. Alzheimer's disease. N Engl J Med. 2010 Jan 28;362(4):329–344. doi: 10.1056/NEJMra0909142. [DOI] [PubMed] [Google Scholar]
- 6.De SB, Vassar R, Golde T. The secretases: enzymes with therapeutic potential in Alzheimer disease. Nat Rev Neurol. 2010 Feb;6(2):99–107. doi: 10.1038/nrneurol.2009.218. [DOI] [PMC free article] [PubMed] [Google Scholar]
- 7.Voeltz GK, Prinz WA, Shibata Y, Rist JM, Rapoport TA. A class of membrane proteins shaping the tubular endoplasmic reticulum. Cell. 2006 Feb 10;124(3):573–586. doi: 10.1016/j.cell.2005.11.047. [DOI] [PubMed] [Google Scholar]
- 8.Yang YS, Strittmatter SM. The reticulons: a family of proteins with diverse functions. Genome Biol. 2007 Dec 28;8(12):234. doi: 10.1186/gb-2007-8-12-234. [DOI] [PMC free article] [PubMed] [Google Scholar]
- 9.Oertle T, Klinger M, Stuermer CA, Schwab ME. A reticular rhapsody: phylogenic evolution and nomenclature of the RTN/Nogo gene family. FASEB J. 2003 Jul;17(10):1238–1247. doi: 10.1096/fj.02-1166hyp. [DOI] [PubMed] [Google Scholar]
- 10.Yan R, Shi Q, Hu X, Zhou X. Reticulon proteins: emerging players in neurodegenerative diseases. Cell Mol Life Sci. 2006 Apr;63(7-8):877–889. doi: 10.1007/s00018-005-5338-2. [DOI] [PMC free article] [PubMed] [Google Scholar]
- 11.He W, Shi Q, Hu X, Yan R. The membrane topology of RTN3 and its effect on binding of RTN3 to BACE1. J Biol Chem. 2007 Oct 5;282(40):29144–29151. doi: 10.1074/jbc.M704181200. [DOI] [PubMed] [Google Scholar]
- 12.Araki W, Oda A, Motoki K, Hattori K, Itoh M, Yuasa S, et al. Reduction ofbeta -amyloid accumulation by reticulon 3 in transgenic mice. Curr Alzheimer Res. 2012 Jun 26; doi: 10.2174/1567205011310020003. [DOI] [PubMed] [Google Scholar]
- 13.Shi Q, Prior M, He W, Tang X, Hu X, Yan R. Reduced amyloid deposition in mice overexpressing RTN3 is adversely affected by preformed dystrophic neurites. J Neurosci. 2009 Jul 22;29(29):9163–9173. doi: 10.1523/JNEUROSCI.5741-08.2009. [DOI] [PMC free article] [PubMed] [Google Scholar]
- 14.Prior M, Shi Q, Hu X, He W, Levey A, Yan R. RTN/Nogo in forming Alzheimer's neuritic plaques. Neurosci Biobehav Rev. 2010 Jul;34(8):1201–1206. doi: 10.1016/j.neubiorev.2010.01.017. [DOI] [PMC free article] [PubMed] [Google Scholar]
- 15.Rifenburg RP, Perry G. Dystrophic neurites define diffuse as well as core-containing senile plaques in Alzheimer's disease. Neurodegeneration. 1995 Jun;4(2):235–237. [PubMed] [Google Scholar]
- 16.Dickson TC, King CE, McCormack GH, Vickers JC. Neurochemical diversity of dystrophic neurites in the early and late stages of Alzheimer's disease. Exp Neurol. 1999 Mar;156(1):100–110. doi: 10.1006/exnr.1998.7010. [DOI] [PubMed] [Google Scholar]
- 17.Masliah E, Mallory M, Hansen L, Alford M, Albright T, DeTeresa R, et al. Patterns of aberrant sprouting in Alzheimer's disease. Neuron. 1991 May;6(5):729–739. doi: 10.1016/0896-6273(91)90170-5. [DOI] [PubMed] [Google Scholar]
- 18.Hu X, Shi Q, Zhou X, He W, Yi H, Yin X, et al. Transgenic mice overexpressing reticulon 3 develop neuritic abnormalities. EMBO J. 2007 Jun 6;26(11):2755–2767. doi: 10.1038/sj.emboj.7601707. [DOI] [PMC free article] [PubMed] [Google Scholar]
- 19.Shi Q, Hu X, Prior M, Yan R. The occurrence of aging-dependent reticulon 3 immunoreactive dystrophic neurites decreases cognitive function. J Neurosci. 2009 Apr 22;29(16):5108–5115. doi: 10.1523/JNEUROSCI.5887-08.2009. [DOI] [PMC free article] [PubMed] [Google Scholar]
- 20.Shi Q, Prior M, Zhou X, Tang X, He W, Hu X, et al. Preventing formation of reticulon 3 immunoreactive dystrophic neurites improves cognitive function in mice. J Neurosci. 2013 Feb 13;33(7):3059–3066. doi: 10.1523/JNEUROSCI.2445-12.2013. [DOI] [PMC free article] [PubMed] [Google Scholar]
- 21.He W, Lu Y, Qahwash I, Hu XY, Chang A, Yan R. Reticulon family members modulate BACE1 activity and amyloid-beta peptide generation. Nat Med. 2004 Sep;10(9):959–965. doi: 10.1038/nm1088. [DOI] [PubMed] [Google Scholar]
- 22.Shi Q, Ge Y, Sharoar MG, He W, Xiang R, Zhang Z, et al. Impact of RTN3 Deficiency on Expression of BACE1 and Amyloid Deposition. J Neurosci. 2014 Oct 15;34(42):13954–13962. doi: 10.1523/JNEUROSCI.1588-14.2014. [DOI] [PMC free article] [PubMed] [Google Scholar]
- 23.He W, Hu X, Shi Q, Zhou X, Lu Y, Fisher C, et al. Mapping of Interaction Domains Mediating Binding between BACE1 and RTN/Nogo Proteins. J Mol Biol. 2006 Oct 27;363(3):625–634. doi: 10.1016/j.jmb.2006.07.094. [DOI] [PubMed] [Google Scholar]
- 24.Bjork S, Hurt CM, Ho VK, Angelotti T. REEPs are membrane shaping adapter proteins that modulate specific g protein-coupled receptor trafficking by affecting ER cargo capacity. PLoS One. 2013;8(10):e76366. doi: 10.1371/journal.pone.0076366. [DOI] [PMC free article] [PubMed] [Google Scholar]
- 25.Blackstone C, O'Kane CJ, Reid E. Hereditary spastic paraplegias: membrane traffic and the motor pathway. Nat Rev Neurosci. 2011 Jan;12(1):31–42. doi: 10.1038/nrn2946. [DOI] [PMC free article] [PubMed] [Google Scholar]
- 26.Westermann B. Organelle dynamics: ER embraces mitochondria for fission. Curr Biol. 2011 Nov 22;21(22):R922–R924. doi: 10.1016/j.cub.2011.10.010. [DOI] [PubMed] [Google Scholar]
- 27.Heath JE, Siedlak SL, Zhu X, Lee HG, Thakur A, Yan R, et al. Widespread distribution of reticulon-3 in various neurodegenerative diseases. Neuropathology. 2010 Mar 30; doi: 10.1111/j.1440-1789.2010.01107.x. [DOI] [PMC free article] [PubMed] [Google Scholar]
- 28.Kandalepas PC, Sadleir KR, Eimer WA, Zhao J, Nicholson DA, Vassar R. The Alzheimer's beta-secretase BACE1 localizes to normal presynaptic terminals and to dystrophic presynaptic terminals surrounding amyloid plaques. Acta Neuropathol. 2013 Sep;126(3):329–352. doi: 10.1007/s00401-013-1152-3. [DOI] [PMC free article] [PubMed] [Google Scholar]
- 29.Lee S, Sato Y, Nixon RA. Lysosomal proteolysis inhibition selectively disrupts axonal transport of degradative organelles and causes an Alzheimer's-like axonal dystrophy. J Neurosci. 2011 May 25;31(21):7817–7830. doi: 10.1523/JNEUROSCI.6412-10.2011. [DOI] [PMC free article] [PubMed] [Google Scholar]
- 30.Shibata Y, Hu J, Kozlov MM, Rapoport TA. Mechanisms shaping the membranes of cellular organelles. Annu Rev Cell Dev Biol. 2009;25:329–354. doi: 10.1146/annurev.cellbio.042308.113324. [DOI] [PubMed] [Google Scholar]
- 31.Chen S, Novick P, Ferro-Novick S. ER structure and function. Curr Opin Cell Biol. 2013 Aug;25(4):428–433. doi: 10.1016/j.ceb.2013.02.006. [DOI] [PMC free article] [PubMed] [Google Scholar]
- 32.O'Sullivan NC, Jahn TR, Reid E, O'Kane CJ. Reticulon-like-1, the Drosophila orthologue of the hereditary spastic paraplegia gene reticulon 2, is required for organization of endoplasmic reticulum and of distal motor axons. Hum Mol Genet. 2012 Aug 1;21(15):3356–3365. doi: 10.1093/hmg/dds167. [DOI] [PMC free article] [PubMed] [Google Scholar]
- 33.Ramirez OA, Couve A. The endoplasmic reticulum and protein trafficking in dendrites and axons. Trends Cell Biol. 2011 Apr;21(4):219–227. doi: 10.1016/j.tcb.2010.12.003. [DOI] [PubMed] [Google Scholar]
- 34.English AR, Voeltz GK. Endoplasmic reticulum structure and interconnections with other organelles. Cold Spring Harb Perspect Biol. 2013 Apr;5(4):a013227. doi: 10.1101/cshperspect.a013227. [DOI] [PMC free article] [PubMed] [Google Scholar]
- 35.Shnyrova A, Frolov VA, Zimmerberg J. ER biogenesis: self-assembly of tubular topology by protein hairpins. Curr Biol. 2008 Jun 3;18(11):R474–R476. doi: 10.1016/j.cub.2008.04.031. [DOI] [PubMed] [Google Scholar]
- 36.Deng M, He W, Tan Y, Han H, Hu X, Xia K, et al. Increased expression of reticulon 3 in neurons leads to reduced axonal transport of beta site amyloid precursor protein-cleaving enzyme 1. J Biol Chem. 2013 Oct 18;288(42):30236–30245. doi: 10.1074/jbc.M113.480079. [DOI] [PMC free article] [PubMed] [Google Scholar]
- 37.Park SH, Zhu PP, Parker RL, Blackstone C. Hereditary spastic paraplegia proteins REEP1, spastin, and atlastin-1 coordinate microtubule interactions with the tubular ER network. J Clin Invest. 2010 Apr;120(4):1097–1110. doi: 10.1172/JCI40979. [DOI] [PMC free article] [PubMed] [Google Scholar]
- 38.Friedman JR, DiBenedetto JR, West M, Rowland AA, Voeltz GK. Endoplasmic reticulum-endosome contact increases as endosomes traffic and mature. Mol Biol Cell. 2013 Apr;24(7):1030–1040. doi: 10.1091/mbc.E12-10-0733. [DOI] [PMC free article] [PubMed] [Google Scholar]
- 39.Joachim CL, Morris JH, Selkoe DJ. Diffuse senile plaques occur commonly in the cerebellum in Alzheimer's disease. Am J Pathol. 1989 Aug;135(2):309–319. [PMC free article] [PubMed] [Google Scholar]
- 40.Morris JC, Storandt M, McKeel DW, Jr., Rubin EH, Price JL, Grant EA, et al. Cerebral amyloid deposition and diffuse plaques in "normal" aging: Evidence for presymptomatic and very mild Alzheimer's disease. Neurology. 1996 Mar;46(3):707–719. doi: 10.1212/wnl.46.3.707. [DOI] [PubMed] [Google Scholar]
- 41.Serrano-Pozo A, Frosch MP, Masliah E, Hyman BT. Neuropathological alterations in Alzheimer disease. Cold Spring Harb Perspect Med. 2011 Sep;1(1):a006189. doi: 10.1101/cshperspect.a006189. [DOI] [PMC free article] [PubMed] [Google Scholar]
- 42.Ferrer I, Marti E, Tortosa A, Blasi J. Dystrophic neurites of senile plaques are defective in proteins involved in exocytosis and neurotransmission. J Neuropathol Exp Neurol. 1998 Mar;57(3):218–225. doi: 10.1097/00005072-199803000-00002. [DOI] [PubMed] [Google Scholar]
- 43.Richard S, Brion JP, Couck AM, Flament-Durand J. Accumulation of smooth endoplasmic reticulum in Alzheimer's disease: new morphological evidence of axoplasmic flow disturbances. J Submicrosc Cytol Pathol. 1989 Jul;21(3):461–467. [PubMed] [Google Scholar]
Associated Data
This section collects any data citations, data availability statements, or supplementary materials included in this article.