Abstract
To explore the cytotoxic mechanism of abrin P2 on human colon cancer HCT-8 cells, abrin P2 was isolated from the seed of Abrus precatorius L. It was found that abrin P2 exhibited cytotoxicity toward 12 different human cancer cell lines. Our results demonstrated that abrin P2 suppressed the proliferation of human colon cancer cells (HCT-8 cells) and induced cell cycle arrest at the S and G2/M phases. The mechanism by which abrin P2 inhibited cell proliferation was via the down-regulation of cyclin B1, proliferating cell nuclear antigen and Ki67, as well as the up-regulation of P21. In addition, abrin P2 induced a dose- and time-dependent increase in the rate of HCT-8 cell apoptosis. Treatment with both Z-VAD-FMK, a broad-spectrum caspase inhibitor, and abrin P2 demonstrated that abrin P2 induced HCT-8 cell apoptosis via the activation of caspases. Together, our results revealed that abrin P2-induced apoptosis in HCT-8 cells was associated with the activation of caspases-3/-8/-9, the reduction in the Bcl-2/Bax ratio, the loss of mitochondrial membrane potential, and the increase in cytochrome c release. We further showed that abrin P2 administration effectively suppressed the growth of colon cancer xenografts in nude mice. This is the first report that abrin P2 effectively inhibits colon cancer cell growth in vivo and in vitro by suppressing proliferation and inducing apoptosis.
Keywords: abrin P2, colon cancer, cell proliferation, apoptosis, caspase
Introduction
Colon cancer is one of the most common malignant gastrointestinal cancers [1] and a serious threat to human health. Most patients with colon cancer are diagnosed in the middle and late stages of disease, and the mortality of colon cancer is ranked second among all cancer deaths in the USA [2,3]. In China, with improvements in living standards and changes in diet, the incidence of colon cancer is increasing, and the mortality of colon cancer has been elevated from the sixth place to the fourth place [4]. The current most commonly used clinical treatment for colon cancer is radical surgery with postoperative adjuvant therapy. However, the effectiveness of adjuvant chemotherapy is limited because of the natural insensitivity of colon cancer cells to a variety of chemotherapeutic drugs. Therefore, the search for novel effective drugs for colon cancer therapy has become a focus in the field. Compared with chemotherapy or radiotherapy, immunotoxins including bacterial toxins and plant toxins such as ricin, abrin, pokeweed antiviral protein saporin, and gelonin have attracted a great deal of interest because they possess specific antibodies that can bind to dormant tumor cells [5–8].
Abrin P2 is a plant glycoprotein and toxin isolated from the seed of the leguminous vine Abrus precatorius L. Our previous studies showed that the molecular weight of abrin P2 is 60,596 Da and the amino sugar content is 3.3%. Abrin P2 includes two different polypeptide chains, A chain and B chain, which are cross-linked by a single disulfide bond [9]. The A chain of abrin P2 has a closed N-terminal, and the 15-amino acid N-terminal of B chain is Ile-Val-Glu-Lys-Ser-Lys-Ile-Ser-Ser-Ser-Arg-Tyr-Glu-Pro-Thr, which represents 93% homology with abrin A. High-performance liquid chromatography analysis showed that the purified abrin P2 was >99% pure. The B chain can bind to the terminal galactose of cell surface receptors, and the complete abrin P2 or an abrin P2 fragment is then transported into the cell via receptor-mediated endocytosis [9]. The A chain has N-glycosidase activity and may catalyze A4324 site depuration on 28S rRNA of the 60S large subunit of eukaryotic ribosomes. This activity prevents its binding to elongation factor 2, thereby inhibiting the shifting of polypeptide chains during protein synthesis and leading to cell death caused by disruption of protein synthesis [9]. Abrin P2 has been reported to have anticancer activity against some kinds of cancer [10–21]. However, the anticancer activity of abrin P2 against colon cancer and the underlying molecular mechanism remain unclear. Therefore, we aimed to investigate the anticancer activity of abrin P2 against colon cancer in vivo and in vitro and to elucidate the underlying molecular mechanisms. Our results provide a scientific basis for further development of abrin P2 as a therapeutic agent for treating colon cancer.
Materials and Methods
Mice
Male athymic nude mice (Balb/c, body weight 16–18 g) were obtained from the Laboratory Animal Center of the National Institute for the Control of Pharmaceutical and Biological Products (Beijing, China). The mice (five per cage) were housed under specific pathogen-free conditions, with water and food ad libitum, according to an institutionally approved protocol. All animal experiments were conducted in accordance with the Guide for the Care and Use of Laboratory Animals of the National Research Council, 1996, and the experimental procedures were approved by the Institutional Animal Care and Welfare Committee of Institute of Medicinal Plant Development.
Reagents
Abrin P2 in white flocculent powder was prepared as previously reported [9]. Abrin P2 was dissolved with Dulbecco's modified Eagle medium (DMEM; HyClone, Logan, USA) at the indicated concentrations. Cyclophosphamide (CTX) was purchased from Jiangsu Hengrui Medicine Co. Ltd (Lianyungang, China). Fetal bovine serum (FBS) was provided by Hangzhou Sijiqing Biological Engineering Materials Co., Ltd (Hangzhou, China). Annexin V/propidium iodide (PI) and the Cell Cycle Kit were purchased from Beckman Coulter, Inc. (Brea, USA). Z-VAD (OMe)-FMK was purchased from Santa Cruz Biotechnology, Inc. (Santa Cruz, USA). The polymerase chain reaction (PCR) primers for cyclin B1, P21, proliferating cell nuclear antigen (PCNA), and Ki67 were provided by Sangon Biotech Co., Ltd (Shanghai, China) (Table 1). The caspases-3, -8, and -9 fluorometric assay kits and the primary antibodies against Bax, Bcl-2, cytochrome c (Cyt c), and β-actin were all provided by BioVision, Inc. (Mountain View, USA). All the fluorescence-labeled secondary antibodies were purchased from Rockland Immunochemicals, Inc. (Gilbertsville, USA). The JC-1 Mitochondrial Membrane Potential Detection Kit was purchased from Cayman Chemical (Ann Arbor, USA).
Table 1.
PCR primers used in this study
| Genes | Primers (5′→3′) |
|---|---|
| β-actin | F: GGACCTGACTGACTACCTCATGAA |
| R: CTTAATGTCACGCACGATTTCC | |
| cyclin B1 | F: GGTTGGGTCGGCCTCTACCT |
| R: AGCCAGGTGCTGCATAACTGGAA | |
| P21 | F: TCCAGCGACCTTCCTCATCCAC |
| R: TCCATAGCCTCTACTGCCACCATC | |
| PCNA | F: AGGGCTCCATCCTCAAGAAG |
| R: CTCCTGGTTTGGTGCTTCAA | |
| Ki67 | F: CTTGCCTCCTAATACGCCTCTC |
| R: CACTCTTTCTCCCTCCTCTCTTAG |
Cell culture
The HCT-8 human colon carcinoma cell line (ATCC: CCL-244™) was supplied by the Cancer Institute of the Chinese Academy of Medical Sciences (Beijing, China). The other cells used in this study were maintained in our laboratory. Cells were cultured in DMEM or RPMI-1640 medium supplemented with 10% FBS, 100 U/ml penicillin, and 100 μg/ml streptomycin at 37°C in a humidified incubator with 5% CO2. Cells in logarithmic growth phase were used for experiments.
Cell proliferation assay
Cell viability was assessed using the 3-(4,5-dimethyl-2-thiazolyl)-2,5-diphenyl-2-H-tetrazolium bromide (MTT) assay. Cells in logarithmic growth phase were collected and seeded in 96-well plates (2 × 10³ cells/well) for 24 h. Then the culture medium was changed to new medium containing different doses of abrin P2 and incubated for 72 h. After the addition of 10 µl MTT (5 mg/ml) solution to each well and 4 h of incubation at 37°C, the formazan crystals in each well were dissolved in 100 µl dimethyl sulfoxide. The absorbance at 490 nm was measured using a multimode detector (Bio-Rad, Hercules, USA). Three replicate wells were included for each dose, and three independent experiments were performed. The IC50 value of abrin P2 for various human cancer cells was calculated by Karber's method.
Cell cycle assay
HCT-8 cells in logarithmic growth phase were seeded in 6-well plates. Cells were serum starved for 24 h and then treated with different concentrations of abrin P2 (0, 1 × 10⁻⁴, 1 × 10⁻³, 1 × 10⁻², or 1 × 10⁻¹ μg/ml) in fresh DMEM for another 48 h. Cells were fixed with 3 ml of 70% ethanol for 2 h, and then stained with 1 ml staining solution containing PI and RNase A for 30 min at 4°C. Then cell cycle distribution was detected by flow cytometry and analyzed using ModFit LT software.
RNA isolation and quantitative reverse transcription-PCR
HCT-8 cells were treated and prepared as described above in the cell cycle analysis experiments. Total RNA was isolated from HCT-8 cells using a total RNA extraction kit (Invitrogen, Carlsbad, USA). First-strand cDNA was synthesized with Oligo (dT) 18 primer using M-MuLV reverse transcriptase according to the manufacturer's instruction (Invitrogen). The PCR amplification was performed with Bio-Rad iQ5 using a real-time PCR premixture. The PCR primers used are listed in Table 1.
Apoptosis assay
After the treatment of HCT-8 cells with different concentrations of abrin P2 or CXT, cells were digested with trypsin, harvested by centrifugation, and suspended in phosphate-buffered saline (PBS) at 1 × 10⁶ ml−1. Then 5 μl Annexin V and 1 μl PI working solution were added to the cells, followed by incubation for 15 min at room temperature in the dark. Immediately after the incubation, apoptotic cells were detected by flow cytometry, and the results were analyzed using CELL Quest software (FACSCalibur, Becton Dickinson, Franklin Lakes, USA).
Measurement of mitochondrial membrane potential
The effect of abrin P2 on the mitochondrial membrane potential in HCT-8 cells was examined using the JC-1 Mitochondrial Membrane Potential Detection Kit (Cayman Chemical). HCT-8 cells were treated and prepared as described above in the cell cycle analysis experiments. Cells were then incubated in JC-1 working solution for 30 min and suspended in fresh PBS. The changes in mitochondrial membrane potential were detected by flow cytometry.
Caspase activity assays
HCT-8 cells in logarithmic growth phase were seeded in 6-well plates. After 24 h of culture, cells were treated with caspase inhibitor (50 μM Z-VAD-FMK) for 1 h. Cells were then treated with different concentrations of abrin P2 (0, 1 × 10⁻⁴, or 1 × 10⁻³ μg/ml) in fresh DMEM for another 48 h. After treatment, cells were prepared as described above in the cell apoptosis assay. The activities of caspases-3, −8, and −9 were detected using the corresponding kits according to the manufacturer's instructions on a fluorescence and chemiluminescence analyzer.
Western blot analysis
HCT-8 cells were treated and harvested as described above in the cell cycle analysis experiments. The harvested cells were lysed with radioimmunoprecipitation assay lysis buffer containing protease inhibitor cocktail, and protein concentrations were determined by the bicinchoninic acid method. Then, 30 µg of protein was separated by 10% sodium dodecyl sulfate-polyacrylamide gel electrophoresis, transferred onto a polyvinylidene fluoride membrane, and blocked with 5% skim milk overnight at room temperature. Primary antibodies against Bcl-2, Bax, Cyt- c, and β-actin were diluted in Tris-buffered saline containing 1% bovine serum albumin and incubated with the membranes at room temperature for 2 h. After washing, the membranes were incubated with the corresponding fluorescence-labeled secondary antibodies for 1 h, then washed thoroughly to remove residual secondary antibodies, and scanned by an Odyssey Infrared Imager to visualize protein expression levels.
Analysis of anticancer activity in vivo
Xenografts were initially established by subcutaneous injection of 5 × 10⁶ cultured cells and passed several generations by transplanting cancer tissues. Before treatment, tumors ∼2 mm3 in size were grafted into the lower left axillary region of nude mice [22]. One week after implantation, animals were randomly separated into five groups (n = 10 mice per group): a model group, a positive control (CTX, 30 mg/kg) group, and high (100 µg/kg), medium (75 µg/kg), and low (50 µg/kg) dose abrin P2 groups. Abrin P2 was delivered by intragastric administration once a day for 12 days, and CTX was delivered by intraperitoneal injection once every 2 days for 12 days. Tumors were measured in two dimensions using a caliper every 4 days, and the volumes were calculated using the formula: tumor volume (mm3) = tumor length × (tumor width)2/2. At the end of the experiment, the mice were sacrificed, and the tumors were removed and weighed. The inhibition rates were calculated using the formula: inhibition rate (%) = (1 − average tumor weight in treated mice/average tumor weight in model mice) × 100%.
Statistical analysis
Statistical significance was assessed using one-way analysis of variance in SPSS 12.0 for Windows (SPSS, Inc., Chicago, USA). Differences were considered significant at P < 0.05. All results were expressed as the mean ± standard deviation (SD) values.
Results
Abrin 2 exhibits cytotoxicity toward 12 different human cancer cell lines
The anticancer activity of abrin P2 in human cancer cells was evaluated in vitro using 12 different human cancer cell lines. As shown in Supplementary Table S1, abrin P2 exhibited broad-spectrum suppression of human cancer cell growth, when IC50 values ranged from 1.74 × 10⁻⁸ to 1.67 × 10⁻³ μg/ml as determined by MTT assay. From these data, we found that abrin P2 had an IC50 value of 1.74 × 10⁻⁸ μg/ml in the human hepatocellular carcinoma cell line Bel-7402 and an IC50 value of 1.69 × 10⁻⁵ μg/ml in the human colon cancer cell line HCT-8.
Abrin 2 blocks cell cycle progression at the S and G2/M phases and affects the relative mRNA expression of cyclin B1, P21, PCNA, and Ki67
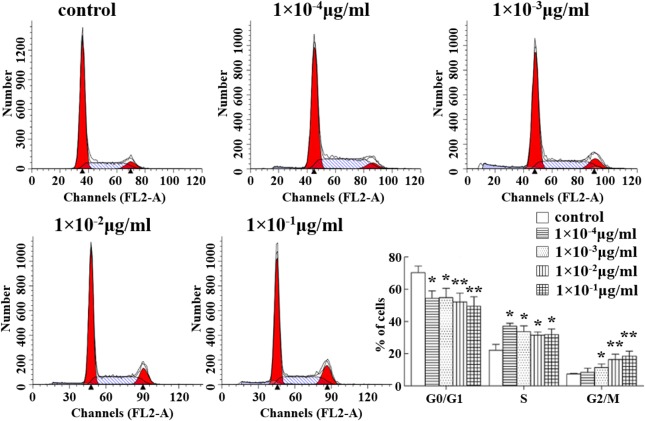
To elucidate the effect of abrin P2 on HCT-8 cell proliferation, cell cycle distribution analysis was performed by flow cytometry at 48 h after treatment with different concentrations of abrin P2. As shown in Fig. 1, abrin P2 treatment induced cell cycle arrest at the S and G2/M phases in HCT-8 cells. Compared with that in the control group, the percentages of cells in the G0/G1 phase in the abrin P2 treatment groups were less (*P < 0.05), and the percentages of cells in the S and G2/M phases in the abrin P2 treatment groups were greater (*P < 0.05). These results demonstrate that abrin P2 treatment induces cell cycle arrest at the S and G2/M phases, and the effect of abrin P2 on cell cycle progression is dose dependent.
Figure 1.
Abrin P2 induced S and G2/M cell cycle arrest in HCT-8 cells Cell cycle distribution was analyzed by flow cytometry. Representative flow cytometric histograms show the distribution of cells in different phases at 48 h after treatment with the indicated concentration of abrin P2. The data are presented as the mean ± SD from six independent experiments. *P < 0.05 and **P < 0.01 vs. control.
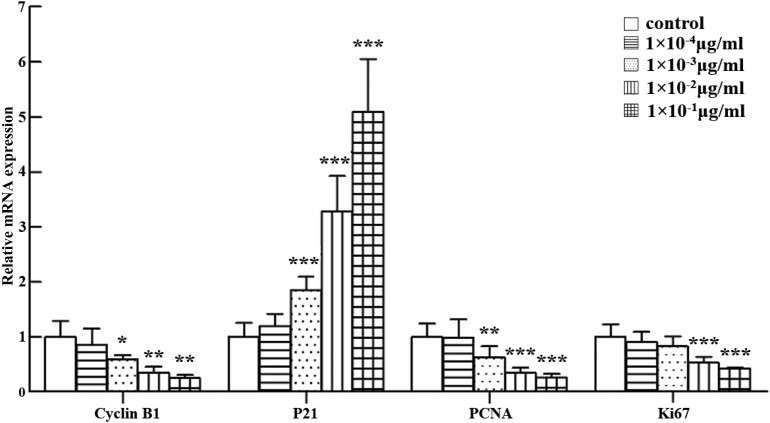
The effects of abrin P2 on the mRNA expression of cyclin B1, P21, PCNA, and Ki67 were also studied, because cyclin B1 and P21 are regulators of the S-phase and G2/M-phase progression and PCNA and Ki67 are cell proliferation markers. Real-time quantitative reverse transcription (qRT)-PCR results demonstrated that abrin P2 treatment significantly increased p21 mRNA expression and decreased PCNA, cyclin B1, and Ki67 mRNA expression (Fig. 2). These results suggest that abrin P2 suppresses HCT-8 cell proliferation.
Figure 2.
Assessment of cyclin B1, P21, PCNA, and Ki67 mRNA expression in HCT-8 cells treated with different concentrations of abrin P2 Relative gene expressions of cyclin B1, P21, PCNA, and Ki67 in abrin P2-treated samples compared with that in untreated control samples were determined by qRT-PCR and normalized to β-actin mRNA expression. The data are presented as the mean ± SD from nine independent experiments. *P < 0.05, **P < 0.01, and ***P < 0.001 vs. control.
Abrin P2 induces apoptosis in HCT-8 cells by disrupting the mitochondrial membrane potential and increasing caspases-3, -8, and -9 activities
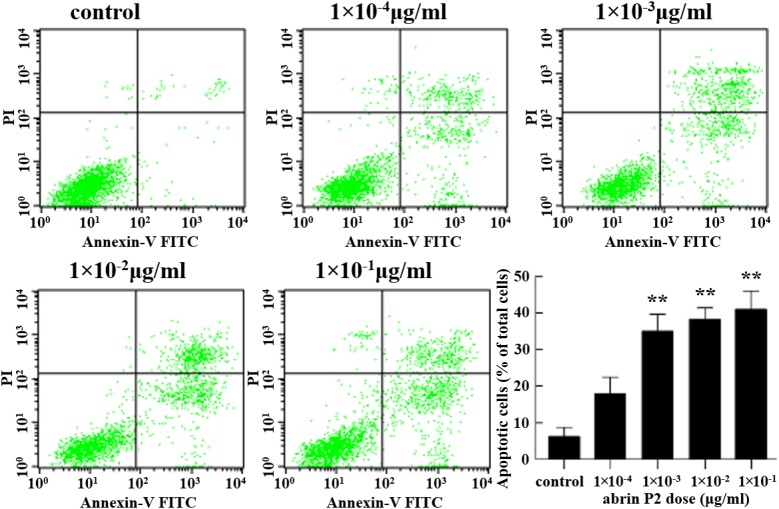
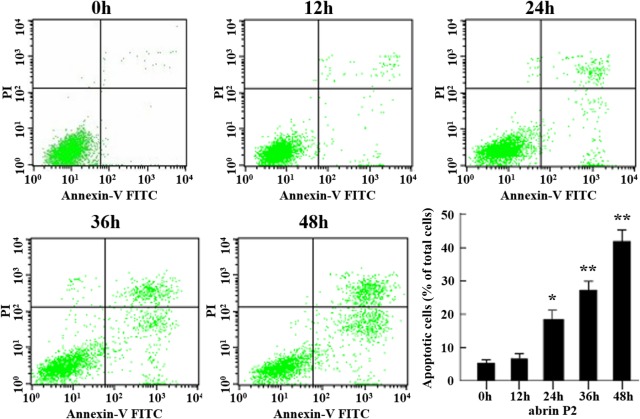
The effect of abrin P2 on apoptosis of HCT-8 cells was determined by fluorescence-activated cell sorting analysis. After abrin P2 treatment for 48 h at concentrations of 1 × 10⁻⁴, 1 × 10⁻³, 1 × 10⁻², and 1 × 10⁻¹ μg/ml, the apoptotic rates of HCT-8 cells were 17.92% ± 7.85%, 35.03% ± 8.06%, 38.25% ± 5.44%, and 40.96% ± 8.88%, respectively. In addition, when HCT-8 cells were treated with 1 × 10⁻² μg/ml abrin P2 for 0, 12, 24, 36, and 48 h, the apoptotic rates were 5.34% ± 1.76%, 6.68% ± 2.35%, 18.46% ± 4.87%, 27.26% ± 4.70%, and 41.96% ± 5.94%, respectively. These results indicated that abrin P2 induced apoptosis in HCT-8 cells in a dose- and time-dependent manner (Figs. 3 and 4).
Figure 3.
Abrin P2 induced apoptosis in HCT-8 cells in a dose-dependent manner HCT-8 cells were treated with different concentrations of abrin P2 as indicated for 48 h, and apoptotic cells were detected by flow cytometry. The percentages of apoptotic cells are shown in each treatment group. The data are presented as the mean ± SD from six independent experiments. **P < 0.01 vs. control. The apoptotic rates were 17.92% ± 7.85%, 35.03% ± 8.06%, 38.25% ± 5.44%, and 40.96% ± 8.88% after treatment with abrin P2 at doses of 1 × 10⁻⁴, 1 × 10⁻³, 1 × 10⁻², and 1 × 10⁻¹ μg/ml, respectively.
Figure 4.
Abrin P2 induced apoptosis in HCT-8 cells in time-dependent manner HCT-8 cells were treated with 1 × 10⁻² μg/ml abrin P2 for the indicated time, and apoptotic cells were detected by flow cytometry. The percentages of apoptotic cells after different treatment times were shown. The data are presented as the mean ± SD from six independent experiments. *P < 0.05 and **P < 0.01 vs. control. After treatment of HCT-8 cells with 1 × 10⁻² μg/ml abrin P2 for 0, 12, 24, 36 and 48 h, the apoptotic rates were 5.34% ± 1.76%, 6.68% ± 2.35%, 18.46% ± 4.87%, 27.26% ± 4.70%, and 41.96% ± 5.94%, respectively.
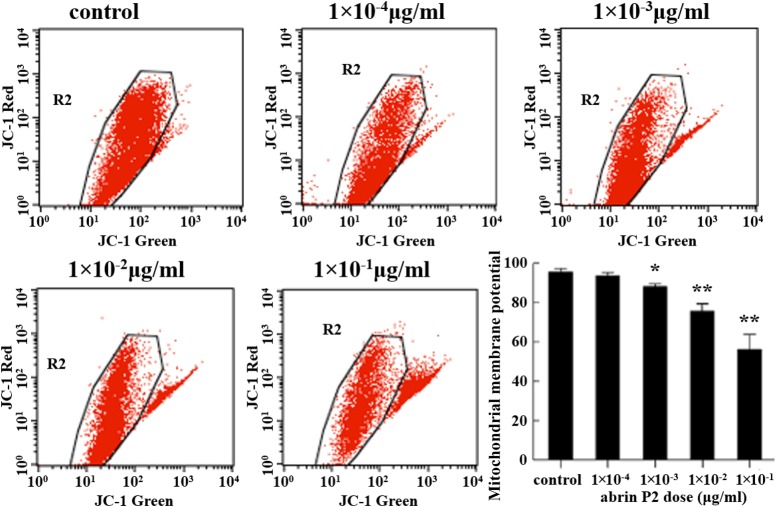
Loss of mitochondrial membrane potential has been linked to the initiation and activation of apoptotic cascades, and thus is an important sign of apoptosis. To elucidate whether the mitochondrial apoptotic pathway is involved in abrin P2-induced apoptosis, changes in the mitochondrial membrane potential (Δψm) were analyzed by flow cytometry using JC-1 staining. Treatment of HCT-8 cells with increasing concentrations of abrin P2 for 48 h significantly reduced the mitochondrial membrane potential in a dose-dependent manner (Fig. 5).
Figure 5.
Mitochondrial membrane potential damage in abrin P2-treated HCT-8 cells evaluated using JC-1 fluorescence dye staining and flow cytometric analysis After 48 h of treatment with different concentrations of abrin P2, the mitochondrial membrane potential (Δψm) in HCT-8 cells was significantly decreased in a dose-dependent manner. The data are presented as the mean ± SD from six independent experiments. *P < 0.05 and **P < 0.01 vs. control.
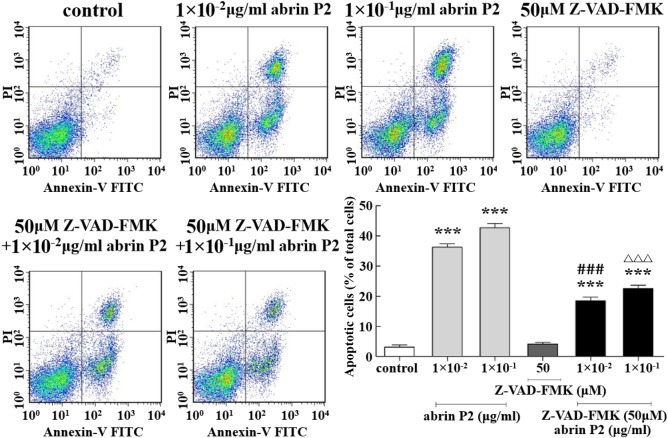
To determine whether abrin P2-induced apoptosis is associated with activation of caspases, a hallmark of apoptosis, a neutralization experiment was performed using the caspase inhibitor Z-VAD-FMK. The apoptotic rates of HCT-8 cells treated with abrin P2 at concentrations of 1 × 10⁻² and 1 × 10⁻¹ μg/ml were 36.21% ± 1.96% and 42.72% ± 2.47%, respectively. Treatment of HCT-8 cells with 50 μM Z-VAD-FMK for 1 h before treatment with 1 ± 10−2 and 1 × 10⁻¹ μg/ml abrin P2 decreased the apoptotic rates to 18.53% ± 1.96% and 22.59% ± 1.91%, respectively. These results indicate that abrin P2 induces apoptosis by activating caspases (Fig. 6).
Figure 6.
Z-VAD-FMK partially abrogated abrin P2-induced apoptosis in HCT-8 cells After the treatment of HCT-8 cells with 50 μM Z-VAD-FMK for 1 h before abrin P2 treatment, the apoptotic rates were reduced significantly compared with those in cells treated with abrin P2 only. The data are presented as the mean ± SD from three independent experiments. ***P < 0.001 vs. control; ###P < 0.001 vs. 1 × 10⁻² μg/ml abrin P2; and ΔΔΔP < 0.001 vs. 1 × 10⁻¹ μg/ml abrin P2.
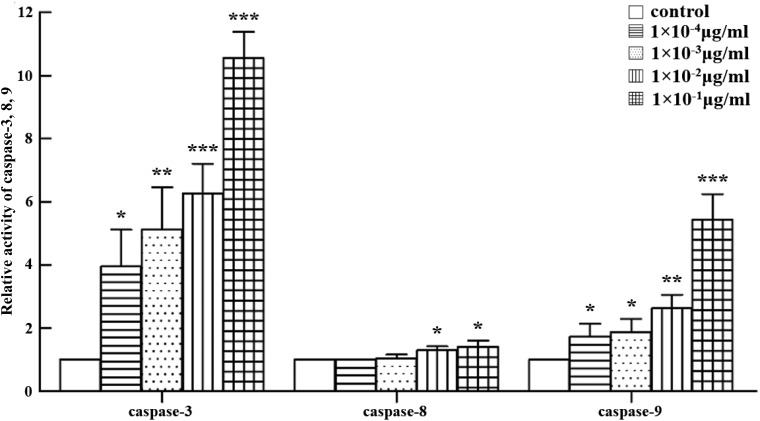
Furthermore, caspases-3, -8, and -9 activities were detected using caspases-3, -8, and -9 fluorometric assay kits. As shown in Fig. 7, abrin P2 treatment significantly increased caspase-3 activity in HCT-8 cells in a dose-dependent manner. The activities of caspase-9 and caspase-8 were also increased with the increase of abrin P2 concentration.
Figure 7.
Abrin P2 treatment enhanced the activities of caspases-3, -8, and -9 HCT-8 cells were treated with different concentrations of abrin P2 for 48 h, and caspase enzyme activities were determined. The relative activities of caspases-3, -8, and -9 for each treatment group are shown. The data are presented as the mean ± SD from six independent experiments. *P < 0.05, **P < 0.01, and ***P < 0.001 vs. control.
Abrin P2 affects protein expression of Bcl-2, Bax, and Cyt c
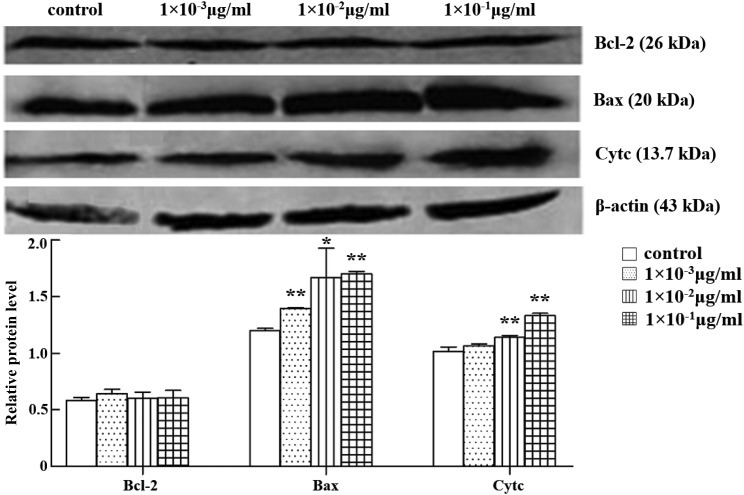
The release of mitochondrial Cyt c to cytosol and, conversely, translocation of Bax from the cytosol to the membrane are characteristic events in the mitochondrial apoptotic pathway. Whether abrin P2 affects the protein expression of Bcl-2, Bax, and Cyt c was, therefore, investigated by western blot analysis. The results indicated that after treatment of HCT-8 cells with abrin P2 for 48 h, Bax expression was significantly increased, whereas Bcl-2 expression showed no significant changes compared with the control group. Therefore, the Bcl-2/Bax ratio decreased. The release of Cyt c was also elevated (Fig. 8). These data suggest that the mitochondrial apoptotic pathway plays an important role in abrin P2-induced apoptosis.
Figure 8.
Protein expressions of Bcl-2, Bax, and Cyt c in HCT-8 cells treated with different concentrations of abrin P2 Total cellular protein was extracted at 48 h after abrin P2 treatment. Western blot analysis was performed using antibodies against Bcl-2, Bax, and Cyt c, and β-actin served as a loading control. Data are presented as the mean ± SD from six independent experiments. *P < 0.05 and **P < 0.01 vs. control. The results indicated that after treatment of HCT-8 cells with abrin P2 for 48 h, Bax and Cyt c expressions were significantly increased.
Abrin P2 suppresses growth of xenografted human tumor in vivo
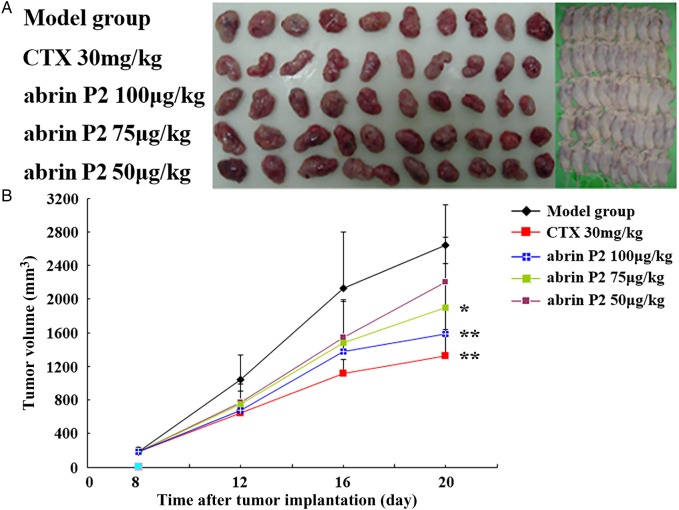
To further confirm the anticancer activity of abrin P2, an in vivo study was carried out in nude mice xenografted with human HCT-8 cells. One week after xenografting, mice were randomly separated into five groups (n = 10 mice per group). Different groups of nude mice were treated with different doses of abrin P2 or CTX (as positive control). The tumor dimensions were measured every 4 days after tumor implantation in the nude mouse model. As indicated in Fig. 9, abrin P2 significantly decreased the mean tumor volume in the nude mouse model. The inhibition rates in the CTX (positive control) group and the high (100 µg/kg), medium (75 µg/kg), and low (50 µg/kg) dose abrin P2 groups were 51.3% (P < 0.01), 40.2% (P < 0.01), 27.9% (P < 0.05), and 16.7% (P < 0.05), respectively. The body weight of mice did not show any significant difference between the challenge groups and the model group (Table 2). All the abrin P2- or CTX-treated mice remained alive at the end of challenge. These results indicated that abrin P2 and CTX significantly delayed tumor growth, and mice may tolerate the toxicity of the applied concentrations of abrin P2 and CTX.
Figure 9.
Abrin P2 inhibited tumor growth in vivo (A) Photographs of nude mice bearing transplanted HCT-8 tumors and the isolated tumors. The doses of abrin P2 and CTX used for each mouse are indicated on the left. (B) Tumor growth curves for all experimental groups. During the experiment, the tumor dimensions were measured every 4 days. The results showed that abrin P2 and CTX significantly delayed tumor growth, when compared with that in the model group. *P < 0.05 and **P < 0.01 vs. control.
Table 2.
Effect of abrin P2 on human transplanted cancer HCT-8 in vivo
| Groups |
n |
Body weight (, g) |
Cancer weight (, g) | Inhibition rate | ||
|---|---|---|---|---|---|---|
| Before | After | Before | After | |||
| Model | 10 | 10 | 21.0 ± 1.5 | 21.3 ± 0.8 | 2.61 ± 0.58 | – |
| CTX 30 mg/kg | 10 | 10 | 21.0 ± 1.0 | 21.2 ± 0.9 | 1.27 ± 0.48** | 51.30%** |
| Abrin P2 100 µg/kg | 10 | 10 | 20.9 ± 0.7 | 21.3 ± 1.4 | 1.56 ± 0.88* | 40.20%* |
| Abrin P2 75 µg/kg | 10 | 10 | 21.2 ± 0.9 | 21.2 ± 1.2 | 1.88 ± 0.73* | 27.90%* |
| Abrin P2 50 µg/kg | 10 | 10 | 21.3 ± 1.0 | 21.3 ± 0.9 | 2.17 ± 0.59NS | 16.70%NS |
NS, not significant.
*P < 0.05, **P < 0.01, compared with the model group.
Discussion
In this study, we showed that abrin P2 exhibited cytotoxicity toward 12 different human cancer cell lines (Supplementary Table S1). The anticancer activity of abrin P2 observed in HCT-8 cells occurs more generally in many tumor types. Therefore, we analyzed the anticancer activity of abrin P2 against a colon cancer cell line and investigated the molecular mechanism responsible for this activity. It is very well known that the cell cycle plays a critical role in cell proliferation, growth, and division [23], and cell cycle arrest could be a reason for the growth inhibitory effects of abrin P2. Therefore, we evaluated the cell cycle distribution of HCT-8 cells after abrin P2 treatment relative to that of untreated control cells. Our results demonstrated that abrin P2 significantly inhibited HCT-8 cell proliferation and blocked cell cycle progression at the S and G2/M phases (Fig. 1). Abrin P2 inhibited the expression of cyclin B1, PCNA, and Ki67 and induced the expression of p21 (Fig. 2). Induction of apoptosis in cancer cells is one strategy for anticancer therapy. Our results showed that abrin P2 induced apoptosis of HCT-8 cells in a dose- and time-dependent manner (Figs. 3 and 4). Moreover, abrin P2 administration effectively reduced the growth of transplanted colon cancer cells in nude mice (Fig. 9). This is the first report to show that abrin P2 effectively inhibits in vivo and in vitro colon cancer growth by inhibiting proliferation and inducing apoptosis in cancer cells.
Cyclin, cyclin-dependent kinase (CDK), and cyclin-dependent kinase inhibitor (CDKI) control cell cycle progression. In the cell cycle, the G2/M phase is strictly regulated via the participation and coordination of cyclin B1. Cells can be promoted from the G1/S phase to the G2/M phase by binding of cyclin B1 with CDK1. As an important CDKI, P21 represents a link between antitumor activity and control of cell cycle, because it inhibits CDK complex activity and affects cell cycle progression. P21 plays a role during the G2/M phase transition and may also mediate S phase and G2 arrest [23,24]. PCNA has long been viewed only as a proliferation marker. PCNA expression gradually increases in the G1 phase, reaches a peak in the S phase, and then decreases in the G2/M phase. PCNA is an essential regulator of P21 activity that binds to the carboxyl terminus of P21 to inhibit PCNA-dependent DNA replication [23]. In turn, P21 may also affect PCNA levels. When P21 is up-regulated during differentiation, PCNA is down-regulated. PCNA may be linked to the cell cycle regulating machinery through this regulative mechanism [25]. In cells, a lack of P21 expression allows PCNA to interact with complexes of cyclin/cyclin-dependent kinases without disruption by P21, and to target the complex at DNA replication proteins. The Ki67 antigen is present only in cells that are experiencing cell cycle progression, and the intracellular location of Ki67 varies depending on the distinct phase of the cell cycle [25]. Ki67 accumulated in the S phase is degraded rapidly during mitosis anaphase. The precise role of Ki67 in the network that regulates cell cycle progression is currently not well characterized, but it is known as a substrate of the cyclin B/cdc complex and becomes phosphorylated during mitosis [25,26]. In the present study, we found that the expressions of cyclin B1, PCNA, and Ki67 were decreased in abrin P2-treated HCT-8 cells, whereas the expression of P21 was increased (Fig. 2).
Apoptosis is a self-regulated active process of cell death. Apoptosis is an important area of research in cancer therapy. Recent studies have shown that although many different chemotherapy drugs have diverse structures and various targets, they can all induce apoptosis in cancer cells [27–29]. Therefore, induction of apoptosis represents an important mechanism of chemotherapy. Some studies have demonstrated that the anticancer effect of chemotherapy drugs occurs in parallel with their ability to induce apoptosis [30,31]. Our results indicated that treatment with a low concentration of abrin P2 (1 × 10⁻³ μg/ml) induced apoptosis in HCT-8 cells, and with increasing abrin P2 concentration and prolonged treatment time, the apoptotic rate in HCT-8 cells was increased in a dose- and time-dependent manner (Figs. 3 and 4).
Apoptosis occurs via two different pathways, namely the death receptor pathway and the mitochondria-related pathway. Previous studies have shown that the mitochondria play a central role in the regulation of apoptotic events [32]. Although apoptotic signals are diverse and vary in different cell types, the apoptotic signals are mostly integrated and amplified at the mitochondrial level. Members of the Bcl-2 gene family are the main regulators of the mitochondrial apoptotic pathway. Bcl-2 family proteins, including pro- and anti-apoptotic proteins, form a complex interconnected network system. Among them, classic members Bcl-2 and Bax inhibit and promote apoptosis, respectively. Although both Bcl-2 and Bax can regulate apoptosis independently, a competitive antagonism occurs between them, and the Bcl-2/Bax ratio can regulate the mitochondrial apoptotic pathway and ultimately determine whether apoptosis is initiated in cells [33,34]. Extensive studies have shown that Bcl-2 family proteins are involved in the regulation of the opening and closing of the mitochondrial permeability transition pore (MPTP); under reduced Bcl-2/Bax ratio, the MPTP is irreversibly over-opened, resulting in increased permeability of the mitochondrial membrane and redistribution of ions on both sides of the mitochondrial membrane. These changes rapidly reduce the mitochondrial membrane potential [35], diminish the transmembrane H+ gradient, and uncouple the respiratory chain. Permeability-induced mitochondrial swelling and outer membrane rupture occur. Cyt c, the first identified mitochondrial apoptosis molecule, is released from the mitochondria into the cytoplasm. In the presence of deoxy-adenosine triphosphate, Cyt c interacts with the apoptotic protease activating factor-1 to form a polymer complex, which triggers caspase-9 activation and further activates caspase-3 to amplify the death signal, which eventually leads to apoptosis [35–39]. Caspase-8 exists mainly in an enzymogen form and plays an important role in the death receptor apoptosis pathway. Caspase-8 is activated after receiving stimulus signals and subsequently triggers the caspase protease that activates the downstream chain of hydrolases and then further activates the effector caspase-3. Studies have demonstrated that abrin P2 induces apoptosis via the mitochondrial pathway, specifically via Cyt c release or regulation of caspase-3 and Bcl-2 expressions in different types of cancer cells [16–18].
In this study, Z-VAD-FMK, a broad-spectrum caspase inhibitor, was found to partially abrogate abrin P2-induced apoptosis (Fig. 6). The evaluation of caspases-3/-8/-9 enzyme activity showed that abrin P2 treatment resulted in increases in caspases-3/-8/-9 enzyme activity to various degrees (Fig. 7). Thus, caspase activation may be involved in abrin P2-induced apoptosis. Our results also showed a decrease in the Bcl-2/Bax ratio due to an increase in pro-apoptotic protein Bax expression (Fig. 8) and loss of mitochondrial membrane potential (Fig. 5) in abrin P2-induced apoptosis. Abrin P2 induced Cyt c release from mitochondria to the cytoplasm (Fig. 8), activation of caspases-3 and -9, and ultimately, apoptosis. Meanwhile, abrin P2 also activated caspase-8 to induce apoptosis (Fig. 7). However, our data indicated that the mitochondrial apoptotic pathway may play a more prominent role in abrin P2-induced apoptosis in HCT-8 cells. The major target of abrin P2 should be investigated in future research.
In summary, our results indicated that the treatment of HCT-8 cells with abrin P2 significantly suppressed cell proliferation and induced cell apoptosis. In addition, we also demonstrated that abrin P2 administration effectively inhibited the growth of transplanted HCT-8 cells in nude mice. These data demonstrate that abrin P2 has an anticancer effect in vitro and in vivo. Our analysis of the underlying molecular mechanism showed that abrin P2 not only inhibited HCT-8 cell proliferation but also induced apoptosis in HCT-8 cells in vitro via mitochondrial membrane depolarization and increased caspases-3/-8/-9 enzyme activity, which suggests that abrin P2 may have potential for the treatment of colon cancer. However, side effects of abrin P2 should be investigated on normal cells (like normal colon cells) in future research.
Supplementary Data
Funding
This work was supported by the grants from the National Mega-project for Innovative Drugs (No. 2012ZX09301002-001-026) and the PUMC (Peking Union Medical College) Youth Fund (No. 3332015142).
Supplementary Material
References
- 1.Jemal A, Siegel R, Xu J, Ward E. Cancer statistics, 2010. CA Cancer J Clin 2010, 60: 277–300. [DOI] [PubMed] [Google Scholar]
- 2.Jemal A, Siegel R, Ward E, Hao Y, Xu J, Murray T, Thun M.. Cancer statistics, 2008. CA Cancer J Clin 2008, 58: 71–96. [DOI] [PubMed] [Google Scholar]
- 3.Siegel R, Naishadham D, Jemal A. Cancer statistics, 2012. CA Cancer J Clin 2012, 62: 10–29. [DOI] [PubMed] [Google Scholar]
- 4.Yu SZ, You KC. The progress of colon carcinoma about its diagnosis and treatment. Med Recapitulate 2006, 12: 798–799. [Google Scholar]
- 5.Pastan II, Kreitman RJ. Immunotoxins for targeted cancer therapy. Adv Drug Deliv Rev 1998, 31: 53–88. [DOI] [PubMed] [Google Scholar]
- 6.Ye Y, Bloch S, Xu B, Achilefu S. Design, synthesis, and evaluation of near infrared fluorescent multimeric RGD peptides for targeting tumors. J Med Chem 2006, 49: 2268–2275. [DOI] [PMC free article] [PubMed] [Google Scholar]
- 7.Mathew M, Verma RS. Humanized immunotoxins: a new generation of immunotoxins for targeted cancer therapy. Cancer Sci 2009, 100: 1359–1365. [DOI] [PMC free article] [PubMed] [Google Scholar]
- 8.Kreitman RJ. Immunotoxins for targeted cancer therapy. AAPS J 2006, 8: E532–E551. [DOI] [PMC free article] [PubMed] [Google Scholar]
- 9.Li LQ, Zheng XJ, Chen LG, Shi R, Lin FS. Molecular characteristics and clinical application prospect of abrin. Chin New Drug J 2002, 11: 360–363. [Google Scholar]
- 10.Bora N, Gadadhar S, Karande AA. Signaling different pathways of cell death: abrin induced programmed necrosis in U266B1 cells. Int J Biochem Cell Biol 2010, 42: 1993–2003. [DOI] [PubMed] [Google Scholar]
- 11.Ohba H, Moriwaki S, Bakalova R, Yasuda S, Yamasaki N. Plant-derived abrin-a induces apoptosis in cultured leukemic cell lines by different mechanisms. Toxicol Appl Pharmacol 2004, 195: 182–193. [DOI] [PubMed] [Google Scholar]
- 12.Bhutia SK, Mallick SK, Maiti S, Maiti TK. Inhibitory effect of Abrus abrin-derived peptide fraction against Dalton's lymphoma ascites model. Phytomedicine 2009, 16: 377–385. [DOI] [PubMed] [Google Scholar]
- 13.Shih SF, Wu YH, Hung CH, Yang HY, Lin JY. Abrin triggers cell death by inactivating a thiol-specific antioxidant protein. J Biol Chem 2001, 276: 21870–21877. [DOI] [PubMed] [Google Scholar]
- 14.Ramnath V, Kuttan G, Kuttan R. Antitumour effect of abrin on transplanted tumours in mice. Indian J Physiol Pharmacol 2002, 46: 69–77. [PubMed] [Google Scholar]
- 15.Qu X, Qing L. Abrin induces HeLa cell apoptosis by cytochrome c release and caspase activation. J Biochem Mol Biol 2004, 37: 445–453. [DOI] [PubMed] [Google Scholar]
- 16.Narayanan S, Surolia A, Karande AA. Ribosome-inactivating protein and apoptosis: abrin causes cell death via mitochondrial pathway in Jurkat cells. Biochem J 2004, 377: 233–240. [DOI] [PMC free article] [PubMed] [Google Scholar]
- 17.Ramnath V, Rekha PS, Kuttan G, Kuttan R. Regulation of caspase-3 and Bcl-2 expression in Dalton's lymphoma ascites cells by abrin. Evid Based Complement Alternat Med 2009, 6: 233–238. [DOI] [PMC free article] [PubMed] [Google Scholar]
- 18.Bhutia SK, Mallick SK, Maiti S, Mishra D, Maiti TK. Abrus abrin derived peptides induce apoptosis by targeting mitochondria in HeLa cells. Cell Biol Int 2009, 33: 720–727. [DOI] [PubMed] [Google Scholar]
- 19.Liu YH, Peck K, Lin JY. Involvement of prohibitin upregulation in abrin-triggered apoptosis. Evid Based Complement Alternat Med 2012, 2012: 605154. [DOI] [PMC free article] [PubMed] [Google Scholar]
- 20.Qin DD, Gao NN, Ji YB. The inhibition of abrin P2 to B16 melanoma and its mechanism. Pharmacol Clin Chin Mater Med 2011, 27: 22–26. [Google Scholar]
- 21.Qin DD, Gao NN, Zhao XY, Song X, Li LQ. The investigation of anti-hepatoma effects and influence of telomerase activity of abrin P2. Chin Pharmacol Bull 2011, 27: 1666–1671. [Google Scholar]
- 22.Kalanaky S, Hafizi M, Fakharzadeh S, Vasei M, Langroudi L, Janzamin E, Hashemi SM et al. . BCc1, the novel antineoplastic nanocomplex, showed potent anticancer effects in vitro and in vivo. Drug Des Dev Ther 2015, 10: 59–70. [DOI] [PMC free article] [PubMed] [Google Scholar]
- 23.Korgun ET, Celik-Ozenci C, Acar N, Cayli S, Desoye G, Demir R. Location of cell cycle regulators cyclin B1, cyclin A, PCNA, Ki67 and cell cycle inhibitors p21, p27 and p57 in human first trimester placenta and deciduas. Histochem Cell Biol 2006, 125: 615–624. [DOI] [PubMed] [Google Scholar]
- 24.Stark GR, Taylor WR. Control of the G2/M transition. Mol Biotechnol 2006, 32: 227–248. [DOI] [PubMed] [Google Scholar]
- 25.Maga G, Hubscher U. Proliferating cell nuclear antigen (PCNA): a dancer with many partners. J Cell Sci 2003, 116: 3051–3060. [DOI] [PubMed] [Google Scholar]
- 26.Endl E, Gerdes J. The Ki-67 protein: fascinating forms and an unknown function. Exp Cell Res 2000, 257: 231–237. [DOI] [PubMed] [Google Scholar]
- 27.Fulda S, Susin SA, Kroemer G, Debatin KM. Molecular ordering of apoptosis induced by anticancer drugs in neuroblastoma cells. Cancer Res 1998, 58: 4453–4460. [PubMed] [Google Scholar]
- 28.Tian XM, Zhang ZX. Preliminary studies on effects of resveratrol in inhibiting growth of HepG2 and inducing its apoptosis. Chin Pharmacol Bull 2001, 17: 522–524. [Google Scholar]
- 29.Wang H. Combined effect of docetaxel and cisplatin for non-small cell lung cancer cell lines in vitro. Nagoya J Med Sci 2000, 63: 129–137. [PubMed] [Google Scholar]
- 30.Kerr JF, Winterford CM, Harmon BV. Apoptosis. Its significance in cancer and cancer therapy. Cancer 1994, 73: 2013–2026. [DOI] [PubMed] [Google Scholar]
- 31.Kyprianou N, Bruckheimer EM, Guo Y. Cell proliferation and apoptosis in prostate cancer: significance in disease progression and therapy. Histol Histopathol 2000, 15: 1211–1223. [DOI] [PubMed] [Google Scholar]
- 32.Du J, Deng HY. Mitochondrial intervention action in apoptosis. Res Med Educ 2009, 8: 345–348. [Google Scholar]
- 33.Bandoh N, Hayashi T, Kishibe K, Takahara M, Imada M, Nonaka S, Harabuchi Y. Prognostic value of p53 mutations, bax, and spontaneous apoptosis in maxillary sinus squamous cell carcinoma. Cancer 2002, 94: 1968–1980. [DOI] [PubMed] [Google Scholar]
- 34.Streffer JR, Rimner A, Rieger J, Naumann U, Rodemann HP, Weller M. BCL-2 family proteins modulate radiosensitivity in human malignant glioma cells. J Neurooncol 2002, 56: 43–49. [DOI] [PubMed] [Google Scholar]
- 35.Scorrano L, Nicolli A, Basso E, Petronilli V, Bernardi P. Two modes of activation of the permeability transition pore: the role of mitochondrial cyclophilin. Mol Cell Biochem 1997, 174: 181–184. [PubMed] [Google Scholar]
- 36.Barczyk K, Kreuter M, Pryjma J, Booy E, Maddika S, Ghavami S, Berdel W et al. . Serum cytochrome c indicates in vivo apoptosis and can serve as a prognostic marker during cancer therapy. Int J Cancer 2005, 116: 167–173. [DOI] [PubMed] [Google Scholar]
- 37.Hill MM, Adrain C, Martin SJ. Portrait of a killer: the mitochondrial apoptosome emerges from the shadows. Mol Interv 2003, 3: 19–26. [DOI] [PubMed] [Google Scholar]
- 38.Lee HJ, Lee HJ, Lee EO, Ko SG, Bae HS, Kim CH, Ahn KS et al. . Mitochondria-cytochrome C-caspase-9 cascade mediates isorhamnetin-induced apoptosis. Cancer Lett 2008, 270: 342–353. [DOI] [PubMed] [Google Scholar]
- 39.Zhang SJ, Wang XH, Cheng BL. Matrine induces apoptosis of glioma cell C6 and the possible mechanism. Chin J Cancer 2008, 15: 451–457. [Google Scholar]
Associated Data
This section collects any data citations, data availability statements, or supplementary materials included in this article.


