Abstract
There is no segmentation method that performs perfectly with any data set in comparison to human segmentation. Evaluation procedures for segmentation algorithms become critical for their selection. The problems associated with segmentation performance evaluations and visual verification of segmentation results are exaggerated when dealing with thousands of 3D image volumes because of the amount of computation and manual inputs needed.
We address the problem of evaluating 3D segmentation performance when segmentation is applied to thousands of confocal microscopy images (z-stacks). Our approach is to incorporate experimental imaging and geometrical criteria, and map them into computationally efficient segmentation algorithms that can be applied to a very large number of z-stacks. This is an alternative approach to considering existing segmentation methods and evaluating most state-of-the-art algorithms. We designed a methodology for 3D segmentation performance characterization that consists of design, evaluation and verification steps. The characterization integrates manual inputs from projected surrogate “ground truth” of statistically representative samples and from visual inspection into the evaluation. The novelty of the methodology lies in (1) designing candidate segmentation algorithms by mapping imaging and geometrical criteria into algorithmic steps, and constructing plausible segmentation algorithms with respect to the order of algorithmic steps and their parameters, (2) evaluating segmentation accuracy using samples drawn from probability distribution estimates of candidate segmentations, and (3) minimizing human labor needed to create surrogate “truth” by approximating z-stack segmentations with 2D contours from three orthogonal z-stack projections and by developing visual verification tools.
We demonstrate the methodology by applying it to a dataset of 1253 mesenchymal stem cells. The cells reside on 10 different types of biomaterial scaffolds, and are stained for actin and nucleus yielding 128 460 image frames (on average 125 cells/scaffold × 10 scaffold types × 2 stains × 51 frames/cell). After constructing and evaluating six candidates of 3D segmentation algorithms, the most accurate 3D segmentation algorithm achieved an average precision of 0.82 and an accuracy of 0.84 as measured by the Dice similarity index where values greater than 0.7 indicate a good spatial overlap. A probability of segmentation success was 0.85 based on visual verification, and a computation time was 42.3 h to process all z-stacks. While the most accurate segmentation technique was 4.2 times slower than the second most accurate algorithm, it consumed on average 9.65 times less memory per z-stack segmentation.
Keywords: 3D segmentation, segmentation evaluation, sampling, visual verification, confocal imaging, stem cells
1 BACKGROUND
Three-dimensional (3D) segmentation methods of digital volumetric data (called z-stacks) from confocal microscopy have been a research problem for a couple of decades (Indhumathi et al. 2011; Chen et al. 2014; McCullough et al. 2008; Lin et al. 2003; Herberich et al. 2011). In its simplest form, 3D segmentation is about labeling each volumetric element (voxel) as foreground or background. The need for 3D segmentation automation becomes prominent when hundreds or thousands of z-stacks have to be processed and the cost of manual segmentation is prohibitive. It has been widely accepted (Fenster and Chiu 2005; Udupa et al. 2006) that evaluations of automated segmentation have to include accuracy (validity), precision (reliability, repeatability), and efficiency (viability). Our goal is to address the problem of segmentation evaluation over a very large number of z-stacks.
Automated 3D segmentation over a large number of z-stacks often comes at a high computational cost and hence computational efficiency is of concern. There has been an abundance of 3D segmentation algorithms published in computer vision and medical fields with a frequently cited older review by Pal and Pal (Pal and Pal 1993). We have followed a more recent succinct review in (Wirjadi 2007) which divides segmentation approaches into classes such as thresholding, region-growing, deformable surfaces, level sets, and other concepts (watersheds, fuzzy connectedness, etc.). We selected a class of thresholding-based 3D segmentation approaches because of experimental criteria and computational efficiency. Within this class of 3D segmentation methods, we focus on a segmentation evaluation methodology rather than on a broad range of existing 3D segmentation methods and/or their trade-offs between speed and accuracy.
While there is a plethora of 3D segmentation algorithms based on thresholding, each segmentation solution is customized to a particular experiment and its datasets by choosing a specific sequence of segmentation steps and parameters. Thus, the construction and optimization of such 3D segmentation algorithms have to be supported by evaluations and verifications of segmentation results. The challenges of segmenting a large number of z-stacks lie not only in the algorithmic design but also in the design of methodology evaluation procedures that scale over a thousand of z-stacks and minimize any needed human labor.
Previous work on segmentation evaluation frameworks has been reported in several papers (Y. Zhang 1996; Y. J. Zhang 2001; Zou et al. 2004; Udupa et al. 2006; Shah 2008; Fenster and Chiu 2005; Cardoso and Corte-Real 2005). The evaluation methods are broadly divided into analytical and empirical methods (Cardoso and Corte-Real 2005; Y. Zhang 1996). Due to the difficulties in comparing algorithms analytically, the majority of published segmentation algorithms are evaluated by empirical methods that are classified into goodness and discrepancy types. The goodness type needs a set of conditions according to human intuition that are mapped into measured parameters. The discrepancy type is based on the availability of ground truth or at least a surrogate “ground truth”. We have built our 3D segmentation evaluation methodology as an empirical discrepancy method with the focus on pixel level accuracy. While object level evaluations might be appropriate for cell counting or tracking (Cohen et al. 2009), the biological study behind the current work requires pixel level evaluations of 3D cell geometry. The challenges of evaluation lie not only in establishing a surrogate “ground truth” and measuring accuracy but also in understanding precision of the surrogate “truth” and its labor demands.
Our interest in automated 3D segmentation comes from investigating the effects of various biomaterial scaffolds on 3D shape of stem cells (Farooque et al. 2014). It was hypothesized that a scaffold type affects cell morphology and influences cell behavior. To obtain statistically significant evidence for testing this hypothesis, primary human bone marrow stromal cells (hBMSCs) were cultured on 10 scaffold types. The cells were stained for actin and nucleus, and imaged using confocal laser scanning microscopy (CLSM) over approximately 100 cells (i.e., z-stacks) per scaffold type. To this end, we aim to measure and analyze 3D cell shapes after cell (foreground) voxels in each z-stack are labeled by an automated 3D segmentation algorithm.
In this context, we pose the following research questions.
How do we construct a 3D segmentation algorithm based on the experiments designed to test the aforementioned biological hypothesis?
How do we evaluate accuracy and precision of 3D segmentation algorithms over more than a thousand z-stacks?
How do we verify 3D segmentation algorithmic performance over a large number of z-stacks?
We approach the research problems in three steps: design, evaluate, and verify.
The algorithmic design consists of analyzing imaging and geometric criteria of the cell-scaffold interaction experiments, and then mapping them into a set of algorithmic steps. The algorithmic steps are ordered into six plausible segmentation sequences that form the pool of evaluated algorithms.
Next, the accuracy and precision evaluation is executed by establishing surrogate measures of “ground truth” called reference segmentations via manual segmentation. We select two z-stack samples per scaffold for manual segmentation to minimize the manual labor needed to create reference segmentations. The two samples are the most and the least representative z-stacks in terms of foreground voxel counts. The voxel counts are obtained by six candidate segmentation algorithms. Foreground voxel counts over all cells per scaffold type form six probability distribution functions (PDFs) that are combined to a sampling score per z-stack. Experts perform manual segmentation by contouring only two z-stack samples per scaffold and only three orthogonal max intensity projections of each z-stack instead of a much larger number of z-stack frames (12 to 298 frames). The number of manually contoured 2D images represents 0.09 % of all actin frames (10 scaffolds × 2 samples × 3 orthogonal projections / total number of 64 230 actin frames) that would have to be contoured in order to create manual segmentations of all 1253 cells based on actin stain. Sampling adequateness is evaluated visually.
Finally, verification consists of applying to all 10 scaffold types the two most accurate segmentation algorithms based on reference segmentations. All 3D segmentation results are converted into a mosaic of three orthogonal 2D projections and into 3D meshes for 2D and 3D visual verification. The pre-processing into 2D mosaics and 3D meshes minimizes the amount of human time and enables fast browsing with fixed 2D views and interactive 3D views. In return, additional measurements are obtained about segmentation quality and segmentation accuracy estimates are related to the verification results. The verification provides labels for (a) rejected cells (e.g., due to faint stain or due to touching the edges of a field of view (FOV)), (b) missed cells (i.e., the segment is other than the desired cell), and (c) inaccurately segmented cells (i.e., the segment corresponds to the desired cell but the shape deviates from the correct shape based on visual verification by an expert). The aforementioned methodology helps us to characterize segmentation precision, accuracy, efficiency, and the probability of segmentation success/failure.
2 MATERIALS AND METHODS
We start with the description of z-stacks (3D images), and then divide the overall methodology of 3D segmentation into design, evaluation and verification parts. These three parts map into the three research questions posed in the introduction.
2.1 Materials and Imaging
The effect of scaffold type on cell and nucleus structure was investigated with confocal microscopy. Ten scaffolds were investigated (Table 1).
Table 1.
Scaffold type abbreviations and descriptions
| Abbreviation | Description |
|---|---|
| SC | flat films of spuncoat poly(ε-caprolactone) (PCL, relative molecular mass 80 000 g/mol); |
| SC+OS | flat films of spuncoat PCL with osteogenic supplements (OS, 10-nmol/L dexamethasone, 20-mmol/L β-glycerophosphate, 0.05-mmol/L L-ascorbic acid); |
| NF | electrospun PCL nanofibers (dia. 589 nm); |
| NF+OS | electrospun PCL nanofibers with OS; |
| MF | electrospun PCL microfibers (dia. 4.4 μm); |
| PPS | porous polystyrene scaffolds (Alvetex, pore size 36 μm to 40 μm, Reinnervate, Inc.); |
| MG | matrigel (reduced-growth factor Matrigel, BD Biosciences); |
| FG | fibrin gel (fibrinogen from human plasma (6 mg/mL) polymerized with thrombin from human plasma (25 U/mL), Sigma, Inc.); |
| CG | collagen gel (PureCol bovine type I collagen, Advanced BioMatrix); |
| CF | collagen fibrils prepared as described (Elliott et al. 2007) |
Primary human bone marrow stromal cells (hBMSCs, Tulane Center for Gene Therapy, donor #7038, 29 yr. female, iliac crest) were cultured in medium (α-MEM containing 16.5% by vol. fetal bovine serum, 4 mmol/L L-glutamine, and 1 % by volume of penicillin/streptomycin) in a humidified incubator (37 °C with 5 % CO2 by vol.) to 70 % confluency, trypsinized (0.25 % trypsin by mass containing 1 mmol/L ethylenediaminetetraacetate (EDTA), Invitrogen) and seeded onto substrates at passage 5. SC, SC+OS, NF, NF+OS, MF, PPS and CF substrates were placed in multi-well plates and cells suspended in medium were seeded onto them at a density of 2500 cells/cm2. MG, FG, and CG cells were suspended in the liquid gel components and dispensed into multi-well plates prior to gelation such that the cell concentration was 2500 cells/cm2 (based on the area of the well). hBMSCs were cultured for 1 d for all treatments prior to imaging. After 1 d culture, cells on scaffolds were fixed with 3.7 % (vol./vol.) formaldehyde and stained for actin (330 nmol/L Alexa Fluor 546 phalloidin, Life Technologies) and nucleus (0.03 mmol/L 4′,6-diamidino-2-phenylindole, DAPI, Life Technologies). More than 100 cells were imaged per scaffold type to provide statistically meaningful results.
Cells were imaged (confocal laser scanning microscope, SP5 II, Leica Microsystems) using a 63× water-immersion objective (numerical aperture 0.9). A z-stack with two channels (1 airy unit, actin 543 nm excitation and emission 564 nm to 663 nm; nucleus 405 nm excitation and emission 434 nm to 517 nm) was collected for each of 1253 cells. Only individual hBMSCs that were not touching other cells (one nucleus per object) were imaged. Based on the manufacturer’s defined resolution for the 63× objective (xy = 217 nm and z = 626 nm for 488 nm wavelength), we defined our acquisition voxel dimensions at 240 nm × 240 nm × 710 nm (x-,y- and z-axis, respectively) and drew conclusions on shape features greater than 0.1 mm in size. Each z-frame in the z-stacks was exported as a 1 MB tif image with a resolution of 1024 × 1024 pixels (246 μm × 246 m). Examples of z-frame tif images are shown in Figure 1. Statistics of the z-frames are summarized in Figure 2. The data collection generated z-stacks of 1253 cells, which is equivalent to 128 460 z-frames (on average 125 cells/scaffold × 10 scaffold types × 2 stains × 51 frames/cell frames stored as tif files) and 135 GB.
Figure 1.
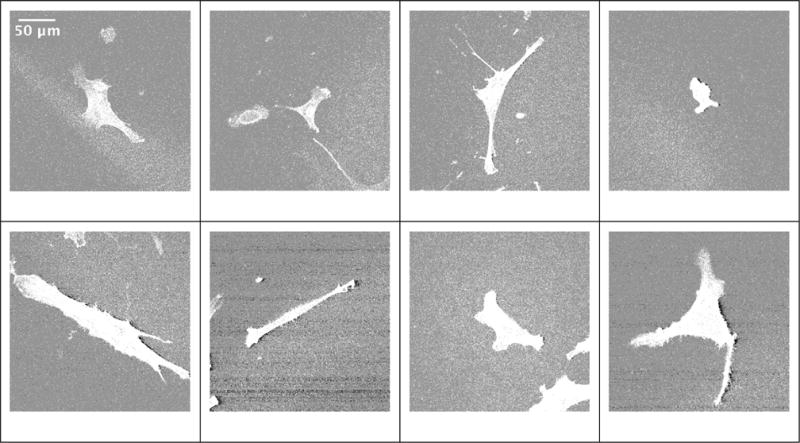
Shape variations of 2D middle cross sections of z-stacks representing cells on spun coat scaffold. The actin stained images are displayed by showing all values above zero intensity.
Figure 2.
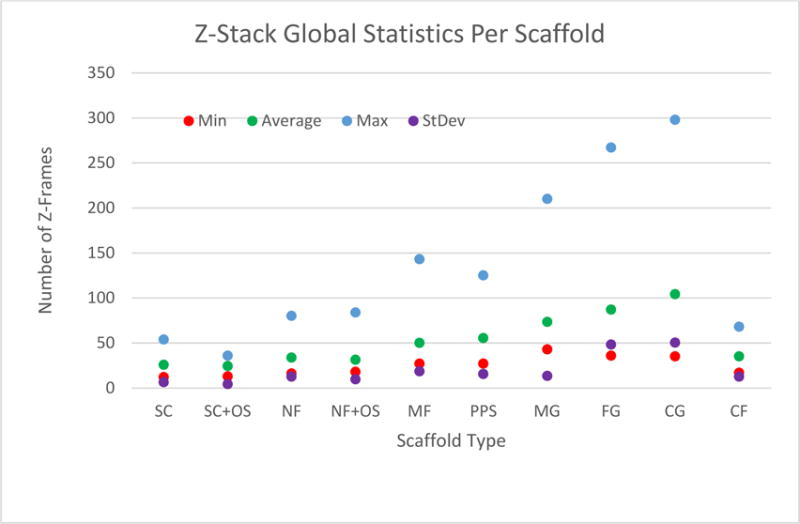
Statistics about the number of z-frames per z-stack over 10 scaffold types
2.2 Design: Construction of Candidate 3D Segmentation Algorithms
For evaluation purposes, the space of all plausible automated 3D segmentation algorithms that are applicable to the 1000+ z-stack experiment should be narrowed down. Each 3D segmentation algorithm consists of a set of algorithmic steps. We select candidate algorithmic steps based on imaging and geometrical experimental criteria first. Next, we apply a set of problem constraints to filter all possible permutations of algorithmic steps into a biologically admissible subset. The outcome is a set of six 3D segmentation algorithms whose accuracy will be evaluated.
Algorithmic steps
Table 2 summarizes imaging and geometrical criteria for identifying cellular objects in the biological experiments designed to study cell-scaffold interaction. Each criterion is mapped to an algorithmic step based on an assumed image property. The numerical values in the last geometrical criterion are directly related to our 3D data. The values were established based on a discussion between cell biologists and computer scientists, since they depend on specific image acquisition settings. The last column in Table 2 also provides abbreviations for the five algorithmic steps that will be used for constructing plausible 3D segmentation sequences (T, E, F, L, and M).
Table 2.
Mapping criteria for identifying cellular objects to algorithmic steps of automated segmentation.
| Criterion Type | Criterion Description | Segmentation Algorithmic Step | Abbreviation | Comment |
|---|---|---|---|---|
| Imaging | Signal from a cell is higher than background noise | Intensity thresholding | T | All voxels with intensity above the chosen threshold become foreground, all other pixels become background |
| Imaging | A cell touching the edge of the field of view will be discarded | Removal of objects touching the image edges | E | The shape of a cell touching the edge of the field of view cannot be determined since it is cut-off (part of the cell body is outside the field of view) |
| Geometry | A cell does not contain any enclosed cavities | Spatial filling of cavities | F | Generally, cells are not expected to have cavities within their volume. However, it is conceivable that a cell could have a tunnel if it were wrapped around a fiber, or a void volume if it was wrapped around a spherical object. |
| Geometry | a) A cell shape is continuous and does not have disconnected parts b) The cell will be the largest object in an image (background debris in the image are smaller than the cell) |
Spatial- and intensity-based removal of small objects | L | a) Only one object should remain after segmentation b) The largest object in the image that is not touching the edge of the image will also be the one object remaining after segmentation |
| Geometry | Lessen contribution of image features below 1 μm in size | Surface smoothing of objects to remove features < 1 μm in size: closing, opening with 3×3×3 kernel that corresponds to 0.72 μm (x) by 0.72 μm (y) by 2.139 μm (z) | M | Although cells have sub-micrometer features, the uncertainty in image data at this size-scale is not reliable, could arise from noise or debris, and may be artifactual |
Order of algorithmic steps
Following the analysis in Supplemental Document A, we narrowed down the space of 120 possible segmentation sequences to two evaluated algorithmic sequences with and without geometric criteria: T➔E and T➔E➔F➔L➔M➔L.
Constructed candidate algorithmic sequences
The two sequences above contain two parameters: the method for estimating the intensity threshold in step T and the type of morphological operation in step M. We followed the work in (Sezgin and Sankur 2004) that includes evaluation and ranking of 40 methods for selecting an intensity threshold. The accuracy evaluations in (Sezgin and Sankur 2004) are based on document images and “non-destructive testing images” including laser scanning confocal microscopy images. We have tested performance of the top ranked methods from the six categories of thresholding techniques by leveraging implementations in Fiji (Schindelin et al. 2012) and our own prototype implementations. Based on the published ranking in (Sezgin and Sankur 2004) and our visual performance assessment using our data, we selected minimum error thresholding (T1) and topological stable state thresholding (T2).
The two types of morphological operations in step M are either Closing➔Opening (M1) or Opening➔Closing (M2). Both thresholding and morphological parameters are described in the Supplemental Document B. Based on the above parameters, six segmentation algorithms for accuracy evaluations are defined as summarized in Table 3.
Table 3.
Summary of designed six segmentation algorithms.
| Incorporated Assumption(s) | Threshold Optimization | Morphological Optimization | Segmentation Algorithm | Abbreviation |
|---|---|---|---|---|
| Imaging | Minimum error | N/A | T1➔E | A1 |
| Topological stable state | N/A | T2➔E | A2 | |
| Imaging and Geometry | Minimum error | Closing➔Opening | T1➔E➔F➔L➔M1➔L | A11 |
| Opening➔Closing | T1➔E➔F➔L➔M2➔L | A12 | ||
| Topological stable state | Closing➔Opening | T2➔E➔F➔L➔M1➔L | A21 | |
| Opening➔Closing | T2➔E➔F➔L➔M2➔L | A22 |
2.3 Evaluation: Accuracy and Precision of 3D Segmentation Algorithms
In the absence of accurate first principle simulations, a segmentation reference can be obtained via imaging phantoms or providing manual inputs. Unfortunately, imaging phantom objects is very difficult because the properties of a cell and surrounding media and of a phantom and surrounding media must match experiments. Further, the culture environment, such as the type of scaffold in which the cell was cultured, will affect the phantom imaging. Turning our attention to manual inputs and to empirical discrepancy methods (Y. Zhang 1996; Cardoso and Corte-Real 2005), a segmentation reference would be established ideally by manual contouring each 2D cross section of a z-stack while viewing the z-stack from multiple viewpoints. This approach would require manual input for approximately 64 230 frames in our dataset (on average 125 cells/scaffold × 10 scaffolds × 51 frames/cell) and is clearly labor prohibitive.
In order to minimize the overall manual labor, we introduce sampling and “minimum effort” manual labeling using orthogonal projections as illustrated in Figure 3. We proceeded following the enumerated steps in Figure 3.
Figure 3.
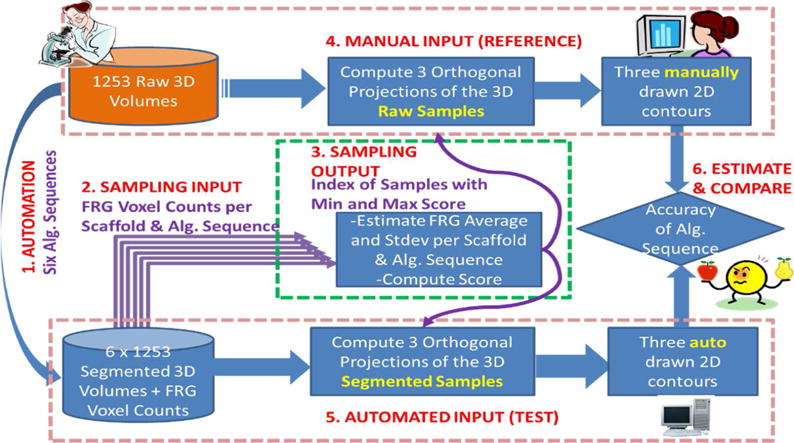
An overview of segmentation accuracy estimation. “Alg.” stands for algorithm.
Six automated algorithmic sequences are applied to all 1253 raw z-stacks to obtain segmented 3D volumes and foreground voxel counts.
A set of average and standard deviation values is computed from the foreground voxel counts per scaffold type and algorithmic sequence k.
- Each z-stack j is associated with score(j) according to Eq. (1).
where Ck(j)) is the FRG voxel count obtained by the k-th segmentation algorithm for the j-th z-stack. The score can be viewed as a normalized residual subtracting the effect of six algorithms on the FRG voxel count. Given the score per z-stack, one can choose any number of samples between the smallest to the largest normalized residuals that correspond to the most representative of the most deviating cell in terms of foreground (FRG) voxel count. We chose to draw two extreme samples per scaffold type according to Eq. (2).(1)
where j1 and j2 are the indices of the two extreme samples (global min and max residuals). Figure 4 illustrates the application of steps 2 and 3 in Figure 3 (sampling methodology) to the z-stacks from Collagen Fibrils scaffold.(2) Three orthogonal max intensity projections (X-Y, X-Z, and Y-Z shown in Figure 5) of each sampled z-stack are presented to a human expert for manual contouring and then processed into a connected 2D region by painting interior pixels.
After performing the six automated segmentations listed in Table 3, each sampled z-stack is projected into the three orthogonal planes and the segmented foreground pixels in each projection are labeled into a connected 2D region.
Figure 4.
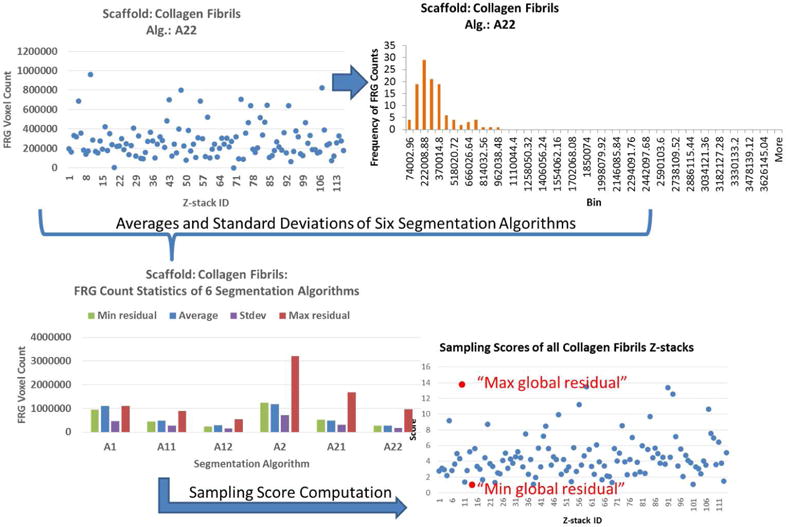
Illustration of the sampling methodology applied to 114 z-stacks from Collagen Fibrils scaffold collection. The two red dots in the lower right panel correspond to the two z-stacks selected for manual segmentation.
Figure 5.
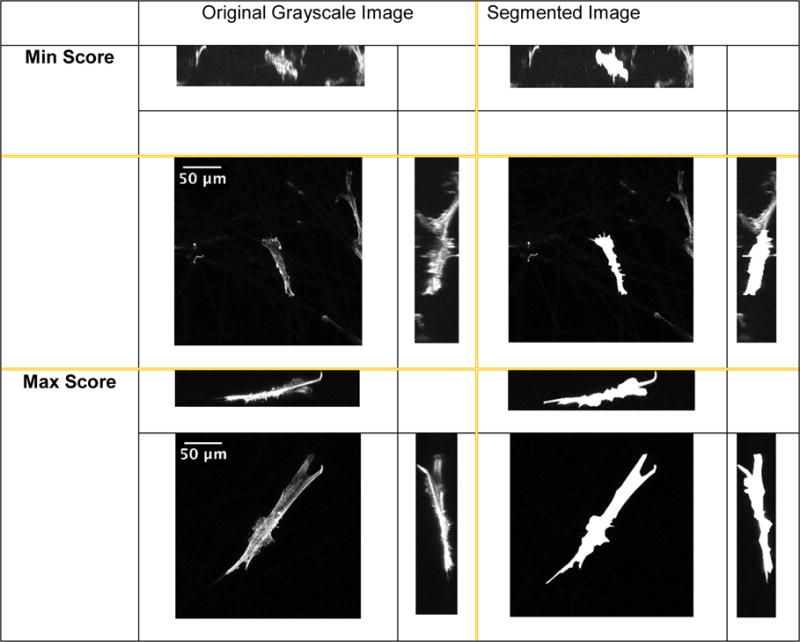
Two examples of three orthogonal max intensity projections of the min (top) and max (bottom) scores for Microfiber scaffold. Left column shows the projections of the original z-stack. Right column shows manually segmented three projections of the same z-stack. The ZX and YZ projections have been scaled in the Z direction.
The Dice index has been used frequently as a similarity measure for spatial overlap and is related to the kappa statistic for evaluating inter-rates agreement (Zou et al. 2004). Values larger than 0.7 indicate a good spatial overlap (Zou et al. 2004).
In order to determine the most accurate segmentation sequence, we compute the average of all Dice indices over all compared samples of segmentation references and their three orthogonal projections, and then compare them across the six candidate algorithmic sequences. To execute the overall methodology in our specific case, the total number of segmentation executions is equal 6 × 1253 × 9 = 67 662, for the 6 algorithms in Table 3 to segment 1000+ z-stacks 9 times in order to find optimal threshold for the minimum error thresholding (T1) and the topological stable state thresholding (T2). The choice of 9 threshold values for the optimization was preceded by sample runs over 255 threshold values, and selecting the maximum threshold value as the range.
Segmentation precision is established by four experts performing manual segmentation of the same z-stacks. The resulting segmentation masks are compared pair-wise and the average Dice index is reported as a measure of repeatability (segmentation precision).
2.4 Verification: 3D Segmentation Results over a Large Number of Z-stacks
The previously described methodology does not guarantee accurate segmentation for every z-stack because it is computed only over the sampled z-stacks and against three orthogonal 2D projections instead of full 3D segmentation. Our goal is to use visual verification for detecting segmentation failures with minimal human effort, and use the results for quality control and for computing the probability of segmentation failure.
To minimize human labor, we converted each 3D segmentation into a mosaic of three orthogonal projections for 2D visual verification shown in Figure 6. An expert browsed a folder of such mosaic images and provided annotations classified according to the left column of Figure 6.
Figure 6.
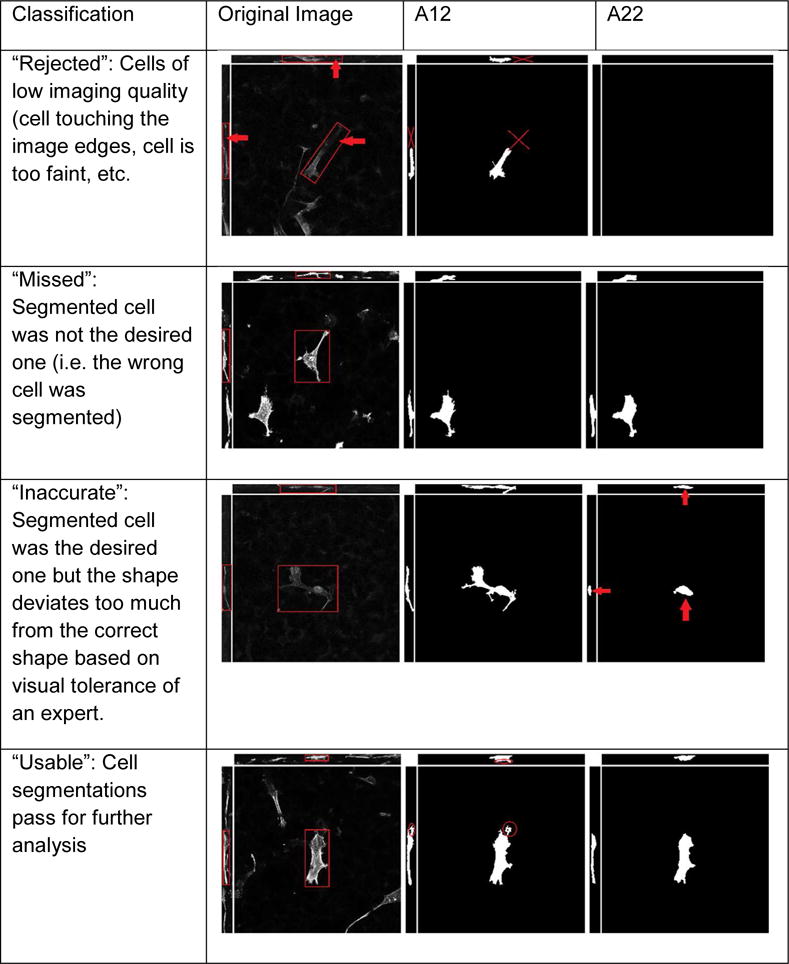
Annotations, three orthogonal projections of a z-stack with actin channel and PPS scaffold, and the segmentation results obtained by executing the top two algorithmic sequences. The cells of interest are denoted by a red box. The z-stack voxels here were projected as cubic voxels without being scaled in the z-dimension. The size of the XY projections is 246 μm × 246 μm.
Furthermore, we converted segmentation results into a multi-resolution pyramid of 3D meshes and designed a web-based visualization for 3D visual verification shown in Figure 7. The 3D visualization allows a quick visual assessment of 3D shapes. Additional sorting and color-coding capabilities were used for verifying shape accuracy and reporting annotation labels.
Figure 7.
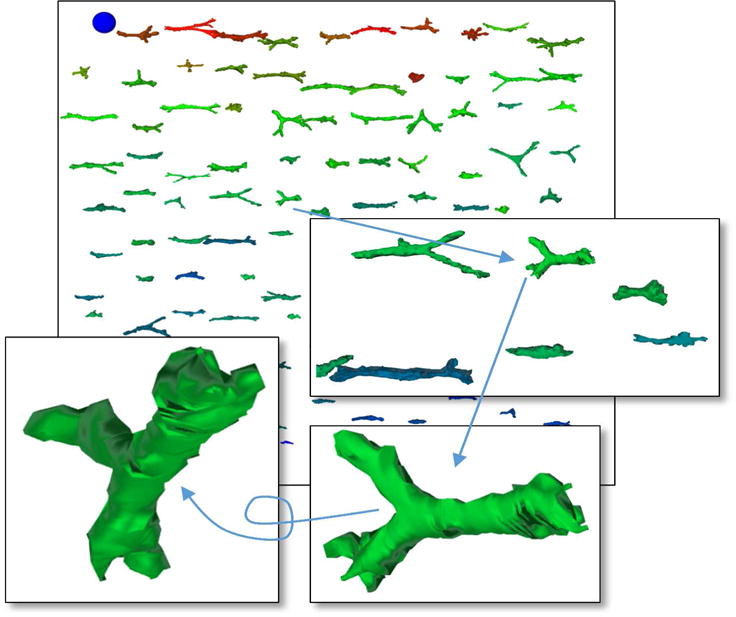
A 3D web-based visualization of 100+ z-stacks from the same collagen scaffold type. The insets illustrate the interactivity during visual inspection. The blue ball is used as a spatial scale.
3 EXPERIMENTAL RESULTS
We have followed the three parts of the 3D segmentation evaluation methodology (design, evaluate, verify) described in Section 2 and applied them to 1253 cells.
3.1 Design: Ordered Segmentation Sequences
The six candidates of 3D segmentation sequences were applied to the 1253 actin channel z-stacks to generate 7518 segmentation outcomes. We investigated two questions related to (a) the importance of each algorithmic step (or each corresponding criterion) on the final foreground (FRG) voxel counts and (b) the sensitivity of FRG counts per algorithmic step across scaffold types.
Figure 8 shows the average FRG count after each step of one of the sequences A12: T1➔E➔F➔L➔M2➔L for the 10 scaffolds. We observed the largest negative rate after thresholding T1 and the second largest rate after the step L (removal of all connected regions but the largest one). Thus, T1 and L steps are the most important in terms of FRG voxel count. FRG voxel counts did not change significantly during the E (removal around edges) and F (hole filling) steps.
Figure 8.
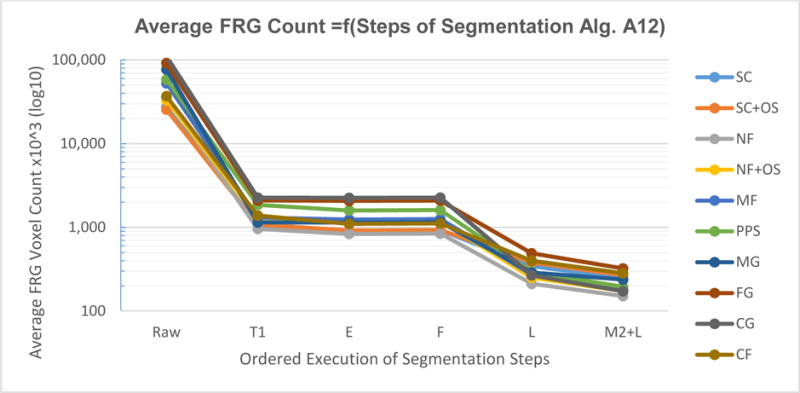
Average FRG voxel count per scaffold after executing each step of the segmentation sequence A12: T1➔E➔F➔L➔M2➔L. The legend denotes the scaffold types.
For most of the segmentation steps, the lines in Figure 8 had similar slopes indicating that the 6 segmentation algorithms were not sensitive to a scaffold type. Some degree of scaffold sensitivity is seen after the step F (lines cross each other between F to L). These observations are true across all 6 segmentation algorithms.
3.2 Evaluation: Manual Segmentation Precision
In order to establish a surrogate “truth” via manual segmentation, we investigated precision of manual segmentation over a set of three z-stacks (cells) segmented by four experts. We chose cells on Collagen Gel scaffold because these cells have been observed to have the largest 3D extent, which is important in assessing 3D segmentation accuracy. Two cell biologists and two computer scientists manually segmented three orthogonal projections per cell (9 images). Figure 9 summarizes precision statistics per cell projection of Dice index. The Dice index has an overall average precision of 0.82 and standard deviation of 0.07. These results demonstrate consistent enough manual segmentations (Dice index larger than 0.7). The fact that manual segmentations by four experts resulted in an average Dice index of 0.82 indicates that image data are of sufficient quality to be segmented and analyzed.
Figure 9.
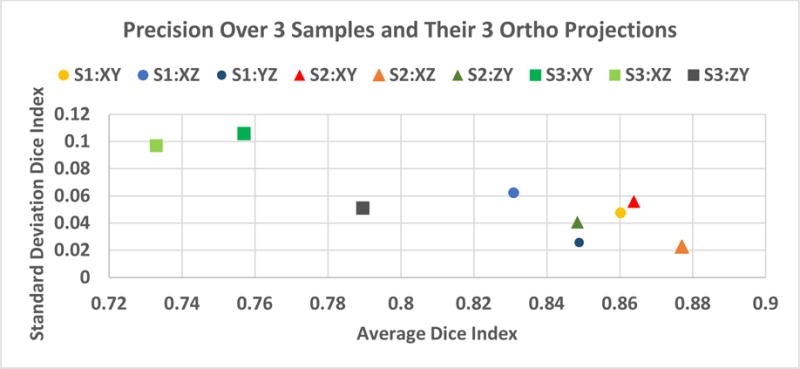
Repeatability (precision) of manual segmentations estimated over three cell samples (S1, S2, S3) times 3 orthogonal projection images (XY, XZ, YZ) by four human subjects.
3.3 Evaluation: Automated Segmentation Accuracy
We evaluated segmentation accuracy based on 20 cells selected according to the described sampling methodology (two cells per scaffold). The cells were manually contoured using the polygon drawing tool in ImageJ/Fiji (Schindelin et al. 2012). The projections of the automated segmentation and the manually contoured masks were compared by using the Dice index. The 20-cell collection was extended by additional 10 cells drawn from various scaffolds (2 PPS, 1 MF, 1 CF, 1 CG, 2 MG, 2 NF, 1 NF+OS) and manually segmented. The additional 10 cells were selected and manually segmented through the iterative process of imaging, evaluation and verification (quality control). The iterative process started with 1147 cells that were reduced to 873 cells via quality control. In the next two iterations, additional 106 cells were imaged yielding a total of 1253 cells and 30 manually segmented cells. We investigated the question whether the accuracy estimations from 20 initially sampled cells are similar to the estimations from 30 sampled cells collected during the iterative quality control process.
The Dice index based segmentation accuracies per segmentation algorithm are shown in Figure 10 (top) for the case of 20 cells and 30 cells. The two segmentation sequences with only imaging criteria (A1: T1➔E and A2: T2➔E) performed much worse than the algorithmic sequences with imaging and geometric criteria. This result emphasized the importance of mapping tacit geometric knowledge about cells into algorithmic steps. Next, the inclusion of M2 (Opening➔Closing) led to higher accuracy than the inclusion of M1 (Closing➔Opening). This indicates that the thresholding step did not remove voxels with low intensity and hence M2 was preferred to shrink the foreground. Finally, the comparison of average accuracies reported for 20 and 30 cells are quite similar considering that they represent 1.6 % (20/1253) and 2.4 % (30/1253) of the cells. This suggests that the 20 cells selected by the score based sampling be sufficient for evaluating the segmentation candidates.
Figure 10.
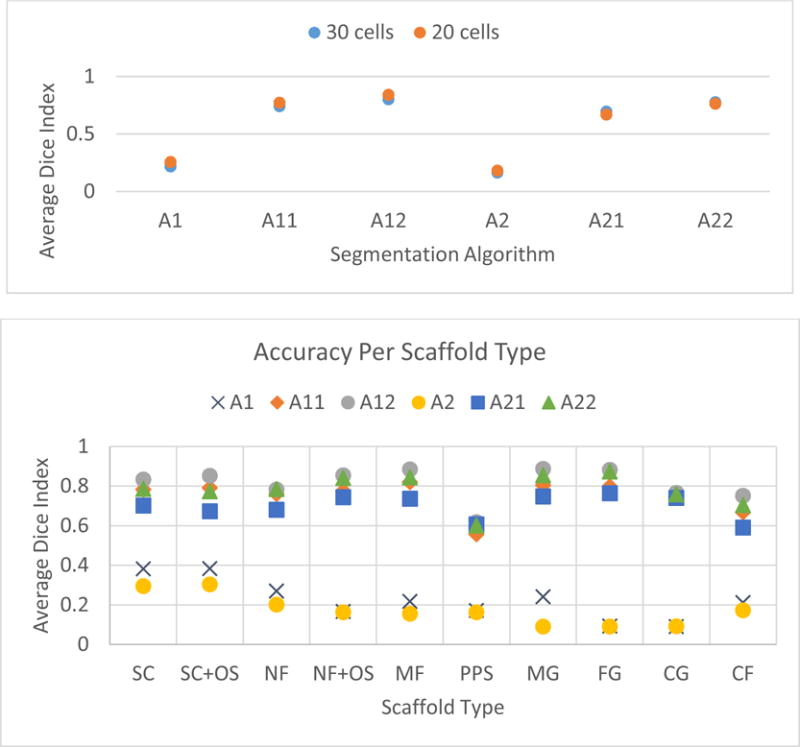
Top: Segmentation accuracy of six segmentation algorithms measured by average of the Dice index over 20 or 30 manually segmented cells. Bottom: Segmentation accuracy estimations per scaffold type established based on 30 cells that were manually segmented.
Based on the results in Figure 10 (top), the segmentation sequences A11: T1➔E➔F➔L➔M1➔L, A12: T1➔E➔F➔L➔M2➔L and A22: T2➔E➔F➔L➔M2➔L delivered an average accuracy larger than 0.7 based on the Dice similarity index. One would also like to know the robustness of accuracy estimates to scaffold type. In other words, is there a need for a scaffold-specific segmentation algorithm? Figure 10 (bottom) shows the accuracy estimates per scaffold type. The results demonstrate that the sequences A12 and A22 are consistently more accurate across all scaffold types. Thus, one segmentation algorithm is sufficient for the segmentation task with multiple scaffolds. Note that the segmentation accuracy estimate for PPS scaffold is less than 0.7 because the automated segmentation failed for one of the four selected PPS samples. This points to the small sample size if the accuracy evaluation is refocused from the entire collection of z-stacks to the subset of z-stacks per scaffold. From a quality control perspective, the best approach is to verify the segmentation accuracy estimates. Thus, we selected the top two performing sequences A12 and A22 for additional visual verification.
3.4 Evaluation: Efficiency
We have collected efficiency benchmarks on a desktop computer (Apple Mac Pro with 3.2 GHz Quad-Core Intel Xeon processor, and 16 GB of RAM). The execution was divided into (a) finding optimal threshold according to one of the two objective functions (implemented in Java language) and (b) applying all segmentation steps to obtain the segmentation (implemented in C language). Thus, the steps T1 and T2 were divided into the computations of threshold optimization O1 and O2 (threshold values between 1 to 9), and actual image thresholding T (i.e., T1={O1, T}, T2={O2, T}). All runs were executed using single threaded implementations.
Figure 11 (top) documents the relative efficiency of three computations O1, O2, and T➔E➔F➔L➔M2➔L that form the top two segmentation sequences A12 and A22. The computation O1 takes the highest percentage of time and there are some dependencies of the percent execution times on the scaffold type. The total times for O1, O2 and T➔E➔F➔L➔M2➔L were approximately 36.1 h, 8.6 h, and 6.2 h respectively.
Figure 11.
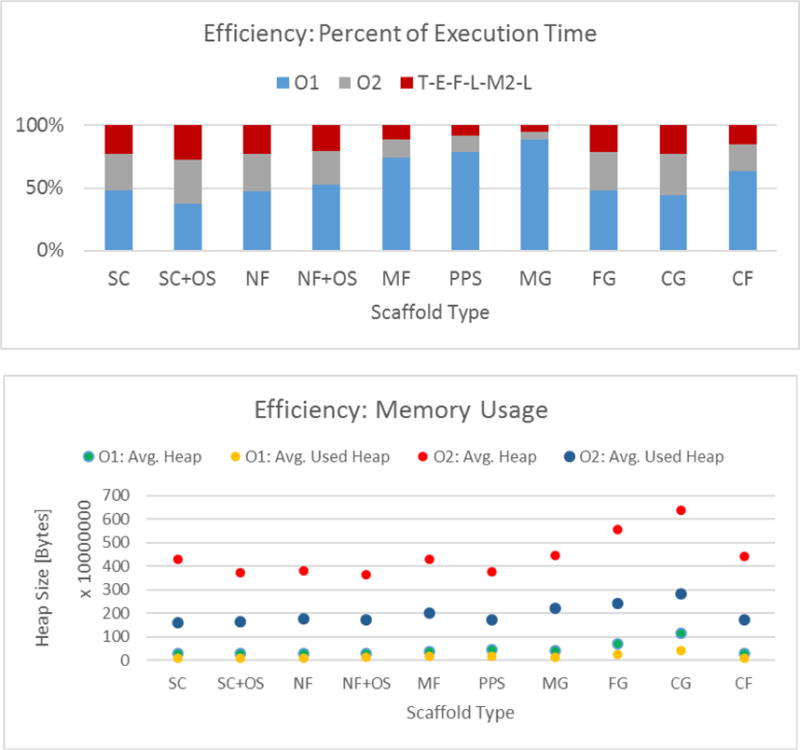
Top: Execution time efficiency for the top two performing sequences A12: T1➔E➔F➔L➔M2➔L and A22: T2 E➔F➔L➔M2➔L decomposed into O1, O2 and T➔E➔F➔L➔M2➔L computation times. Bottom: Memory benchmarks of two threshold optimization computations using O1 ~ Minimum error thresholding and O2 ~ Topological stable state thresholding approaches.
Figure 11 (bottom) shows the average heap memory size allocated by Java Virtual Machine (JVM) and the used heap memory size during threshold optimization computations O1 and O2. The average heap memory allocation per z-stack computed over all scaffolds for O1 is 0.46 GB (0.17 GB used heap) and for O2 is 4.44 GB (1.97 used heap). Based on Figure 11, we can conclude that the segmentation algorithms using O1 (minimum error thresholding) were 4.2 times slower (36.1/8.6) but consumed 9.65 times less memory (4.44/0.46) than the segmentation algorithms using O2 (topological stable state thresholding).
3.5 Verification
The best performing two segmentation sequences A12 and A22 were selected for visual verification. Table 4 provides a summary of the verification annotations for the actin channel z-stacks based on the mosaic of three orthogonal projections illustrated in Figure 6.
Table 4.
Summary of visual verification for the actin channel and the two segmentation sequences that differ by the thresholding step (A12 contains minimum error and A22 contains topological stable state thresholding step).
| Scaffold | Number of imaged cells | Number of rejected cells | Number of missed cells | Number of inaccurate shapes | Number of usable cells | |||
|---|---|---|---|---|---|---|---|---|
| A12 | A22 | A12 | A22 | A12 | A22 | |||
| SC | 139 | 8 | 4 | 3 | 16 | 16 | 111 | 112 |
| SC+OS | 122 | 3 | 0 | 0 | 14 | 12 | 105 | 107 |
| NF | 122 | 1 | 7 | 7 | 11 | 8 | 103 | 106 |
| NF+OS | 113 | 0 | 4 | 5 | 6 | 10 | 103 | 98 |
| MF | 165 | 14 | 4 | 5 | 40 | 45 | 107 | 101 |
| PPS | 136 | 1 | 10 | 11 | 18 | 85 | 107 | 39 |
| MG | 115 | 1 | 0 | 0 | 0 | 0 | 114 | 114 |
| FG | 113 | 0 | 0 | 0 | 13 | 20 | 100 | 93 |
| CG | 114 | 0 | 0 | 0 | 12 | 24 | 102 | 90 |
| CF | 114 | 2 | 5 | 4 | 0 | 13 | 107 | 95 |
| Total | 1253 | 30 | 34 | 35 | 130 | 233 | 1059 | 955 |
Based on Table 4, the segmentation algorithm A12 reported much fewer inaccurate shapes than the algorithm A22 (130 versus 233) which is consistent with the accuracy estimates (Dice index 0.84 versus 0.76). Thus, by proceeding with the segmentation sequence A12: T1➔E➔F➔L➔M2➔L we can assign the probabilities of segmentation failure 0.15 ((1253−1059)/1253) and success 0.85 (1059/1253) over all 10 scaffolds in addition to the accuracy, precision and efficiency measurements. The probability of failure can be decomposed into percent contributions from cell z-stack rejection due to imaging 2.4 %, missed cell region 2.7 %, and inaccurate shape 10.3 %.
4 DISCUSSION
Input data
We have considered the segmentation task for various image inputs in the context of cell volume quantification. Even though 3D segmentation could be applied to actin or nucleus or combined channel inputs, we focused on the actin channel. The nucleus was also stained in each cell to confirm that the actin-based segmented object was a cell. In fact, the nucleus presence confirms that objects are not dust or debris. Staining cells in scaffolds is challenging since there can be high background from fluorophore binding to the scaffold matrix. In the present work, cells were imaged within 10 different scaffolds making it difficult to find an optimal stain that had low intensity background in all scaffolds. We selected phalloidin (Alexa fluor 546 phalloidin) since phalloidin is a small molecule fungal toxin that binds specifically to actin and would be expected to yield low intensity background. Distance was calibrated in confocal Z-stacks using a NIST-traceable stage micrometer (Klarmann Rulings). Additional calibration was performed by imaging fluorescent spheres (FocalCheck Microspheres, 15 μm, LifeTech) to estimate shape uncertainty of the confocal Z-scanning system.
Methodology
The choice of two samples per scaffold was motivated by minimizing human labor. Contouring a minimum residual (“typical”) cell and a maximum residual (“atypical”) cell in term of its FRG voxel count was feasible over 10 scaffolds. Other criteria can be imposed on the residual values to choose sample cells. Ideally, one would like to sample cells that would be annotated as “rejected” or “missed cell” in proportions to the cells with accurate and inaccurate shapes.
Though manual segmentation of each 2D frame in a Z-stack would be the most accurate method to validate automated segmentations, this approach is prohibitively labor-intensive. In our case, the exhaustive manual segmentation would require 128 460 images in the entire dataset. If we chose only 2 cells per scaffold × 10 scaffolds × 521 z-frames per cell (representing the sum of average number of z-frames per scaffold) then the manual segmentation would still require 10 420 images. In contrast, manual segmentation of a 2D X-Y projection or a random z-frame is the most rapid approach, but does not consider the 3D nature of the datasets. Thus, a compromise was selected where X-Y, Z-Y and Y-Z projections (3 orthogonal maximum intensity projections) were manually segmented. This approach minimizes manual labor while also accounting for the 3D nature of the data. A more thorough uncertainty analysis might be needed in the future to understand the trade-offs between labor savings and accuracy of segmentation references.
While we described the procedure for selecting the auto-thresholding methods in Section 2.2, the choice of only two methods was driven by combinatorial complexity and required computational time. By adding another auto-thresholding method we would introduce 1253 z-stacks × 9 threshold values = 11 277 additional segmentations to find the optimal threshold. Given our focus on evaluation methodology rather than on computational speed, we did not want to exceed more than two days of computations to obtain results for the current total number of segmentations (67 662 segmentations ~ 42.3 h). However, it is important to state that the described methodology is computationally demanding as the parameter search space of auto-thresholding methods and their threshold values could be very large.
Another frequently reported measure of segmentation quality is its robustness to background noise and various artifacts. In our case, the noise robustness has been addressed by threshold optimization. Although we used two of many published threshold optimization techniques (Sezgin and Sankur 2004) that had been evaluated, we performed additional experiments to verify the noise robustness of the segmentation sequences. We generated synthetic cell models as a sphere with the radius of 50 pixels and a prolate spheroid with the parameters [a=25, b=25, c=50]. They were represented by the z-stack dimensions of 128 × 128 × 110 voxels. For each cell model, we added noise following Uniform and Gaussian probability distribution function (PDF) with either maximum or standard deviation values between 10 and 130 in the increments of 10. As expected for 8 bit per pixel z-stacks, the estimated volume (FRG count) by the method A12 starts to deviate from the reference value at 130 for Uniform PDF and at 70 for Gaussian PDF. We did not simulate various artifacts such as debris, cells leaving the FOV, or touching cells because the simulation models would have to be developed and validated, and their parameters estimated from the data.
Experimental results
We observed consistency of the segmentation accuracy results measured for A12: T1➔E➔F➔L➔M2➔L (Dice index of 0.84 and the probability of segmentation success of 0.85). The segmentation accuracy evaluation and visual verification represent both quantitative and qualitative measurement approaches. The quantitative approach, comparing manual and automated segmentation, is based on methods for selecting representative cell samples from the cell populations and for evaluating the accuracy of sample segmentations at pixel or voxel level. The qualitative approach, a visual inspection of all segmented cells for quality control, makes use of 2D and 3D tools (see Figure 6 and Figure 7), and an expert’s evaluation based on the tacit rules for annotation categories. There is more ambiguity in annotating “inaccurate shape” than “rejected cells” or “missed cells”, because the visual tolerance in defining “inaccurate shape” is hard to quantify. In our work, the visual tolerance was following approximately the 75 % rule used in (Lou et al. 2014). In other words, a cell is segmented accurately enough if the automated segmentation has at least 75 % overlap with the expert’s perceptual segmentation.
5 CONCLUSIONS
We have designed a methodology for evaluating automated 3D segmentation results over a large number of z-stacks. The methodology is generalizable to a class of problems where imaging and biological criteria can be translated into a finite set of segmentation algorithms. The key contributions of our work are in (1) designing and constructing candidate segmentation algorithms, (2) evaluating segmentation precision, accuracy and efficiency, and (3) verifying segmentation success visually. We constructed and evaluated six 3D segmentation algorithms, and visually verified two of them to deliver 1059 high-quality segmentations from 1253 z-stacks. The most accurate 3D segmentation algorithm achieved an average precision of 0.82 and accuracy of 0.84 measured by the Dice similarity index, the probability of segmentation success 0.85 based on visual verification, and the computational efficiency of 42.3 h to process all z-stacks. While the most accurate segmentation was 4.2 times slower than the second most accurate algorithm it consumed on average 9.65 times less memory per z-stack segmentation.
We plan to disseminate the raw z-stacks and their segmentations via a web application that serves the purpose of data sub-setting, as well as 3D browsing. We reached our goal of obtaining at least 100 cells per scaffold after visual verification. This will enable completion of the study of the effects of the 10 scaffolds on the 3D shape of stem cells at unprecedented statistical confidence.
Supplementary Material
Acknowledgments
This work has been supported by NIST. We would like to acknowledge the team members of the computational science in biological metrology project at NIST for providing invaluable inputs to our work. We would also like to acknowledge the NIST SHIP and SURF program students, Andrew Wang and Jacob Siegel, who worked on the 3D web-based visualization during the summer of 2014, and Dr. James Filliben from NIST for providing excellent review comments on the manuscript. SF was supported by a post-doctoral fellowship from the National Research Council. The cells (hBMSCs) employed in this work were purchased from the Tulane Center for Gene Therapy (NCRR-NIH P40RR017447).
Footnotes
6 AUTHORS’ CONTRIBUTIONS
SF prepared the stem cells and acquired all images used in this study. PB designed the segmentation methodology with inputs from DJ, MS, SF, and CS. MS and DJ implemented segmentation and evaluation algorithms. MS processed all 3D z-stacks to computed segmentations and their evaluation metric. SF, MS, CS and PB performed manual segmentations to establish precision values. SF provided visual inspection and reference contours for segmentation accuracy evaluations. PB wrote the paper with additional contributions from MS, DJ, SF, CS and MB. MB provided overall strategic direction for the Information System Group.
8 DISCLAIMER
Commercial products are identified in this document in order to specify the experimental procedure adequately. Such identification is not intended to imply recommendation or endorsement by the National Institute of Standards and Technology, nor is it intended to imply that the products identified are necessarily the best available for the purpose.
References
- Cardoso Jaime S, Corte-Real Luís. Toward a Generic Evaluation of Image Segmentation. IEEE Transactions on Image Processing. 2005 Nov;14(11):1773–82. doi: 10.1109/tip.2005.854491. [DOI] [PubMed] [Google Scholar]
- Cha Sung-Hyuk. Comprehensive Survey on Distance/similarity Measures between Probability Density Functions. International Journal of Mathematical Models and Methods in Applied Sciences. 2007;1(4):300–308. [Google Scholar]
- Chen Jianxu, Oleg Kim V, Litvinov Rustem I, Weisel John W, Alber Mark S, Chen Danny Z. An Automated Approach for Fibrin Network Segmentation and Structure Identification in 3D Confocal Microscopy Images. 2014 IEEE 27th International Symposium on Computer-Based Medical Systems. 2014 May;:173–178. doi: 10.1109/CBMS.2014.62. [DOI] [Google Scholar]
- Cohen Andrew R, Bjornsson Christopher S, Temple Sally, Banker Gary, Roysam Badrinath, Senior Member Automatic Summarization of Changes in Biological Image Sequences Using Algorithmic Information Theory. IEEE on Pattern Analysis and Machine Intelligence. 2009;31(8):1386–1403. doi: 10.1109/TPAMI.2008.162. [DOI] [PubMed] [Google Scholar]
- Dice LR. Measures of the Amount of Ecologic Association between Species. Ecology. 1945;26(3):297–302. [Google Scholar]
- Elliott John T, Woodward JT, Umarji A, Mei Y, Tona A. The Effect of Surface Chemistry on the Formation of Thin Films of Native Fibrillar Collagen. Biomaterials. 2007;28(4):576–85. doi: 10.1016/j.biomaterials.2006.09.023. [DOI] [PubMed] [Google Scholar]
- Farooque Tanya M, Camp Charles H, Tison Christopher K, Kumar Girish, Parekh Sapun H, Simon Carl G. Measuring Stem Cell Dimensionality in Tissue Scaffolds. Biomaterials. 2014 Mar;35(9):2558–67. doi: 10.1016/j.biomaterials.2013.12.092. [DOI] [PubMed] [Google Scholar]
- Fenster Aaron, Chiu Bernard. Evaluation of Segmentation Algorithms for Medical Imaging. Annual International Conference of the IEEE Engineering in Medicine and Biology Society IEEE Engineering in Medicine and Biology Society. 2005;7:7186–9. doi: 10.1109/IEMBS.2005.1616166. [DOI] [PubMed] [Google Scholar]
- Herberich Gerlind, Windoffer Reinhard, Leube Rudolf, Aach Til. Annual International Conference of the IEEE Engineering in Medicine and Biology Society. Boston, MA: IEEE EMBS; 2011. 3D Segmentation of Keratin Intermediate Filaments in Confocal Laser Scanning Microscopy; pp. 7751–4. [DOI] [PubMed] [Google Scholar]
- Indhumathi C, Cai YY, Guan YQ, Opas M. An Automatic Segmentation Algorithm for 3D Cell Cluster Splitting Using Volumetric Confocal Images. Journal of Microscopy. 2011 Jul;243(1):60–76. doi: 10.1111/j.1365-2818.2010.03482.x. [DOI] [PubMed] [Google Scholar]
- Kittler J, Illingworth J. Minimum Error Thresholding. Pattern Recognition. 1986;19:41–47. [Google Scholar]
- Lin Gang, Adiga Umesh, Olson Kathy, Guzowski John F, Barnes Carol a, Roysam Badrinath. A Hybrid 3D Watershed Algorithm Incorporating Gradient Cues and Object Models for Automatic Segmentation of Nuclei in Confocal Image Stacks. Cytometry. Part A: The Journal of the International Society for Analytical Cytology. 2003 Nov;56(1):23–36. doi: 10.1002/cyto.a.10079. [DOI] [PubMed] [Google Scholar]
- Lou Xinghua, Kang Minjung, Xenopoulos Panagiotis, Muñoz-Descalzo Silvia, Hadjantonakis Anna-Katerina. A Rapid and Efficient 2D/3D Nuclear Segmentation Method for Analysis of Early Mouse Embryo and Stem Cell Image Data. Stem Cell Reports. 2014 Mar 11;2(3):382–97. doi: 10.1016/j.stemcr.2014.01.010. [DOI] [PMC free article] [PubMed] [Google Scholar]
- McCullough DP, Gudla PR, Harris BS, Collins Ja, Meaburn KJ, Nakaya Ma, Yamaguchi TP, Misteli T, Lockett SJ. Segmentation of Whole Cells and Cell Nuclei from 3-D Optical Microscope Images Using Dynamic Programming. IEEE Transactions on Medical Imaging. 2008 May;27(5):723–34. doi: 10.1109/TMI.2007.913135. [DOI] [PMC free article] [PubMed] [Google Scholar]
- Pal NR, Pal SK. A Review On Image Segmentation Techniques. Pattern Recognition. 1993;26(9):1277–1294. [Google Scholar]
- Pikaz A, Averbuch A. Digital Image Thresholding Based on Topological Stable State. Pattern Recognition. 1996;29:829–843. [Google Scholar]
- Schindelin Johannes, Arganda-Carreras Ignacio, Frise Erwin, Kaynig Verena, Longair Mark, Pietzsch Tobias, Preibisch Stephan, et al. Fiji: An Open-Source Platform for Biological-Image Analysis. Nature Methods. 2012;9(7):676–682. doi: 10.1038/nmeth.2019. [DOI] [PMC free article] [PubMed] [Google Scholar]
- Sezgin Mehmet, Sankur Bulent. Survey over Image Thresholding Techniques and Quantitative Performance Evaluation. Journal of Electronic Imaging. 2004;13(1):146–165. doi: 10.1117/1.1631316. [DOI] [Google Scholar]
- Shah Shishir K. Performance Modeling and Algorithm Characterization for Robust Image Segmentation. International Journal of Computer Vision. 2008 Mar 20;80(1):92–103. doi: 10.1007/s11263-008-0130-z. [DOI] [Google Scholar]
- Udupa Jayaram K, LeBlanc Vicki R, Zhuge Ying, Imielinska Celina, Schmidt Hilary, Currie Leanne M, Hirsch Bruce E, Woodburn James. A Framework for Evaluating Image Segmentation Algorithms. Computerized Medical Imaging and Graphics. 2006 Mar;30(2):75–87. doi: 10.1016/j.compmedimag.2005.12.001. [DOI] [PubMed] [Google Scholar]
- Wirjadi Oliver. Report: Survey of 3D Image Segmentation Methods. Vol. 123. Kaiserslautern: 2007. [Google Scholar]
- Zhang Y. A Survey on Evaluation Methods for Image Segmentation. Pattern Recognition. 1996;29(8):1335–1346. [Google Scholar]
- Zhang Yu Jing. Proceedings of the Sixth International Symposium on Signal Processing and Its Applications. Kuala Lumpur, Malaysia: 2001. A Review of Recent Evaluation Techniques For Image Segmentation; pp. 148–151. [DOI] [Google Scholar]
- Zou Kelly H, Warfield Simon K, Bharatha Aditya, Tempany Clare MC, Kaus Michael R, Haker Steven J, Wells William M, Iii, Jolesz Ferenc A. Statistical Validation of Image Segmentation Quality Based on a Spatial Overlap Index. Acad Radiol. 2004;11(2):178–189. doi: 10.1016/S1076-6332(03)00671-8. [DOI] [PMC free article] [PubMed] [Google Scholar]
Associated Data
This section collects any data citations, data availability statements, or supplementary materials included in this article.


