

Abstract
Among potential contributors for the increased incidence of metabolic diseases is the developmental exposure to endocrine-disrupting chemicals such as bisphenol A (BPA). BPA is an estrogenic chemical used in a variety of consumer products. Evidence points to interactions of BPA with the prevailing environment. The aim of this study was to assess the effects of prenatal exposure to BPA on postnatal metabolic outcomes, including insulin resistance, adipose tissue distribution, adipocyte morphometry, and expression of inflammatory markers in adipose tissue as well as to assess whether postnatal overfeeding would exacerbate these effects. Findings indicate that prenatal BPA exposure leads to insulin resistance in adulthood in the first breeder cohort (study 1), but not in the second cohort (study 2), which is suggestive of potential differences in genetic susceptibility. BPA exposure induced adipocyte hypertrophy in the visceral fat depot without an accompanying increase in visceral fat mass or increased CD68, a marker of macrophage infiltration, in the subcutaneous fat depot. Cohens effect size analysis found the ratio of visceral to subcutanous fat depot in the prenatal BPA-treated overfed group to be higher compared with the control-overfed group. Altogether, these results suggest that exposure to BPA during fetal life at levels found in humans can program metabolic outcomes that lead to insulin resistance, a forerunner of type 2 diabetes, with postnatal obesity failing to manifest any interaction with prenatal BPA relative to insulin resistance and adipocyte hypertrophy.
Keywords: bisphenol A, insulin resistance, adipocytes, inflammation, development origins and toxicology
in recent decades, the incidence of type 2 diabetes has increased at a staggering rate of 1.7 million new diagnoses per year (27). In parallel, the percentage of the population identified as overweight and obese continues to rise, with more than one-third of US adults being obese (29). The incidence of type 2 diabetes is higher in overweight and obese individuals, indicating that excess adiposity influences the onset and progression of type 2 diabetes. Increased attention has been focusing on the developmental origin of these metabolic diseases and how insults during fetal and postnatal development change their developmental trajectory and culminate in altered physiology and pathology (8).
Among potential contributors for the increased incidence of metabolic diseases is the exposure to endocrine-disrupting chemicals (EDCs) such as natural and man-made compounds during critical periods of organ development and differentiation. Human epidemiological studies and experimental animal studies indicate that EDCs have the ability to interfere with physiological functions. One such EDC is bisphenol A (BPA), a carbon-based compound with two hydroxyphenyl groups that is used in manufacturing plastic and epoxy resins. The ubiquitous nature of BPA is evident by its detection in dust, running water, drinking water, human urine, blood, tissues, and a wide variety of consumer products (48). Considerable evidence exists indicating that BPA has estrogenic, anti-androgenic, and thyrotrophic activities, interferes with insulin signaling, and disrupts biological processes (48).
BPA's presence in human maternal samples, cord blood, amniotic fluid, and fetal blood samples (12, 48) highlights the risk of exposure during fetal development. Animal studies have demonstrated that exposure to BPA during this vulnerable yet critical window of development can lead to reproductive and metabolic defects in offspring (1, 34). The majority of studies testing BPA's detrimental effects have been carried out in rodent models, and they indicate that prenatal exposure to BPA disrupts offspring growth trajectory (40), induces insulin resistance (1), and increases adiposity (2, 25). Recently, there have been concerns regarding the widespread use of altricial rodent models for risk assessments of EDCs in humans (14). To translate findings that are precocial, results from rodents need to be validated in large-animal models that have a much more similar fetal developmental trajectory as humans. Sheep have been used extensively for understanding developmental origins of metabolic diseases (32, 55); in particular, studies using native steroids have identified days 30–90 of gestation as the critical window of susceptibility for development of adult metabolic perturbations like insulin resistance, altered adipocyte morphology, and hypertension (32). Exposure to excess testosterone (T), an estrogen precursor, during this window leads to a neuroendocrine, ovarian, and metabolic phenotype that parallels characteristics of women with polycystic ovary syndrome (32). Knowledge of the critical windows of reproductive and metabolic susceptibility in sheep provides an opportunity for testing the impact of exposure to BPA during development in this precocial animal model. Our studies indicate that prenatal BPA exposure induces oxidative stress (53), a forerunner of adult metabolic disease risk (7, 28) and reproductive defects (42), in the offspring.
In addition to altered prenatal developmental trajectories impacting the adult phenotype, there is evidence accumulating that such courses of development can be exacerbated by the postnatal environment, supporting a “two-hit hypothesis” (37) where a second insult occurs postnatally and can exacerbate a preexisting condition caused by the first insult earlier in life. For instance, reproductive defects in prenatal T-treated female sheep are exaggerated by postnatal overfeeding (31, 45). Similarly, postnatal exposure to estradiol increased the incidence of subluteal cycles in prenatal T-treated sheep (51). The two-hit hypothesis, as it relates to the impact of developmental exposure to EDCs on metabolic outcomes, has not been tested in a precocial large-animal model. Using sheep for this study, we tested the following hypotheses: 1) prenatal exposure to BPA during midgestation at a level relevant to human exposure leads to metabolic disruptions, namely insulin resistance, increased adiposity, altered adipocyte morphology, and adipose tissue inflammation; and 2) postnatal overfeeding would exacerbate the metabolic outcomes programmed by BPA.
MATERIALS AND METHODS
Animals and Prenatal Treatments
This study was conducted at the University of Michigan Sheep Research Facility (Ann Arbor, MI). All procedures were approved by the Institutional Animal Care and Use Committee of the University of Michigan and are consistent with the National Institutes of Health's Guide for the Care and Use of Laboratory Animals. Adult Suffolk breed sheep (2–5 yr old) were bred to generate control and prenatal BPA-treated animals. Breeder sheep used in the two studies described below were acquired from several local farmers. Details of husbandry and nutrition (22) and BPA treatment strategy (52) have been described previously. All animals were group housed and kept outdoors at the research facility (42°, 18'N) with access to shelter. Potential exposure to phytoestrogens from the diet or other environmental sources was not controlled for, but all groups, including the control group, were maintained under the same housing conditions throughout the experiment. Only females were studied. Males were removed prior to females reaching reproductive maturity to keep the females from getting pregnant.
Study 1: Effects of Prenatal BPA on Insulin Sensitivity
A dose response study was first conducted to study the impact of prenatal BPA exposure on insulin sensitivity. Gestational BPA treatment consisted of daily subcutaneous (SC) injections of one of three BPA doses, 0.05, 0.5, or 5 mg·kg−1·day−1 (Blow, Bmed, and Bhigh, respectively; purity ≥99%, cat. no. 239658; Aldrich Chemical, Milwaukee, WI), in corn oil from days 30 through 90 of gestation (term: ∼147 days). Control (C) mothers received vehicle. Only one female offspring from each dam was utilized if twin pregnancies were involved. Lambs were weaned at ∼8 wk of age. All females provided with a maintenance diet were fed 0.64 kg of corn, 0.64 kg hay·lamb−1·day−1, and 0.014 kg of supplement (36% crude protein) to achieve growth without excess fat deposition. Wooden feeders with crossover metallic bars were used. At ∼6 wk (prepubertal; C: 7; Blow: 8; Bmed: 8; Bhigh: 7) and ∼13 mo of age [postpubertal during the anestrous season (May): C: 7; Blow: 11; Bmed: 12; Bhigh: 6], intravenous glucose tolerance tests were performed to test offspring insulin resistance.
In parallel, an additional group of control and 0.5 mg/kg BPA-treated pregnant mothers (n = 6/group) were euthanized at gestational day 68 ± 2 of gestation, and umbilical arterial (fetal) and uterine (maternal) blood were procured for determining internal levels of free BPA achieved. BPA was measured using high-performance liquid chromatography coupled with API 5500 electrospray triple-quadrupole mass spectrometer, as described previously (49). Levels of unconjugated BPA achieved on day 68 of gestation in the maternal uterine artery averaged 0.41 ± 0.04 and 12.2 ± 3.4 ng/kg (n = 6/group), respectively, following administration of vehicle and 0.5 mg·kg−1·day−1 of BPA and are within the range seen in maternal circulation of US women (5). Corresponding levels achieved in female fetuses at gestational day ∼68 averaged 0.17 ± 0.04 and 1.55 ± 0.42 ng/ml, respectively, for the control and BPA-treated groups. Fetal levels achieved are comparable with that achieved on gestational day 90 (49).
Study 2: Interaction Between Prenatal BPA and Postnatal Overfeeding on Metabolic Variables
As described above, gestational BPA treatment consisted of daily SC injections of BPA at a dose of 0.5 mg·kg−1·day−1, the middle dose used in the dose response study, which is within the range reported in humans (5, 12, 30). C mothers received the vehicle. At 14 wk of age, half of the C and BPA groups were assigned to one of two dietary groups, maintenance (C and BPA) and overfed diets (C + OF and BPA + OF), respectively. The number of female lambs were C: 10; BPA: 9; C + OF: 11; and BPA + OF: 12. The maintenance and overfed feeding regimens have been described previously (45). In brief, all females assigned to the maintenance diet were fed the same diet as described for study 1. The overfed group was fed 0.77 kg of corn, 0.014 kg of supplement, and 0.73 kg hay·lamb−1·day−1 initially and then hay ad libitum. The overfed group achieved a body weight 30% above the mean body weight of the maintenance group, as described previously (45). A glucose tolerance test was performed at ∼15 mo of age during the anestrous season (July). At ∼19 mo of age, adipose tissue distribution was assessed by computed tomography. At ∼21 mo of age, to normalize steroid background, animals were estrus synchronized using two 20-mg prostaglandin F2α (PGF2α) injections (5 mg/ml im, Lutalyse; Pfizer Animal Health) administered 11 days apart. Twenty-seven hours after the second PGF2α injection, females were euthanized during the late follicular phase by administration of a barbiturate overdose (Fatal Plus; Vortech Pharmaceuticals, Dearborn, MI), and visceral adipose tissue was procured for adipocyte morphometry. Both visceral and SC adipose tissue were obtained for mRNA expression.
Glucose Tolerance Test
Because sheep are a ruminant species, longer fasting periods are required to achieve a reliable basal fasting glucose state. As such, they were fasted for 24 (prepubertal age) or 48 h (postpubertal age). After four fasting baseline samples were procured, glucose (300 mg/kg body wt) was given by jugular injections, and frequent blood samples were obtained until 120 min, as described previously (31). Basal insulin, glucose, and insulin/glucose ratio were calculated by averaging the values obtained prior to glucose administration. Insulin response was evaluated as described previously (31), and the following parameters were measured: acute insulin response after 2 and 5 min of glucose administration, cumulative insulin, cumulative glucose, cumulative insulin/glucose ratio, insulin area under the curve after 20 and 180 min from the glucose bolus administration, and insulin sensitivity index. Plasma glucose levels were measured by the glucose oxidase method (Pointe Scientific, Canton, MI). The inter- and intra-assay coefficients of variation (CVs) for glucose measured at 50 and 200 mg/dl were both <5.0% (n = 33 assays). Plasma insulin levels were measured using a radioimmunoassay kit (MP Biomedicals, Orangeburg, NY). The sensitivity of the insulin assay was 0.25 ± 0.04 μU/l (n = 14 assays; means ± SE). Mean intra-assay CVs based on three quality control pools measuring 48.4 ± 1.3, 120.4 ± 2.5, and 432.6 ± 7.2 ng/ml were 9.7, 7.2, and 6.5%, respectively. The interassay CVs for the same quality control pools averaged 8.8, 7.8, and 5.5%, respectively.
Adipose Tissue Distribution
At ∼19 mo of age, adipose tissue distribution was assessed in a subset of females from study 2 (C: 6; BPA: 6; C + OF: 6; BPA + OF: 6) by computed tomography (CT) using a multislice CT scanner (16-slice Brightspeed; General Electric) at the Diagnostic Imaging Service at the Veterinary Teaching Hospital of Michigan State University, as described previously (50). Animals were first sedated using xylazine (0.2 mg/kg), and whole body CT scans were performed from the caudal skull to the ischium. Animals were placed on a CT calibration phantom to account for beam variability (Mindways). Slice thickness was 1.25 mm, and scan parameters were kept constant among all animals (120 kVp and 300–330 mA). Adipose tissue was assessed from the 10th thoracic vertebrae to the first lumbar vertebrae, highlighted, and computed if the tissue had an attenuation range from −50 to −150 Hounsfield units. Visceral and SC adipose tissue volume were quantified using imaging software (Analyze 6.0; AnalyzeDirect, Overland Park, KS).
Adipocyte Morphometry
Adipose tissue from subset of females (C: 5; BPA: 5; C + OF: 8; BPA + OF: 6) was minced and suspended in 1× PBS supplemented with 4% bovine serum albumin and 5 mg/ml of collagenase A (Roche Diagnostics, Indianapolis, IN), as described previously (50). The samples were incubated in a dry shaker for 1 h at 40°C. After filtration, adipocyte suspension was then transferred to a siliconized glass slide, and adipocyte images were captured under bright-field illumination. All images were captured using the same magnification and camera settings. Uniform microspheres (diameter, 98.0 μm; Bangs Laboratories, Fishers, IN) were used as a reference. The mean cell diameter and area were determined by computerized image analysis (Image Pro Analyzer version 7.01; Media Cybernetics, Bethesda, MD).
Adipocyte Inflammatory Markers
SC and visceral adipose tissue from all females in study 2 (C: 11; BPA: 7; C + OF: 10; BPA + OF: 10) were flash-frozen in a methylbutane dry ice bath and stored at −80°C until further processing. RNA extraction was performed using the RNeasy kit (Qiagen). Quality and concentration of the RNA were assessed, measuring absorbance at 260 and 280 nm. After RNA was isolated from 100 mg of adipose tissue (visceral or subcutaneous), RT reactions were performed using Applied Biosystems high-capacity cDNA reverse transcription kit. The relative expression of adiponectin and CD68 mRNA transcripts was measured using real-time PCR analysis (SYBR Green, ABI Prism 7200 Sequence Detection System; Applied Biosystems) and normalized against the housekeeping gene GAPDH. PCR primers used are listed in Table 1. The melt curves of the primers were examined to confirm that only one gene was amplified, as demonstrated by a single peak. Efficiency was confirmed by the similar slopes of the amplification curves for the gene of interest and the endogenous control. Relative expression was assessed by the comparative CT method correcting for amplification efficiency of the primers and performed in duplicate.
Table 1.
List of primers
| Gene Name | Primer |
|---|---|
| GAPDH | |
| Forward | GGT GGC GCC AAG AGG GTC ATC ATC |
| Reverse | AGG TTT CTC CAG GCG GCA GGT CAG |
| Adiponectin | |
| Forward | ATC AAA CTC TGG AAC CTC CTA TCT AC |
| Reverse | GCT GGG AAC CAT TAC TCC AA |
| CD68 | |
| Forward | GTC CTG CTA CCA CCA CCA GT |
| Reverse | GCT GGG AAC CAT TAC TCC AA |
Forward and reverse primers used for amplification with real-time PCR.
Statistical Analysis
The impact of prenatal BPA treatment and postnatal obesity on variables from glucose tolerance test, adipose tissue distribution, and mRNA expression was analyzed using ANOVA followed by Tukey post hoc test. Regression analyses were conducted to test the dose response effect on insulin sensitivity and the correlation between fat depot volumes and mRNA expression. Appropriate transformations were applied for all variables to account for heterogeneity of variances. When trends were evident, effects were also examined by effect size analysis (26), which allows comparison of the means between two treatments with respect to the magnitude of difference between them. The computed statistic, Cohen's d value, 0.2, 0.5, and 0.8, can be considered as small, medium, and large effect sizes, respectively.
To assess the impact of prenatal BPA treatment on adipocyte size, an empirical cumulative distribution function was calculated for each measurement, and the difference between groups tested used a two-sample Kolmogorov-Smirnov test. Linear mixed-effect model was used to test whether prenatal BPA or overfeeding had an effect on adipocyte characteristics. In all analyses, the effect of number of offspring and sex of the offspring was accounted for. Significance was defined as P < 0.05. All results are presented as means ± SE. All analyses were carried out using SAS for Windows (release 9.1.3; SAS Institute, Cary, NC) and PASW Statistics for Windows release 18.0.1.
RESULTS
Study 1: Effects of Prenatal BPA on Insulin Sensitivity
Prepubertal.
Responses of C, Blow, Bmed, and Bhigh groups of animals at 6 wk of age to the intravenous glucose tolerance test are shown in Fig. 1. ANOVA showed efects of BPA on fasting glucose approaching significance (P = 0.059), with fasting glucose being significantly higher in the Blow group compared with the C group (P < 0.05). Effect size comparing control and BPA-treated groups revealed a large effect (d Cohen was 1.3, 1.1, 1.0 for the Blow, Bmed, and Bhigh groups, respectively). Although the insulin response to the glucose challenge was numerically higher in all BPA groups compared with the C group for most of the outcomes studied (see Fig. 1), ANOVA revealed no statistical significance. Effect size analyses found medium to large size differences relative to reduction in insulin sensitivity index for the three prenatal BPA treatment groups. Regression analysis showed no significant dose response effect.
Fig. 1.
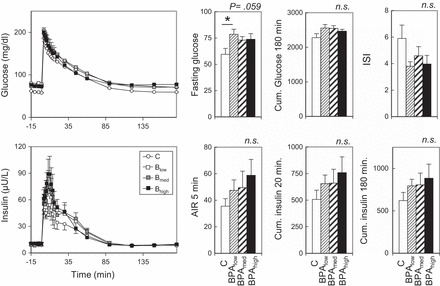
Study 1. Left: circulating levels of glucose (top) and insulin (bottom) before and after administration of 300 mg/kg glucose bolus in control (C) and bisphenol A (BPA)-treated females at ∼6 wk of age (Blow, Bmed, and Bhigh; refer to materials and methods for prenatal BPA dose details). Right: Top histograms show mean fasting glucose, cumulative (Cum.) insulin over 180 min, and insulin sensitivity index (ISI); bottom histograms show acute insulin response (AIR) after 5 min and Cum. insulin/glucose ratio at 20 and 180 min. P values at top right corner of each histogram refer to overall ANOVA results. *Significant difference (P < 0.05) between C and Blow group. All post hoc comparisons are against the C group. NS, not significant.
Postpubertal.
The response to the intravenous glucose tolerance test in the Blow, Bmed, and Bhigh groups at 13 mo of age is shown in Fig. 2. The insulin response to the glucose challenge was different among all groups, and this was indicated by an increased mean cumulative insulin response at 20 (P < 0.05) and 180 min (P = 0.054) and an increased mean cumulative insulin/glucose ratio response at 20 (P < 0.05) and 180 min (P < 0.05). Post hoc analyses revealed that the Bmed group was significantly different from the C group for cumulative insulin and cumulative insulin/glucose ratio response at 20 and 180 min (P < 0.05). The Blow and Bhigh groups were not significantly different, although they followed a trend similar to that of the Bmed group. Acute insulin response at 5 min also tended to be higher in all BPA groups (P = 0.080, respectively) relative to the C group. Post hoc analyses revealed that only the acute insulin response at 5 min was significantly different in the Bmed group compared with the C group (P < 0.05). Cohen's effect size analyses found medium to large reductions in insulin sensitivity index for all three prenatal BPA treatments. Regression analysis showed no significant dose response effect.
Fig. 2.
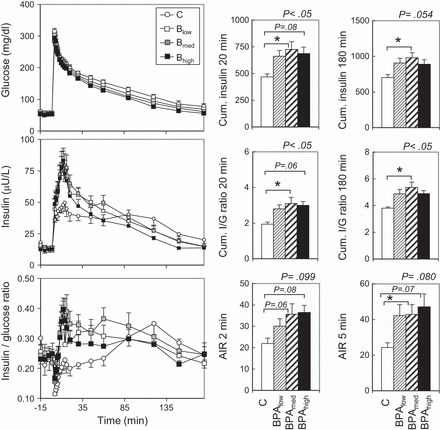
Study 1. Graphs (left): patterns of circulating levels of glucose (top), insulin (middle), and insulin/glucose ratio (bottom) before and after administration of 300 mg/kg glucose bolus in C and prenatal BPA-treated females at ∼13 mo of age (Blow, Bmed, and Bhigh; refer to materials and methods for prenatal BPA dose details). Histograms (right): mean Cum. insulin at 20 and 180 min (top), mean Cum. insulin/glucose ratio at 20 and 180 min (middle), and AIR at 2 and 5 min (bottom). P values at top right corner of each histogram refer to overall ANOVA results. *Significant differences (P < 0.05) between specific groups. All post hoc comparisons were assessed against the C group.
Study 2: Interaction Between Prenatal BPA and Postnatal Overfeeding on Metabolic Variables
Insulin sensitivity.
Responses of the C, BPA, C + OF, and BPA + OF groups of animals at 15 mo of age to the intravenous glucose tolerance test are shown in Fig. 3. Independent of prenatal BPA exposure, fasting insulin was higher in overfed groups compared with maintenance-fed groups (P < 0.05). No significant differences in insulin response (acute response, area under the curve, or cumulative response over 180 min and insulin sensitivity index) or glucose clearance were observed among treatment groups at this age.
Fig. 3.
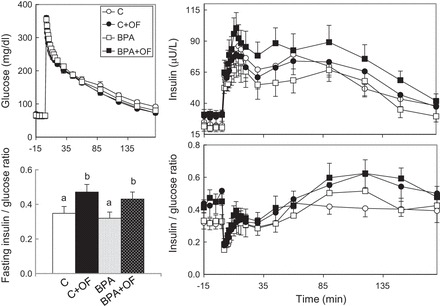
Study 2. Circulating levels of glucose (top left), insulin (top right), and insulin/glucose ratio (bottom right) before and after administration of a 300 mg/kg glucose bolus via an indwelling catheter in C, control overfed (C + OF), BPA-treated (BPA), and BPA-treated overfed (BPA + OF) females at ∼15 mo of age. Bottom left: histogram of mean fasting insulin. a,bSignificantly different (P < 0.05); no other glucose tolerance outcome measures were significantly different. ○, C group; □, Blow group; gray squares, Bmed group; ■, Bhigh group.
Visceral adiposity.
Body weights and adipose tissue distribution of the C, BPA, C + OF, and BPA + OF groups by CT scan are shown in Fig. 4. As expected, total body weight at the time of the scan was higher in the overfed groups compared with the maintenance groups (Fig. 4B). Overfeeding increased (P < 0.05) total, subcutaneous, and visceral fat in the C + OF and BPA + OF groups compared with their maintenance-fed counterparts without any BPA-specific effect. The ratio of visceral to subcutaneous fat was higher in the BPA + OF group compared with the C + OF group [BPA + OF: 1.42 ± 0.07 vs. C + OF: 1.14 ± 0.04, with Cohen's d-test revealing a strong effect size between the BPA + OF and C + OF groups (Cohen's d-test: 1.97)].
Fig. 4.
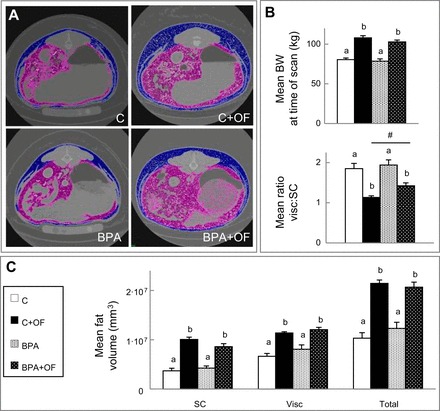
Study 2. A: representative computed tomography (CT) scans from C, C + OF, BPA, and BPA + OF animals. Visceral and subcutaneous (SC) adipose tissue depots are represented in purple and blue, respectively. B: histograms of body weight (BW) and visceral (visc)/SC adipose tissue ratio at the time of the CT scan (means ± SE). C: SC, visc, and total adipose tissue volume (means ± SE) from the 4 groups. a,bSignificant differences between groups (P < 0.05); #large-effect size difference between the BPA + OF and C + OF groups.
Adipose tissue morphometry.
Cell size distribution in prenatal BPA-treated females was right shifted toward a larger area (P < 0.01) and diameter (P < 0.01) in the visceral adipose tissue (Fig. 5). Overfeeding also increased mean adipocyte area (P < 0.01) and diameter (P < 0.01), consistent with obesity-driven adipocyte hypertrophy, but overfeeding did not exaggerate the effects of prenatal BPA treatment on adipocyte size.
Fig. 5.

Study 2. A: representative images of visceral adipocytes from C, C + OF, BPA, and BPA + OF animals identified by computerized image analyses (red lines). B: cumulative size distributions of area (left) and diameter (right) of adipocytes from all 4 groups (see color legend for group identification). P values refer to the overall effect of prenatal exposure to BPA or postnatal overfeeding (OF) on adipocyte area and diameter.
Adipose tissue inflammation.
The results of mRNA expression in both the visceral and SC adipose depots are shown in Fig. 6. In the SC adipose tissue depot, prenatal BPA increased CD68 expression relative to the C group (P = 0.02). The impact of postnatal overfeeding on adiponectin was restricted to the BPA group (BPA vs. BPA + OF, P = 0.02). In the visceral adipose tissue depot of both overfed groups (C + OF and BPA + OF), adiponectin mRNA expression was reduced (P < 0.05) and CD68 increased (P < 0.05) relative to matching maintenance-fed groups. There was no prenatal BPA-specific effect. Regression analyses revealed a significant inverse relationship between adiponectin expression and SC (r2 = −0.474, P = 0.01) and visceral fat volumes (r2 = −0.498, P < 0.005) (Fig. 6).
Fig. 6.
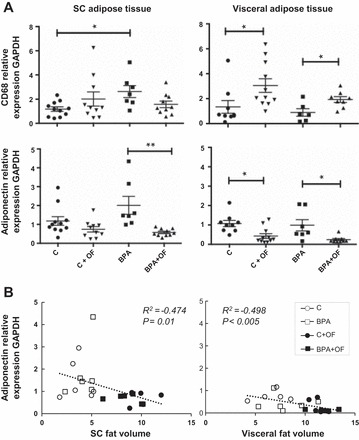
Study 2. A: mRNA expression of adiponectin and CD68 in SC (left) and visc (right) adipose tissue of C, C + OF, BPA, and BPA + OF females. Lines underneath symbols represent significant differences (*P < 0.05; **P < 0.01) between 2 groups. B: scatterplots of SC (left) and visc (right) adipose tissue volumes and mRNA adiponectin expression in each adipose depot. ▲, BPA + OF; ▼, C + OF.
DISCUSSION
Using sheep, a precocial large-animal model, and targeting pregnancy as the critical window of exposure, the present study demonstrates a risk of metabolic derangements during postnatal life following prenatal exposure to relevant human exposure levels of BPA. Metabolic disturbances induced by prenatal BPA exposure included insulin resistance, increased adipocyte size, and elevated inflammatory markers in adipose tissue. Furthermore, postnatal overfeeding, which manifests effects similar to that of prenatal BPA on metabolic outcomes (hyperinsulinemia, increased adipose tissue deposition and inflammation, and increased adipocyte size), did not modify the effects of prenatal BPA except for a reduction in adiponectin mRNA in subcutaneous and visceral adipose tissue depots of the overfed BPA-treated group relative to the maintenance-fed BPA-treated group.
Effects of Prenatal BPA and Postnatal Overfeeding on Insulin Sensitivity
In the current study, prenatal BPA-treated females were hyperglycemic only at low BPA doses (indicated by elevated fasting glucose levels) prior to puberty. Considering that chronic hyperglycemia and associated poor insulin release are often reflections of advanced type 2 diabetes (16), relating fasting hyperglycemia in the absence of a diminished insulin release to a defective insulin response in prepubertal sheep proves to be difficult. However, although not statistically significant, the general trend of an increased insulin response (acute and cumulative) coupled with a reduced insulin sensitivity index suggests a compromised insulin sensitivity.
The finding of prenatal BPA-induced insulin resistance manifesting postpubertally in sheep (this study) is consistent with the delayed onset of insulin resistance in mice (1). In male mice, prenatal BPA-induced insulin resistance is evident at 6 mo but not at 3 mo of age. Long-term studies are limited in large-animal models. Age-dependent changes in insulin homeostasis have also been reported in other animal models. In a magnitude comparable with peripubertal controls, insulin sensitivity in prenatal T-treated sheep is reduced during prepubertal life and resurfaces in adulthood (50). In humans, insulin sensitivity is highest and lowest in Tanner stages 1 and 2, respectively, while reestablishing prepubertal sensitivity upon reaching Tanner stage 5 (6, 13, 18). The importance of this transient reduction in pubertal insulin sensitivity is unclear, although other metabolic, endocrine, and body fat distribution changes occur at this time. Importantly, in our study, the significant effect of prenatal BPA was observed in the Bmed dose (but not the Bhigh dose) and comparable with the exposure level observed in humans (5, 30). The effect of prenatal BPA on insulin resistance was also dose dependent in mice with the lower (BPA maternal exposure: 10 μg·kg−1·day−1) but not the higher (100 μg·kg−1·day−1) dose, showing an effect in males (1), whereas in the present study, the effects were seen in female sheep (males not studied). A nonmonotonic dose-response relationship is a common feature of BPA toxicity (48).
Exposure to 0.5 mg·kg−1·day−1 BPA did not lead to insulin resistance in study 2 (second cohort; Fig. 3) when examined at 15 mo of age (2 mo later than the BPA dose response study discussed above; Fig. 2). The breed, animal setting, breeders' body condition, and exposure dose were the same across cohorts of animals. Whether this is a compensatory mechanism to overcome developing insulin resistance is unclear. There is precedence for this; previous studies with prenatal T-treated sheep found insulin sensitivity to fluctuate throughout development with significant reduction in insulin sensitivity evident early in life relative to controls, which disappears as they approach puberty when controls are also becoming insulin resistant (31). Alternatively, since breeder animals were purchased from different farmers, this finding might highlight the importance in the heterogeneity of the genetic background within the same breed of sheep. This is a common finding in rodent literature, where different mouse strains have a greater susceptibility than others to endocrine disruptors' impact on metabolic responses (44) or genetic manipulations (4).
Where postnatal overfeeding led to insulin resistance in our previous study, contrastingly, it did not significantly impair insulin sensitivity despite achieving a similar percentage weight gain from overfeeding in the present study (31). Overfeeding induced basal hyperinsulinemia, a typical result of insulin resistance (21). Potentially because of its small sample size, the insulin response to the glucose challenge was numerically, not significantly, higher. Genetic background along with maternal body condition at the time of conception or during pregnancy may have contributed to the differing responses between animal cohorts.
Effects of Prenatal BPA and Postnatal Overfeeding on Metabolic Variables
Epidemiological studies have reported positive associations in higher maternal urinary BPA concentrations with increased adiposity (11, 15) and body mass index (47) in children; however, the effects of prenatal BPA treatment on body weight and subcutaneous, visceral, and total adipose tissue mass were not evident in this study. Although some studies in rodents report that BPA exposure leads to increased body weight (25, 40) and adipose tissue mass (25, 41, 43), their findings are inconsistent (25, 41, 43, 46) and may be sex specific (41). Because most studies in rodents focus on the parametrial rather than the subcutaneous fat depot (25, 43) or fail to report fat depot partitioning (41), it is difficult to relate observations from rodent studies to the present findings.
The finding that postnatal overfeeding increases the visceral/subcutaneous fat mass ratio upon prenatal BPA exposure is novel and previously unreported. Given an increase in the visceral, not subcutaneous, adipose depot and its association with negative metabolic outcomes (20, 38), the higher visceral/subcutaneous ratio may have contributed to the poor metabolic outcomes in prenatal BPA-treated sheep. A high-fat diet was found to reduce fat mass without body mass reduction in prenatal (41), not postnatal (9), BPA-treated rats. These differences across studies may relate to dose and window of BPA exposure, species, strain, sex, and/or nature of dietary intervention. The increase in visceral adipocyte size in overfed BPA females relative to overfed controls appears to be modulated by diet and highlights the obesogenic potential of BPA. Independent of fat distribution and degree of obesity, hypertrophic adipocytes are more lipolytic, and it has been hypothesized that metabolic disturbances may arise from the inability of the adipose tissue to expand through hyperplasia (23). Visceral adipocyte hypertrophy in BPA-treated females without an accompanying increase in visceral adiposity was an unexpected finding, as hypertrophy (17), not hyperplasia (3, 10), of adipose cells is considered to be the main determinant of adipose depot increase. A potential reduction in adipocyte number in visceral adipose depot of BPA-treated females might have contributed to this dissociation, a possibility that could not be tested with dissociated adipocytes such as those used in the present study.
Compared with subcutaneous adipose tissue, the finding that visceral adipose tissue secretes lower amounts of beneficial adipokines such as adiponectin is consistent with earlier findings (54). Overfeeding reduced tissue mRNA adiponectin expression, a surrogate measure for circulating adiponectin (19), which appears to be driven by increased fat deposition in both fat depots. Increased CD68 expression in visceral fat of overfed females may reflect increased macrophage infiltration. In women, increased visceral fat is a predictor of macrophage infiltration (24). The inverse relationship observed between adiponectin and CD68 in the visceral fat depot is also a common finding in high-fat diets and overfeeding regimens (36). CD68 was also increased in subcutaneous fat of BPA-treated females. Although enhanced immunomodulatory effects (33) and innate immune responses (39) have been reported following BPA exposure, to our knowledge this is the first reported increase in CD68 expression, suggesting increased macrophage infiltration in adipose tissue following prenatal BPA exposure. To what extent these changes contribute in the development of insulin resistance observed in these females remains to be determined. The finding that macrophage infiltration was restricted to subcutaneous adipose tissue may reflect a fat depot-specific susceptibility to BPA or, as seen with other organic pollutants, differences in BPA storage capacity between fat depots (35).
In conclusion, our findings using a precocial, large-animal model indicate that gestational exposure to BPA at levels detected in humans can program metabolic disruptions that are independent of postnatal obesity, leading to insulin resistance, a forerunner of type 2 diabetes.
GRANTS
This work was supported by National Institute of Environmental Health Sciences Grant R01-ES-016541 to V. Padmanabhan. Effort spent by A. Veiga-Lopez during the preparation of the manuscript was supported by AgBioResearch and the United States Department of Agriculture National Institute of Food and Agriculture (Hatch project MICL02383).
DISCLOSURES
The authors have nothing to disclose.
AUTHOR CONTRIBUTIONS
A.V.-L. and V.P. conception and design of research; A.V.-L., J.M., R.S., K.S., C.N.L., and A.P. performed experiments; A.V.-L. and W.Y. analyzed data; A.V.-L. and V.P. interpreted results of experiments; A.V.-L. and J.M. prepared figures; A.V.-L. and V.P. drafted manuscript; A.V.-L., J.M., K.S., W.Y., and V.P. edited and revised manuscript; A.V.-L., J.M., R.S., K.S., C.N.L., W.Y., A.P., and V.P. approved final version of manuscript.
ACKNOWLEDGMENTS
We thank Douglas Doop and Gary McCalla of the Department of Pediatrics at the University of Michigan for their valuable assistance in breeding, lambing, and careful animal care. We are also grateful to Dr. Bachir Abi Salloum, Evan M. Beckett, Carol Herkimer, Alexandria Williams, and Aishwarya Navalpakam of the Department of Pediatrics at the University of Michigan for providing help with prenatal treatment and participating in glucose tolerance tests and hormonal assays and Robert Malinowski of the Department of Small Animal Clinical Sciences at Michigan State University for assisting with the CT scan Analyze software.
REFERENCES
- 1.Alonso-Magdalena P, Vieira E, Soriano S, Menes L, Burks D, Quesada I, Nadal A. Bisphenol A exposure during pregnancy disrupts glucose homeostasis in mothers and adult male offspring. Environ Health Perspect 118: 1243–1250, 2010. [DOI] [PMC free article] [PubMed] [Google Scholar]
- 2.Angle BM, Do RP, Ponzi D, Stahlhut RW, Drury BE, Nagel SC, Welshons WV, Besch-Williford CL, Palanza P, Parmigiani S, vom Saal FS, Taylor JA. Metabolic disruption in male mice due to fetal exposure to low but not high doses of bisphenol A (BPA): evidence for effects on body weight, food intake, adipocytes, leptin, adiponectin, insulin and glucose regulation. Reprod Toxicol 42: 256–268, 2013. [DOI] [PMC free article] [PubMed] [Google Scholar]
- 3.Arner P, Bernard S, Salehpour M, Possnert G, Liebl J, Steier P, Buchholz BA, Eriksson M, Arner E, Hauner H, Skurk T, Rydén M, Frayn KN, Spalding KL. Dynamics of human adipose lipid turnover in health and metabolic disease. Nature 478: 110–113, 2011. [DOI] [PMC free article] [PubMed] [Google Scholar]
- 4.Bunner AE, Chandrasekera PC, Barnard ND. Knockout mouse models of insulin signaling: Relevance past and future. World J Diabetes 5: 146–159, 2014. [DOI] [PMC free article] [PubMed] [Google Scholar]
- 5.Calafat AM, Ye X, Wong LY, Reidy JA, Needham LL. Exposure of the U.S. population to bisphenol A and 4-tertiary-octylphenol: 2003-2004. Environ Health Perspect 116: 39–44, 2008. [DOI] [PMC free article] [PubMed] [Google Scholar]
- 6.Caprio S, Plewe G, Diamond MP, Simonson DC, Boulware SD, Sherwin RS, Tamborlane WV. Increased insulin secretion in puberty: a compensatory response to reductions in insulin sensitivity. J Pediatr 114: 963–967, 1989. [DOI] [PubMed] [Google Scholar]
- 7.Dennery PA. Oxidative stress in development: nature or nurture? Free Radic Biol Med 49: 1147–1151, 2010. [DOI] [PubMed] [Google Scholar]
- 8.Desai M, Jellyman JK, Ross MG. Epigenomics, gestational programming and risk of metabolic syndrome. Int J Obes (Lond) 39: 633–641, 2015. [DOI] [PubMed] [Google Scholar]
- 9.Ding S, Fan Y, Zhao N, Yang H, Ye X, He D, Jin X, Liu J, Tian C, Li H, Xu S, Ying C. High-fat diet aggravates glucose homeostasis disorder caused by chronic exposure to bisphenol A. J Endocrinol 221: 167–179, 2014. [DOI] [PubMed] [Google Scholar]
- 10.Drolet R, Richard C, Sniderman AD, Mailloux J, Fortier M, Huot C, Rhéaume C, Tchernof A. Hypertrophy and hyperplasia of abdominal adipose tissues in women. Int J Obes (Lond) 32: 283–291, 2008. [DOI] [PubMed] [Google Scholar]
- 11.Eng DS, Lee JM, Gebremariam A, Meeker JD, Peterson K, Padmanabhan V. Bisphenol A and chronic disease risk factors in US children. Pediatrics 132: e637–e645, 2013. [DOI] [PMC free article] [PubMed] [Google Scholar]
- 12.Gerona RR, Woodruff TJ, Dickenson CA, Pan J, Schwartz JM, Sen S, Friesen MW, Fujimoto VY, Hunt PA. Bisphenol-A (BPA), BPA glucuronide, and BPA sulfate in midgestation umbilical cord serum in a northern and central California population. Environ Sci Technol 47: 12477–12485, 2013. [DOI] [PMC free article] [PubMed] [Google Scholar]
- 13.Goran MI, Gower BA. Longitudinal study on pubertal insulin resistance. Diabetes 50: 2444–2450, 2001. [DOI] [PubMed] [Google Scholar]
- 14.Habert R, Muczynski V, Grisin T, Moison D, Messiaen S, Frydman R, Benachi A, Delbes G, Lambrot R, Lehraiki A, N'tumba-Byn T, Guerquin MJ, Levacher C, Rouiller-Fabre V, Livera G. Concerns about the widespread use of rodent models for human risk assessments of endocrine disruptors. Reproduction 147: R119–R129, 2014. [DOI] [PMC free article] [PubMed] [Google Scholar]
- 15.Harley KG, Aguilar Schall R, Chevrier J, Tyler K, Aguirre H, Bradman A, Holland NT, Lustig RH, Calafat AM, Eskenazi B. Prenatal and postnatal bisphenol A exposure and body mass index in childhood in the CHAMACOS cohort. Environ Health Perspect 121: 514–520, 2013. [DOI] [PMC free article] [PubMed] [Google Scholar]
- 16.Inzucchi SE, Bergenstal RM, Buse JB, Diamant M, Ferrannini E, Nauck M, Peters AL, Tsapas A, Wender R, Matthews DR. Management of hyperglycemia in type 2 diabetes: a patient-centered approach: position statement of the American Diabetes Association (ADA) and the European Association for the Study of Diabetes (EASD). Diabetes Care 35: 1364–1379, 2012. [DOI] [PMC free article] [PubMed] [Google Scholar]
- 17.Jo J, Gavrilova O, Pack S, Jou W, Mullen S, Sumner AE, Cushman SW, Periwal V. Hypertrophy and/or hyperplasia: dynamics of adipose tissue growth. PLoS Comput Biol 5: e1000324, 2009. [DOI] [PMC free article] [PubMed] [Google Scholar]
- 18.Kelly LA, Lane CJ, Weigensberg MJ, Toledo-Corral CM, Goran MI. Pubertal changes of insulin sensitivity, acute insulin response, and β-cell function in overweight Latino youth. J Pediatr 158: 442–446, 2011. [DOI] [PMC free article] [PubMed] [Google Scholar]
- 19.Kern PA, Di Gregorio GB, Lu T, Rassouli N, Ranganathan G. Adiponectin expression from human adipose tissue: relation to obesity, insulin resistance, and tumor necrosis factor-alpha expression. Diabetes 52: 1779–1785, 2003. [DOI] [PubMed] [Google Scholar]
- 20.Lysaght J, van der Stok EP, Allott EH, Casey R, Donohoe CL, Howard JM, McGarrigle SA, Ravi N, Reynolds JV, Pidgeon GP. Pro-inflammatory and tumour proliferative properties of excess visceral adipose tissue. Cancer Lett 312: 62–72, 2011. [DOI] [PubMed] [Google Scholar]
- 21.Madonna R, De Caterina R. Atherogenesis and diabetes: focus on insulin resistance and hyperinsulinemia. Rev Esp Cardiol (Engl Ed) 65: 309–313, 2012. [DOI] [PubMed] [Google Scholar]
- 22.Manikkam M, Crespi EJ, Doop DD, Herkimer C, Lee JS, Yu S, Brown MB, Foster DL, Padmanabhan V. Fetal programming: prenatal testosterone excess leads to fetal growth retardation and postnatal catch-up growth in sheep. Endocrinology 145: 790–798, 2004. [DOI] [PubMed] [Google Scholar]
- 23.Michaud A, Boulet MM, Veilleux A, Noel S, Paris G, Tchernof A. Abdominal subcutaneous and omental adipocyte morphology and its relation to gene expression, lipolysis and adipocytokine levels in women. Metabolism 63: 372–381, 2014. [DOI] [PubMed] [Google Scholar]
- 24.Michaud A, Drolet R, Noel S, Paris G, Tchernof A. Visceral fat accumulation is an indicator of adipose tissue macrophage infiltration in women. Metabolism 61: 689–698, 2012. [DOI] [PubMed] [Google Scholar]
- 25.Miyawaki J, Sakayama K, Kato H, Yamamoto H, Masuno H. Perinatal and postnatal exposure to bisphenol a increases adipose tissue mass and serum cholesterol level in mice. J Atheroscler Thromb 14: 245–252, 2007. [DOI] [PubMed] [Google Scholar]
- 26.Nakagawa S, Cuthill IC. Effect size, confidence interval and statistical significance: a practical guide for biologists. Biol Rev 82: 591–605, 2007. [DOI] [PubMed] [Google Scholar]
- 27.National Center for Chronic Disease Prevention and Health Promotion. Statistics About Diabetes. National Diabetes Statistics Report 2014 Atlanta, GA: Centers for Disease Control and Prevention, 2014, p. 1–12. [Google Scholar]
- 28.Nuyt AM. Mechanisms underlying developmental programming of elevated blood pressure and vascular dysfunction: evidence from human studies and experimental animal models. Clin Sci (Lond) 114: 1–17, 2008. [DOI] [PubMed] [Google Scholar]
- 29.Ogden CL, Carroll MD, Kit BK, Flegal KM. Prevalence of Childhood and Adult Obesity in the United States, 2011–2012. JAMA 311: 806–814, 2014. [DOI] [PMC free article] [PubMed] [Google Scholar]
- 30.Padmanabhan V, Siefert K, Ransom S, Johnson T, Pinkerton J, Anderson L, Tao L, Kannan K. Maternal bisphenol-A levels at delivery: a looming problem? J Perinatol 28: 258–263, 2008. [DOI] [PMC free article] [PubMed] [Google Scholar]
- 31.Padmanabhan V, Veiga-Lopez A, Abbott DH, Recabarren SE, Herkimer C. Developmental programming: impact of prenatal testosterone excess and postnatal weight gain on insulin sensitivity index and transfer of traits to offspring of overweight females. Endocrinology 151: 595–605, 2010. [DOI] [PMC free article] [PubMed] [Google Scholar]
- 32.Padmanabhan V, Veiga-Lopez A. Animal models of the polycystic ovary syndrome phenotype. Steroids 78: 734–740, 2013. [DOI] [PMC free article] [PubMed] [Google Scholar]
- 33.Patel BB, Kasneci A, Bolt AM, Di Lalla V, Di Iorio MR, Raad M, Mann KK, Chalifour LE. Chronic exposure to bisphenol A reduces successful cardiac remodeling after an experimental myocardial infarction in male c57bl/6n mice. Toxicol Sci 146: 101–115, 2015. [DOI] [PubMed] [Google Scholar]
- 34.Peretz J, Vrooman L, Ricke WA, Hunt PA, Ehrlich S, Hauser R, Padmanabhan V, Taylor HS, Swan SH, VandeVoort CA, Flaws JA. Bisphenol a and reproductive health: update of experimental and human evidence, 2007–2013. Environ Health Perspect 122: 775–786, 2014. [DOI] [PMC free article] [PubMed] [Google Scholar]
- 35.Pestana D, Faria G, Sa C, Fernandes VC, Teixeira D, Norberto S, Faria A, Meireles M, Marques C, Correia-Sa L, Cunha A, Guimaraes JT, Taveira-Gomes A, Santos AC, Domingues VF, Delerue-Matos C, Monteiro R, Calhau C. Persistent organic pollutant levels in human visceral and subcutaneous adipose tissue in obese individuals—depot differences and dysmetabolism implications. Environ Res 133: 170–177, 2014. [DOI] [PubMed] [Google Scholar]
- 36.Pietilainen KH, Kannisto K, Korsheninnikova E, Rissanen A, Kaprio J, Ehrenborg E, Hamsten A, Yki-Jarvinen H. Acquired obesity increases CD68 and tumor necrosis factor-alpha and decreases adiponectin gene expression in adipose tissue: a study in monozygotic twins. J Clin Endocrinol Metab 91: 2776–2781, 2006. [DOI] [PubMed] [Google Scholar]
- 37.Prins GS, Birch L, Tang WY, Ho SM. Developmental estrogen exposures predispose to prostate carcinogenesis with aging. Reprod Toxicol 23: 374–382, 2007. [DOI] [PMC free article] [PubMed] [Google Scholar]
- 38.Ross R, Aru J, Freeman J, Hudson R, Janssen I. Abdominal adiposity and insulin resistance in obese men. Am J Physiol Endocrinol Metab 282: E657–E663, 2002. [DOI] [PubMed] [Google Scholar]
- 39.Roy A, Bauer SM, Lawrence BP. Developmental exposure to bisphenol A modulates innate but not adaptive immune responses to influenza A virus infection. PLoS One 7: e38448, 2012. [DOI] [PMC free article] [PubMed] [Google Scholar]
- 40.Rubin BS. Bisphenol A: an endocrine disruptor with widespread exposure and multiple effects. J Steroid Biochem Mol Biol 127: 27–34, 2011. [DOI] [PubMed] [Google Scholar]
- 41.Ryan KK, Haller AM, Sorrell JE, Woods SC, Jandacek RJ, Seeley RJ. Perinatal exposure to bisphenol-a and the development of metabolic syndrome in CD-1 mice. Endocrinology 151: 2603–2612, 2010. [DOI] [PMC free article] [PubMed] [Google Scholar]
- 42.Savabieasfahani M, Kannan K, Astapova O, Evans NP, Padmanabhan V. Developmental programming: differential effects of prenatal exposure to bisphenol-A or methoxychlor on reproductive function. Endocrinology 147: 5956–5966, 2006. [DOI] [PubMed] [Google Scholar]
- 43.Somm E, Schwitzgebel VM, Toulotte A, Cederroth CR, Combescure C, Nef S, Aubert ML, Huppi PS. Perinatal exposure to bisphenol a alters early adipogenesis in the rat. Environ Health Perspect 117: 1549–1555, 2009. [DOI] [PMC free article] [PubMed] [Google Scholar]
- 44.Spearow J. Reviewer's appendix to the white paper on species/stock/strain in endocrine disruptor assays. In: Endocrine Disruptor Screening Program. Washington, DC: US Environmental Protection Agency, 2004, p. A1–A97. [Google Scholar]
- 45.Steckler TL, Herkimer C, Dumesic DA, Padmanabhan V. Developmental programming: excess weight gain amplifies the effects of prenatal testosterone excess on reproductive cyclicity—implication for polycystic ovary syndrome. Endocrinology 150: 1456–1465, 2009. [DOI] [PMC free article] [PubMed] [Google Scholar]
- 46.Tyl RW, Myers CB, Marr MC, Thomas BF, Keimowitz AR, Brine DR, Veselica MM, Fail PA, Chang TY, Seely JC, Joiner RL, Butala JH, Dimond SS, Cagen SZ, Shiotsuka RN, Stropp GD, Waechter JM. Three-generation reproductive toxicity study of dietary bisphenol A in CD Sprague-Dawley rats. Toxicol Sci 68: 121–146, 2002. [DOI] [PubMed] [Google Scholar]
- 47.Valvi D, Casas M, Mendez MA, Ballesteros-Gomez A, Luque N, Rubio S, Sunyer J, Vrijheid M. Prenatal bisphenol A urine concentrations and early rapid growth and overweight risk in the offspring. Epidemiology 24: 791–799, 2013. [DOI] [PubMed] [Google Scholar]
- 48.Vandenberg LN, Hunt PA, Myers JP, Vom Saal FS. Human exposures to bisphenol A: mismatches between data and assumptions. Rev Environ Health 28: 37–58, 2013. [DOI] [PubMed] [Google Scholar]
- 49.Veiga-Lopez A, Luense LJ, Christenson LK, Padmanabhan V. Developmental programming: gestational bisphenol-A treatment alters trajectory of fetal ovarian gene expression. Endocrinology 154: 1873–1884, 2013. [DOI] [PMC free article] [PubMed] [Google Scholar]
- 50.Veiga-Lopez A, Moeller J, Patel D, Ye W, Pease A, Kinns J, Padmanabhan V. Developmental programming: impact of prenatal testosterone excess on insulin sensitivity, adiposity, and free fatty acid profile in postpubertal female sheep. Endocrinology 154: 1731–1742, 2013. [DOI] [PMC free article] [PubMed] [Google Scholar]
- 51.Veiga-Lopez A, Wurst AK, Steckler TL, Ye W, Padmanabhan V. Developmental programming: postnatal estradiol amplifies ovarian follicular defects induced by fetal exposure to excess testosterone and dihydrotestosterone in sheep. Reprod Sci 21: 444–455, 2014. [DOI] [PMC free article] [PubMed] [Google Scholar]
- 52.Veiga-Lopez A, Beckett EM, Abi Salloum B, Ye W, Padmanabhan V. Developmental programming: prenatal BPA treatment disrupts timing of LH surge and ovarian follicular wave dynamics in adult sheep. Toxicol Appl Pharmacol 279: 119–128, 2014. [DOI] [PMC free article] [PubMed] [Google Scholar]
- 53.Veiga-Lopez A, Pennathur S, Kannan K, Patisaul HB, Dolinoy DC, Zeng L, Padmanabhan V. Impact of gestational bisphenol A on oxidative stress and free fatty acids: human association and interspecies animal testing studies. Endocrinology 156: 911–922, 2015. [DOI] [PMC free article] [PubMed] [Google Scholar]
- 54.Wajchenberg BL. Subcutaneous and visceral adipose tissue: their relation to the metabolic syndrome. Endocr Rev 21: 697–738, 2000. [DOI] [PubMed] [Google Scholar]
- 55.Zambrano E, Guzman C, Rodriguez-Gonzalez GL, Durand-Carbajal M, Nathanielsz PW. Fetal programming of sexual development and reproductive function. Mol Cell Endocrinol 382: 538–549, 2014. [DOI] [PubMed] [Google Scholar]