

Abstract
The goal of this study was to investigate the effects of nitric oxide (NO)-mediated vasodilation in preventing medullary hypoxia, as well as the likely pathways by which superoxide (O2−) conversely enhances medullary hypoxia. To do so, we expanded a previously developed mathematical model of solute transport in the renal medulla that accounts for the reciprocal interactions among oxygen (O2), NO, and O2− to include the vasoactive effects of NO on medullary descending vasa recta. The model represents the radial organization of the vessels and tubules, centered around vascular bundles in the outer medulla and collecting ducts in the inner medulla. Model simulations suggest that NO helps to prevent medullary hypoxia both by inducing vasodilation of the descending vasa recta (thus increasing O2 supply) and by reducing the active sodium transport rate (thus reducing O2 consumption). That is, the vasodilative properties of NO significantly contribute to maintaining sufficient medullary oxygenation. The model further predicts that a reduction in tubular transport efficiency (i.e., the ratio of active sodium transport per O2 consumption) is the main factor by which increased O2− levels lead to hypoxia, whereas hyperfiltration is not a likely pathway to medullary hypoxia due to oxidative stress. Finally, our results suggest that further increasing the radial separation between vessels and tubules would reduce the diffusion of NO towards descending vasa recta in the inner medulla, thereby diminishing its vasoactive effects therein and reducing O2 delivery to the papillary tip.
Keywords: mathematical model, hypoxia, oxygen, sodium transport
despite receiving ∼25% of the cardiac output, the mammalian kidney (particularly the medulla) is susceptible to hypoxia. Blood flow in the renal cortex is high, and its filtration by glomerular capillaries creates a need for tubular transport processes so as to maintain homeostasis. Partly because of the need to concentrate urine, medullary blood flow is substantially lower than cortical blood flow. The resulting low oxygen (O2) delivery to the outer medulla (OM) yields an oxygen tension (Po2) of 20 mmHg, compared with 50 mmHg in the cortex (7, 38). Medullary hypoxia is believed to be an important pathway in the development of chronic kidney diseases and, in general, is due to a mismatch between changes in renal O2 supply and consumption (16).
Nitric oxide (NO) and superoxide (O2−) exert opposite effects on O2 supply and consumption in the renal medulla, such that medullary oxygenation is partly governed by the balance between the two solutes. NO induces vasodilation of descending vasa recta (DVR) (43), thereby enhancing blood flow into, and thus O2 supply to, the medulla; on the other hand, O2− favors reductions in medullary blood flow (12). O2 consumption in the renal medulla mostly stems from the active transport of sodium across tubular epithelia; whereas Na+ reabsorption in the medullary thick ascending limb (mTAL) is stimulated by O2− (40), it is inhibited by NO (41).
We previously examined the impact of NO and O2− on salt transport and O2 consumption (17) but without accounting for their effects on blood flow and O2 supply. The main objective of the present study was to investigate the degree to which modulation of DVR muscle tone by NO helps to protect the kidney from medullary hypoxia, via increases in blood flow into the medulla and thus O2 delivery.
NO induces vasodilation of medullary DVR by acting on the pericytes that surround the vascular endothelium. These vascular smooth muscle cells impart contractile properties to the vessels, such that increases in NO reduce intracellular Ca2+ via the cGMP/PKG pathway and cause vasodilation (14). Kakoki et al. (25) found that when NOS inhibitors were administered near the OM-inner medullary (IM) boundary at doses lowering NO levels by 32 and 66%, respectively, medullary blood flow was reduced by 32 and 40% as a result. Mattson et al. (33) observed that infusion of NOS stimulators into the renal medullary interstitium selectively increased medullary blood flow, without affecting superficial cortical blood flow.
Anatomical studies of rat kidneys have shown that the radial organization of tubules and vessels in the medulla is highly structured (32, 45, 46, 47, 48). In particular, in the inner stripe, O2-supplying DVR are isolated within tightly packed vascular bundles, distant from the mTALs and collecting ducts (CDs); in the upper IM, CDs form clusters separate from DVR. Recent modeling studies have demonstrated that this architecture plays a role in medullary oxygen distribution and hypoxia (9, 10, 18, 19). Another goal of the present study was to examine anew the impact of the structural organization of nephrons and vessels in the renal medulla on the distribution of O2, accounting for modulation of Po2 by NO and superoxide. To accomplish this, we expanded a detailed mathematical model of solute transport in the rat renal medulla to include effects of NO on DVR diameter and flow.
MODEL DESCRIPTION
We extended a detailed model of solute transport and oxygenation in the renal medulla of the rat kidney (17) to include the effects of NO-induced vasodilation. The model accounts for the three-dimensional architecture of the renal medulla of a rat kidney (27, 29, 47). Particularly relevant to oxygen transport is the sequestration of the vasa recta within the vascular bundles in the inner stripe of the outer medulla and the separation of the thick ascending limbs from the oxygen-rich vascular bundles (3, 27), both of which are captured in the model (see Fig. 1, reproduced from Ref. 17).
Fig. 1.
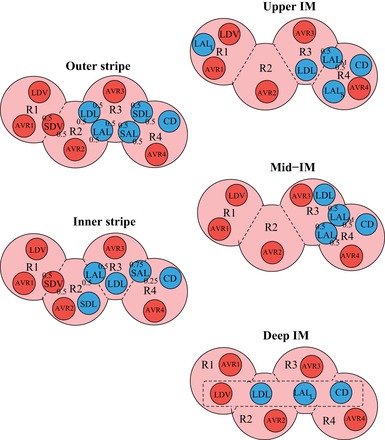
Schematic diagram of a cross section through the outer stripe, inner stripe, upper inner medullary (IM), mid-IM, and deep IM, showing interstitial regions (R1, R2, R3, R4) and relative positions of tubules and vessels. Decimal numbers indicate relative interaction weightings with regions [e.g., in the outer stripe, half of the short descending vasa recta (SDV) lie in R1, and half lie in R2]. SDL/SAL, descending/ascending limbs of short loops of Henle; LDL/LAL, descending/ascending limbs of long loops of Henle; subscript “S,” “M,” and “L” associated with a LAL denotes limbs that turn with the 1st millimeter of the IM (S), within the mid-IM (M), or reach into the deep IM (L); CD, collecting duct; SDV, short descending vasa recta (DVR); LDV, long DVR; AVRs, populations of ascending vasa recta. Dotted-line box in deep IM indicates that LDV, LDL, LAL, and CD are weighted evenly between the 4 regions. Tubules, vessels, and interstitium are denoted in blue, red, and pink, respectively. [Reproduced from Ref. (17).]
The model represents DVR that supply blood to every depth of the renal medulla and loops of Henle that turn at every depth. At all depths along the cortico-medullary axis, a fraction of the DVR is assumed to peel off and supply the capillary plexus. The number ratio between DVR that supply the OM vs. the IM (denoted SDV and LDV below) is assumed to be 44:12 (30). To represent the relatively more abundant capillary flow in the inner stripe, the population distribution of SDV is given by
| (1) |
where LOS and LOM denote the length of the outer stripe and OM, respectively. The population of the DVR that reach into the IM is given by
| (2) |
where LIM denotes the length of the IM.
The model solution describes flows and solute concentrations as a function of medullary depth in the interstitium, the loops of Henle, CDs, vasa recta, and capillaries. Blood flow in vasa recta is divided into two compartments, plasma and red blood cells (RBCs), which interact with each other; since plasma flow and RBC flow are computed separately, the hematocrit in vasa recta, given by the ratio of RBC flow to total blood flow, varies with medullary depth. The solutes explicitly considered in the model are NaCl, urea, deoxy- and oxyhemoglobin (Hb and HbO2), O2, NO, HbNO, and O2−. Detailed transport equations can be found in our previous study (17) and the references therein. We focus here on the new feature of our model, namely, NO-induced vasodilation of DVR. We also briefly summarize the equations describing the kinetics of formation of NO and O2− and active Na+ transport and O2 consumption in the medulla.
NO-induced vasodilation.
Wrapping around the DVR endothelium are sporadically occurring pericytes, which are vascular smooth muscle cells and thus can induce vasoconstriction or dilation. NO is believed to induce vasodilation by reducing cytosolic Ca2+ concentration ([Ca2+]) and the fraction of bound cross-bridges, via the cGMP/PKG pathway (14). Here we adopt a phenomenological approach and assume that the DVR radius (RDVR, in μm) increases with local increases in NO concentration (C̄NODVR). The model represents DVR of differing length, and at medullary depth x, the radius of a DVR (which we assume cannot fall below that of a single erythrocyte, ∼3.5 μm) is given by
| (3) |
where x ranges between 0 and the length of the medulla (7 mm); denotes the average of the DVR plasma and local interstitial [NO] at x; denotes the reference NO concentration, taken to be 25 nM, which is the average medullary interstitial concentration predicted in our previous model (17); R* denotes the reference radius, taken to be 7.5 μm; and A is a dimensionless parameter, chosen to be 1.0962 such that baseline DVR volume flow at the cortico-medullary boundary is ∼8 nl/min (4). With our choice of parameters, decreases in NO levels by 32 and 66% lead to corresponding decreases in RDVR of 10 and 12% and decreases in blood flow into the medulla by 32 and 40%, matching the experimental data of Kakoki et al. (25).
We assume that medullary blood flow can be described by Poiseuille's law (1, 21, 34), so that blood flow along each DVR is determined, in part, by the pressure drop (ΔPDVR) and vascular resistance; the latter scales inversely with the fourth power of the DVR radius:
| (4) |
where FVDVR is blood flow in an individual DVR, μ is the blood viscosity, and LDVR denotes vessel length. As previously noted, the DVR terminate at every medullary depth; thus LDVR varies from 0 to 7 mm, the length of the medulla. Because the DVR have differing lengths and radii that vary in space, blood flow distribution may be inhomogeneous among the DVR. To determine entering blood flow for the DVR, we connect each DVR to a downstream resistance in series (which varies among DVR of differing lengths), and we assume that pressures at the two ends (efferent arteriole and renal vein, denoted PE and PV, respectively) are known a priori. We then assume that the efferent arteriole-to-renal vein pressure drop (PE − PV) is equal to the pressure drop along that DVR and along its downstream resistance (Γdown):
| (5) |
FVDVR(LDVR) denotes volume flow at the end of the DVR, and Γdown is a function of DVR length. A schematic of the downstream resistance and the distributed formulation of the DVR is shown in Fig. 2. The pressure drop ΔPDVR is computed along the length of the DVR:
| (6) |
where μ is taken to be 2 cP. The downstream resistance, Γdown, is chosen so that under baseline conditions, DVR inlet blood flow is 8 nl/min. Γdown is then assumed fixed under all other conditions.
Fig. 2.
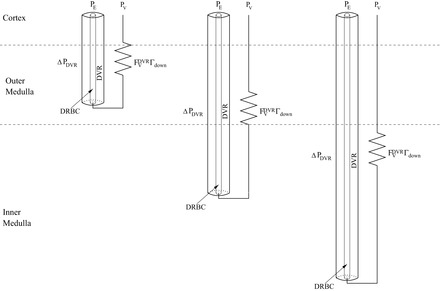
Schematic diagram illustrating the distributed formulation of the DVR and the downstream resistance, from Eq. 5. A fraction of the DVR turn at every depth of the corticomedullary axis, and red blood cells within the DVR (DRBC) are represented by rigid tubes and interact with surrounding plasma. Each DVR is assumed connected upstream to an efferent arteriole (with pressure PE) and to a downstream resistance that connects to the renal vein (with pressure PV).
Generation of NO and O2−.
NO is produced primarily by endothelial cells, although epithelial cells also contribute to its synthesis. Once generated, NO diffuses into the surrounding interstitium or the lumen, where it is partly consumed by several scavengers, including O2−, HbO2, and Hb. The production rate of NO, denoted Gi,NO, is assumed to depend on local Po2, such that for tubule or vessel i
| (7) |
where Gi,NOmax is the maximal rate of NO production (fixed in a particular tubule or vessel i, see Table 2 in Ref. 17); Ci,O2 is the luminal O2 concentration in tubule or vessel i, and KO2NO is the Michaelis constant (set to 50.9 μM in all structures; Ref. 54).
Similarly, the dependence of O2− generation rate on Po2 is given by
| (8) |
where is the maximal rate of O2− production (fixed in a particular tubule or vessel i, see Table 2 in Ref. 17) and is the Michaelis constant (set to 20.6 μM in all structures; Ref. 11). Once generated, O2− then exits the cell via diffusion or reacts with scavengers (NO or superoxide dismutase).
Although oxygen is a precursor to NO synthesis, experiments have demonstrated that medullary NO levels increase in the presence of hypoxia (22, 35, 42, 49). We account for hypoxia-induced stimulation of NO release in a simplified manner: by assuming that as the availability of O2 decreases, the permeability of the RBCs to NO (PNORBC) also decreases, thereby preserving more NO in the medullary tissue. Specifically, we assume that PNORBCvaries linearly with Po2
| (9) |
where PNORBC,basal is the basal RBC permeability to NO, taken here to be 0.1 cm/s (15). The parameters in Eq. 9 were chosen in a previous study (15) to yield an increase in medullary NO levels consistent with experimental observations in anesthetized rats administered indomethacin (22a) when Po2 levels decreased from Pb = 28 mmHg to Pa = 12 mmHg.
Active Na+ transport and O2 consumption.
Active transport of Na+ occurs along some tubular segments, including the thick ascending limbs, proximal straight tubules, and CDs. The rate of active Na+ transport is assumed to depend on local Po2, [NO], and [O2−], and is expressed assuming Michaelis-Menten kinetics as follows:
| (10) |
where Vmax,i,Na (in nmol Na+·cm−2·s−1) is the maximal rate of Na+ transport (see Table 1 in Ref. 29); KM,Na is the Michaelis constant (taken here to be 70 mM; Refs. 20, 31); Ci,Na(x) is the luminal Na+ concentration in tubule i, and the functions fact(Ci,O2), gact(Ci,NO), and hact represent the effects of O2, NO, and O2− on the rate of active sodium reabsorption.
Under well-perfused conditions, active Na+ transport is not limited by O2 levels (37). Below some Po2 threshold (Pi,c, set to 10 mmHg in all tubular segments; Ref. 18), aerobic transport decreases and is partially compensated by anaerobic metabolism. To describe this process, we set
| (11) |
where FAN describes the capacity of the tubular segment for anaerobic transport and is taken to be 0.5 in the OMCD (52, 55), 0.4 in the IMCD (51), 0.1 in the TALs (2), and 0.14 in the proximal straight tubules (13).
NO and O2− have opposite effects on Na+ transport, with NO having an inhibitory effect and O2− enhancing Na+ transport. These effects are represented, respectively, by
| (12) |
| (13) |
where Ci,NO(x) and (x) are the local NO and O2− concentrations in tubule or vessel i and βi and γi are the Michaelis constants (set to 47 nM and 0.2 pM in the TALs and 232 nM and 0.06 pM in the CDs, respectively; Ref. 17).
To determine the oxygen consumption arising from active Na+ transport, we associate with tubule i transport a TQi value, which is the number of moles of Na+ actively reabsorbed per mole of O2 consumed under maximum efficiency. Then the volumetric rate of active O2 consumption in tubule i is given by
| (14) |
where ri is the inner radius of tubule i, Aiepi is the cross-sectional area of the surrounding epithelium of tubule i and Θ(Pi,O2) is the fraction of remove Na+ active transport supported by aerobic respiration. We assume that below a certain threshold, aerobic respiration decreases linearly, so that Θ(Pi,O2) is given by
| (15) |
In addition, a basal level of O2 consumption from processes other than Na+ active transport is assumed to take place in the vascular endothelial cells, tubular epithelial cells, and interstitial cells. This rate of basal O2 consumption in tubule or vessel i is given by
| (16) |
where KM,iO2 is the Michaelis constant and Rmax,O2basal is the maximal volumetric rate of O2 consumption (17).
The model assumes that the DVR deliver oxygen both in the form of O2 dissolved in blood and of HbO2 bound to hemoglobin in RBCs. The reaction between Hb and O2 is assumed to be at equilibrium, as the kinetics of Hb O2 dissociation are substantially faster than the diffusion of O2 (11a). Oxyhemoglobin saturation (So2) is assumed to be well fitted by the Hill equation, so that So2 is given by
| (17) |
where n is the exponent of the Hill equation (set to 2.6), and C50 is the O2 concentration at which So2 is 0.5, taken to be 41.2 μM (11a). As such, the oxy- and deoxyhemoglobin concentration changes with medullary depth, due to loading and unloading of O2.
RESULTS
Base case results.
To assess the impact of NO on vascular tone, we compared two cases throughout this study: a vasoactive case (represented with white bars on figures), in which the effects of NO on DVR diameter and flow were considered; and a fixed resistance case (represented with black bars), in which DVR diameter was fixed independently of [NO].
Without the vasoactive influence of NO, DVR radius is fixed at 7.5 μm. The model predicts a medullary O2 supply (i.e., the total amount of oxygen in the blood entering the medulla) of 27.9 pmol·min−1·nephron−1, a total (active plus basal) mTAL O2 consumption rate (Qo2) of 15.8 pmol·min−1·nephron−1, and an average superficial mTAL (SAL) luminal Po2 of 7.8 mmHg. (We report SAL Po2 because it tends to represent the lowest medullary O2 levels, as well as total mTAL Qo2 because it gives a more complete picture of medullary O2 consumption.) Of the medullary O2 supply, 58.4% is consumed in the OM, and 16.5% is delivered to the IM. When DVR vasoactivity due to NO is included, the length-averaged radius over all DVR is slightly higher, at 7.7 μm, resulting in a slightly higher medullary O2 delivery of 30.1 pmol·min−1·nephron−1. Of that delivery to the medulla, 60.1% is consumed in the OM, and 16.1% is delivered to the IM. The mTAL Qo2 also increases slightly to 16.8 pmol·min−1·nephron−1. These competing factors result in a net increase in SAL Po2, to 8.3 mmHg. In the simulations that follow, we examined several scenarios involving alterations of medullary NO and superoxide effects.
Effects of NO on medullary oxygenation.
It has been well established that NO helps to blunt hypoxia and keep Po2 levels sufficiently high (6). The NO-mediated Po2 increase may be attributed to increased O2 supply (from dilated blood vessels) or decreased O2 consumption (from inhibition of active sodium transport). To assess the relative contributions of the two pathways, we first conducted a simulation in which we removed the vasodilatory effect of NO by setting RDVR to a fixed value (5.9 μm) given by Eq. 3 when is set to 6.3 nM, which corresponds to one-fourth of the reference value of CNO*. Note that [NO] was fixed in Eq. 3 but not elsewhere. That is, [NO] was determined locally based on conservation equations. The DVR radius, predicted medullary O2 supply, mTAL Qo2, and SAL luminal Po2 are shown in Fig. 3. This case yielded an average DVR radius that is 20.8% smaller than in the base case, resulting in a 155% increase in vascular resistance. Consequently, medullary O2 supply decreased by 61% (Fig. 3B), and SAL Po2 decreased by 28% (Fig. 3D).
Fig. 3.
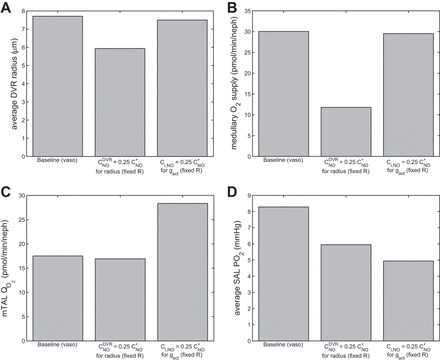
Average DVR radius (μm; A), medullary O2 supply (pmol·min−1·nephron−1; B), medullary thick ascending limb (mTAL) O2 consumption (pmol·min−1·nephron−1; C), and average SAL Po2 (mmHg; D), in the base case, with effects of = ¼CNO* on DVR radius and with effects of Ci,NO = ¼CNO* on gact.
In a second simulation, we lowered instead the (inhibitory) effect of NO on the rate of active Na+ transport by setting gact to a fixed value given by Eq. 12 when Ci,NO is set to ¼CNO*. Key model predictions are shown in Fig. 3. When thus reducing the inhibitory effects of NO on sodium reabsorption, mTAL Qo2 increased by 62%. As a result, average SAL luminal Po2 dropped substantially, from the baseline value of 8.3 mmHg to 4.9 mmHg. A comparison between these two cases (Fig. 3D) suggests that the inhibitory effect of NO on , the reduction of which resulted in a 41% decrease in SAL Po2, has a greater influence on mTAL Po2 than does the vasodilatory effect of NO on DVR radius, the reduction of which resulted in a 28% decrease in SAL Po2.
We then examined the effects of varying NO generation rate: the latter was either reduced by 75% or doubled. For each case, we conducted simulations with and without [NO]-induced vasodilation. For the latter, DVR radius was set to the reference radius value of 7.5 μm (independent of [NO]).
Corresponding results are summarized in Fig. 4. The model predicts that reducing the rate of NO synthesis lowers medullary O2 supply and raises O2 consumption by comparable amounts. The fact that low NO levels lead to significant vasoconstriction means that the vasoactive properties of the DVR exacerbate the low Po2 conditions when NO is reduced. Conversely, increasing the rate of NO synthesis raises medullary O2 supply and lowers O2 consumption to similar extents. In other words, sufficiently high NO concentrations lead to higher SAL Po2 levels when allowing for NO-induced vasodilation. Altogether these results indicate that the vasoactive effects of NO contribute significantly to medullary oxygenation.
Fig. 4.
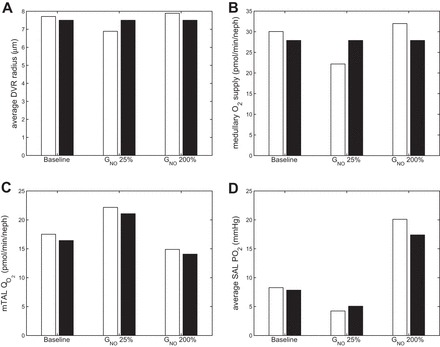
Average DVR radius (μm; A), medullary O2 supply (pmol·min−1·nephron−1; B), mTAL O2 consumption (pmol·min−1·nephron−1; C), and average SAL Po2 (mmHg; D), in the base case, with GNOmax × 25%, and with GNOmax × 200%, both with (white bars) and without (black bars) [NO]-induced vasodilation.
Oxidative stress and medullary oxygenation.
Oxidative stress in the kidney is associated with a reduction in tissue oxygenation and can be caused by an increase in superoxide levels. To simulate oxidative stress in this study, we increased the superoxide generation rate, , by a factor of 2. Higher superoxide levels stimulate active salt transport and thus raise O2 consumption. They also increase the rate at which NO is scavenged by O2−, thereby indirectly reducing O2− supply. In addition, oxidative stress correlates with a decrease in metabolic efficiency, likely due to mitochondrial uncoupling (44); that is, the rate of oxygen consumption increases without a subsequent increase in the rate of active sodium transport, manifested as a decrease in the TQ ratio. Studies in hypertensive rats (53), which operate under conditions of increased oxidative stress, have shown an approximate halving of the TQ ratio compared with their nonhypertensive counterparts. Thus we assume that a doubling of superoxide concentration (past some threshold) corresponds to a 50% reduction of the TQ ratio.
To represent these effects, we add to the model a dependence of the TQ ratio on superoxide concentration, such that above a certain threshold O2− concentration, , the TQ ratio is assumed to decrease linearly with increasing O2− concentration. Since O2 consumption cannot increase without bound, it is assumed that the TQ ratio reaches its minimum at one-half of the baseline TQ ratio, for O2− concentrations larger than twice the value of . In other words, the value of the TQ ratio takes the following form (see Fig. 5):
| (18) |
where TQi,base is set to 18 in the ascending and descending limbs and 12 in the collecting duct, based on transport simulations for tubular epithelia (39, 50). is set to a value assuming no oxidative stress in the base case but increased oxidative stress with a doubling of superoxide generation rate (i.e., = 20 pM).
Fig. 5.
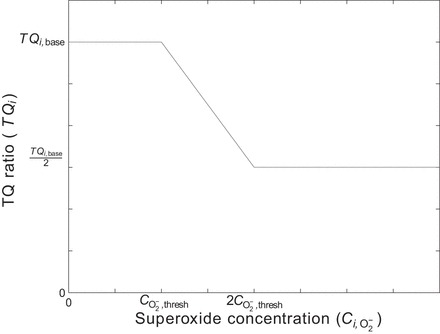
Assumed form of TQ ratio vs. superoxide concentration, where TQ is the number of moles of Na actively reabsorbed per mole of O2 consumed under maximum efficiency.
To determine the most potent ways in which oxidative stress affects medullary oxygenation, we conducted simulations in the base case and with doubled maximal superoxide generation rate, with and without the dependence of TQ on O2− concentration and with and without the inclusion of [NO]-induced vasodilation. The results of these simulations are shown in Fig. 6.
Fig. 6.
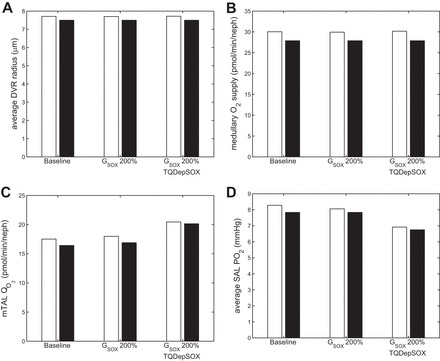
Average DVR radius (μm; A), medullary O2 supply (pmol·min−1·nephron−1; B), mTAL O2 consumption (pmol·min−1·nephron−1; C), and average SAL Po2 (mmHg; D, in the base case), with × 200%, and with × 200% and TQ dependence on [O2−], both with (white bars) and without (black bars) [NO]-induced vasodilation.
When the maximal O2− generation rate is doubled but TQ is maintained constant (2nd set of bars), the increased superoxide levels (average SAL [O2−] increases to 4.5 pM from 2.3 pM in the base case) lead to a slight increase in the rate of active Na+ transport ; however, since average SAL Po2 is less than the critical Po2 (Pi,c in Eq. 11), the increase in is blunted by the decrease in the fraction of active transport that is supported by aerobic metabolism, Θ(Pi,O2). In other words, an increase in anaerobic vs. aerobic metabolism acts to mitigate the effects of enhanced salt reabsorption on O2 consumption. The net result is just a small reduction in Po2 with increased O2− concentration.
The third set of bars accounts for TQ decreases in response to a twofold increase in O2− synthesis. Since SAL [O2−] ranges from 2 to 26 pM, TQ at certain depths of the OM is reduced by 15%; in other mTALs, the maximum [O2−] is over 40 pM, so that at some depths of the tubule, TQ is reduced by 50%. In this scenario, doubling the maximal O2− generation rate has a noticeable impact on O2 consumption and on average SAL Po2 (Fig. 6C). The model predicts that with increased oxidative stress, there is a 14% decrease in Po2 compared with base case, without [NO]-induced vasodilation. With [NO]-induced vasodilation included, there is a 16% decrease in Po2. While NO-induced vasodilation can help blunt the effects of increased oxidative stress (by maintaining a slightly higher Po2), the increased superoxide levels result in a sufficiently large reduction in metabolic efficiency to significantly lower short ascending limb Po2 in all cases.
Hyperfiltration and medullary oxygenation.
Experiments have demonstrated an increase in cell injury and hypoxia with increased filtration/flow rate (hyperfiltration), particularly prevalent in diabetes (5, 36). It has also been shown that acute hyperfiltration leads to increased superoxide production; the following equation is extrapolated from Fig. 2 in Ref. 23:
| (19) |
where is the maximal rate of superoxide production when flow rate is at its baseline value (6 nl/min); FVi is the flow rate in tubule or vessel i (in nl/min); c1 = 1.33 (min/nl); c2 = 10.3; and cscale = 18.3 (23).
To assess the impact of flow-induced increases in , we conducted simulations of hyperfiltration by increasing descending limb inflow by 60%, with and without dependence of O2− production on flow rate, with and without dependence of TQ on O2− concentration, and with and without [NO]-induced vasodilation.
In the presence of hyperfiltration, inclusion of O2− generation dependence on flow rate produced virtually identical results to the base case, when that dependency was not included (average SAL [O2−] concentration increased only slightly, from 2.27 to 2.33 pM). However, inclusion of both dependencies (O2− dependence on flow rate and TQ dependence on O2−) simultaneously produced a 2.7% decrease in average SAL Po2 with [NO]-induced vasodilatory effects included, and a 1.9% decrease with fixed DVR diameters, due to slight increases in O2 consumption. While these decreases in Po2 are small, these results suggest that the most likely pathway to hypoxia via hyperfiltration is from increased superoxide generation leading to a decrease in TQ; that is, the model does not predict a change in Po2 simply from a flow-induced increase in O2− production and its subsequent effect on the active Na+ transport.
Effects of spatial inhomogeneity.
To determine the impact of the separation of mTAL from DVR on medullary oxygenation, we varied their degree of separation. The model represents the separation between mTAL and DVR by assigning them to different interconnected “regions.” These regions are separated by boundaries that allow diffusion of solutes. The more solute-permeable these boundaries are, the less separated the mTAL and DVR are. Thus, to vary their degree of separation, we scaled the interregion solute permeabilities by factors of ρ = 0.1, 10, and 100 (with ρ = 1 corresponding to the base case). This was done both for the OM and IM. When ρ = 0.1, there is maximal separation among the tubules and vessels; when ρ = 100, there is minimal separation.
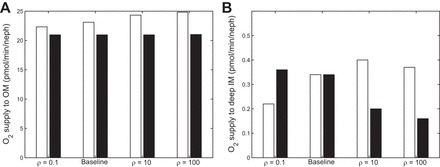
In Fig. 7, the O2 supply to the OM and deep IM (2.5 mm below the OM/IM boundary) is shown, for varying values of ρ, with and without NO-induced vasodilation. With NO-induced vasodilation, the O2 supply to the OM increases with decreasing separation, as NO diffuses from R3 and R4 (which produce the most NO) to the DVR in R1 and R2. In the deep IM, as separation decreases, O2 diffuses away from high-O2 areas such as the DVR; that is, increasing ρ causes O2 to diffuse in the opposite direction of NO. As can be seen in the black bars of Fig. 7B, this leads to a decrease in O2 supply to the deep IM for the fixed DVR radius case. In the NO-induced vasodilation case, however, the diffusion of NO into the DVR leads to vasodilation, which causes O2 supply to the deep IM to increase. These competing effects lead to nonmonotonic behavior in the NO vasodilation case as ρ increases (see Fig. 7B, white bars). Below a certain permeability threshold, reducing the separation between regions enhances the delivery of O2 to the deep IM; above that threshold, it has the opposite effect.
Fig. 7.
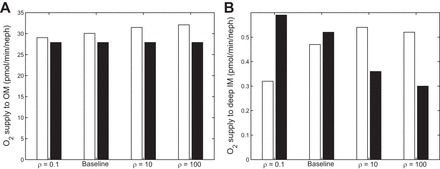
O2 supply (pmol·min−1·nephron−1) to the OM (A) and deep IM (2.5 mm below OM/IM boundary) (B) under different degrees of regionalization. Cases shown: ρ = 0.1, base case, ρ = 10, and ρ = 100, both with (white bars) and without (black bars) [NO]-induced vasodilation.
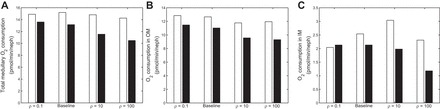
In Fig. 8, total medullary O2 consumption, as well as O2 consumption in the OM and IM individually, are shown, for varying values of ρ and with and without NO-induced vasodilation. In the OM, total consumption decreases with decreasing separation (Fig. 8B), as higher [NO] and lower [Na+] levels in the mTALs and OMCD reduce active transport. In the IM, changes in O2 consumption are correlated with changes in O2 delivery (compare Figs. 7B and 8C). At the papillary tip, Po2 steadily decreases as separation decreases in the fixed DVR radius case (from 6.0 mmHg with ρ = 0.1 to 4.2 mmHg with ρ = 100). In the NO-induced vasodilation case, however, the effects of changing ρ on papillary Po2 are nonmonotonic, similar to the effects on O2 delivery and consumption. Po2 at the papilla is predicted to be 5.2 mmHg with ρ = 100, 5.3 mmHg with ρ = 10, and 4.6 mmHg in the base case. With maximal separation (ρ = 0.1), the large decrease in O2 supply leads to a large decrease in Po2, to 3.2 mmHg.
Fig. 8.
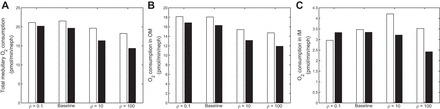
O2 consumption (pmol·min−1·nephron−1) in the whole medulla (A), in the OM (B), and in the IM (C), under different degrees of regionalization. Cases shown: ρ = 0.1, base case, ρ = 10, and ρ = 100, both with (white bars) and without (black bars) [NO]-induced vasodilation.
Figures 9 and 10 illustrate the effects of a decrease in O2 supply via a decrease in DVR inflow, from 8 nl/min in the base case to 6 nl/min. Overall trends are similar to the ones observed with the base case DVR inflow of 8 nl/min. That is, the delivery of O2 to the deep IM decreases with decreasing separation between regions assuming no NO-induced vasodilation, but it varies in a nonmonotonic manner when NO-induced vasodilation is accounted for in Fig. 9. Furthermore, O2 consumption in the deep IM varies in tandem with O2 supply to that region (Fig. 10). In addition, papillary Po2 decreases with decreasing separation in the fixed DVR radius case (from 4.5 mmHg with ρ = 0.1 to 3.2 mmHg with ρ = 100) but changes nonmonotonically in the NO-induced vasodilation case, with Po2 levels at 2.9, 3.5, 4.5, and 4.3 mmHg when ρ = 0.1, 1, 10, and 100. Note that the absolute differences between the cases with and without NO-induced vasodilation are the same at both flow rates; that is, the decrease in DVR inflow accentuates the relative differences between the NO vasodilation and fixed resistance cases.
Fig. 9.
O2 supply (pmol·min−1·nephron−1) to the OM (A) and deep IM (2.5 mm below OM/IM boundary) (B) with a DVR inflow rate of 6 nl/min (base case is 8 nl/min), under different degrees of regionalization. Cases shown: ρ = 0.1, Base Case, ρ = 10, and ρ = 100, both with (white bars) and without (black bars) [NO]-induced vasodilation.
Fig. 10.
O2 consumption (pmol·min−1·nephron−1) in the whole medulla (A), in the outer medulla (B), and in the inner medulla (C) with a DVR inflow rate of 6 nl/min (base case is 8 nl/min), under different degrees of regionalization. Cases shown: ρ = 0.1, base case, ρ = 10, and ρ = 100, both with (white bars) and without (black bars) [NO]-induced vasodilation.
DISCUSSION
We extended a detailed mathematical model of nitric oxide and superoxide transport in the rat renal medulla (17) to include the effects of NO-mediated vasodilation. The model represents the radial organization of renal medullary vessels and tubules, centered around vascular bundles in the OM and around CDs in the IM. The model predicts 1) concentrations of Na+, urea, O2, NO, and O2− in all represented structures, as well as Hb, HbO2, and HbNO in the RBCs, and 2) flow rates of water and solutes in the vessels and tubules. Simulation results suggest that the two ways in which NO acts to prevent medullary hypoxia, namely by increasing O2 supply via vasodilation and by reducing active sodium transport and therefore O2 consumption, have a comparable impact on medullary oxygenation. Furthermore, model results imply that a reduction in tubular transport efficiency is the main factor by which increased O2− levels lead to hypoxia and that flow-induced increases in O2− levels during hyperfiltration are not a likely pathway to medullary hypoxia.
Contribution of NO to maintenance of medullary Po2.
Experiments have demonstrated that NO helps to maintain Po2 levels and blunt hypoxia (6). This may be achieved via the capacity of NO to dilate DVR, increasing blood flow and thus O2 supply, and/or via the ability of NO to inhibit active sodium transport and thus lower O2 consumption. These two NO-mediated pathways are difficult to modulate individually in a laboratory experiment, and the assessment of their relative contributions to medullary oxygenation is a question amenable to our modeling approach.
Model results suggest that the NO-induced decrease in O2 consumption and increase in O2 supply contribute to raising medullary Po2 to a similar extent. In other words, the vasodilatory effects of NO per se significantly increase medullary oxygenation when the generation rate of NO is raised (Fig. 4). Conversely, when NO levels are reduced, O2 supply to the medulla is substantially reduced, and the predicted mTAL Po2 is lower than when the vasoactive properties of NO are not considered (Fig. 4D). The model thus predicts that the vasoactive properties of NO may exacerbate hypoxic conditions when NO is reduced.
Effects of oxidative stress on medullary Po2.
Elevated oxidative stress in the rat kidney leads to mitochondrial uncoupling, which reduces tubular transport efficiency and thus increases O2 consumption (44). This is manifested as a decrease in the TQ ratio, whereby the number of moles of O2 that are consumed to actively transport one mole of Na+ increases. However, increased O2− levels also stimulate active sodium transport, so it is not clear whether the decrease in Po2 that accompanies oxidative stress is due to more active pumping or to a reduction in pumping efficiency. Furthermore, there are multiple sources of oxidative stress in the kidney. In particular, experiments have demonstrated a dependence of O2− generation on flow rate, such that hyperfiltration leads to increased O2−. We thus investigated which of these pathways contributes most to oxidative stress leading to hypoxia and whether the increase in O2− levels from hyperfiltration was sufficient to reduce medullary oxygenation.
Model results suggest that increased O2− levels, whether from hyperfiltration or other sources of oxidative stress, are not sufficient to significantly lower Po2, unless the effects of O2− on TQ are considered. Even though increases in O2− levels elevate the rate of active Na+ transport, the compensating effect of an increased ratio of anaerobic-to-aerobic metabolism serves to mitigate increases in O2 consumption and thus prevent large decreases in Po2. In the case where the impact of O2− on TQ is included, the model predicts more noticeable decreases in Po2 with increases in O2− (Fig. 6D). This indicates that the effects of O2− on Po2 mostly stem from a reduction in metabolic efficiency, rather than from an increase in . In addition, model results suggest that in the physiologically relevant range of hyperfiltration, the resulting flow-induced increase in O2− levels is only ∼25%. If one assumes that “oxidative stress” occurs when medullary O2− levels increase by at least a factor of 2, then the model predicts that oxidative stress does not result from hyperfiltration per se. In other words, some other source of oxidative stress, leading to mitochondrial uncoupling and lowered metabolic efficiency, is a more likely pathway to hypoxia.
Impact of structural organization.
We previously examined the impact of the three-dimensional organization of tubules and vessels in the renal medulla on O2 transport with a model that did not include NO and O2− (18). This previous model predicted that in the absence of distinct interstitial regions, oxygen delivery to the IM would drastically decrease, with the terminal IM nearly completely deprived of oxygen. Based on these results, we postulated that one of the functional roles of the three-dimensional medullary architecture may be to preserve oxygen delivery to the papilla. The present simulations suggest a more nuanced picture. In the IM, NO and O2 travel radially in opposite directions: NO diffuses into the DVR thereby favoring vasodilation and a higher O2 supply, whereas O2 diffuses away from blood vessels. When the degree of separation between regions is reduced, that is, when the interregion permeability increases but remains below a certain threshold, these counterbalancing effects result in a higher delivery of O2 to the deep IM. As the interregion permeability is elevated beyond that threshold, O2 supply to the deep IM starts to decline. In other words, a perfectly homogeneous interstitium would be detrimental to the oxygenation of the deep medulla. However, the degree of separation which we assume represents physiological conditions may not maximize O2 delivery to the IM.
Interstitial pH varies within the medulla, with the IM being more acidic than the OM. Radially, interstitial fluid surrounding the thick ascending limbs has been shown to have a pH lower than that in the vascular bundles (8); similarly, interstitial fluid surrounding the IMCD is more acidic than that around the DVR (28). In a previous study (18), we assessed the impact of varying pH on medullary oxygenation and sodium transport. To that end, we allowed the O2 dissociation curve to shift to the right under conditions of increased acidity. Modeling results suggest that the acidity in the interbundle and intrabundle regions facilitates the dissociation of HbO2, leading to higher O2 availability and a slight increase in active Na+ reabsorption from the TAL and IMCD. Our simulations suggest that the effects of pH on NO-mediated vasodilation and oxidative stress are insignificant (results not shown). Thus the pH effects were not included in the present model.
Model limitations and future extensions.
One major limitation of the model stems from the lack of experimental measurements of NO and O2− concentrations in the renal medulla with which to compare our results. To the best of our knowledge, absolute measurements of medullary O2− concentrations have not been made, and measurements of NO in the medulla vary over an order of magnitude. Equations that describe the effects of NO and O2− on active Na+ transport (Eqs. 12 and 13) involve parameters that were fitted to available experimental data; however, due to the dearth of such data in the medulla, the parameter choices are necessarily uncertain. In addition, the assumed form of Eq. 3 that describes how DVR radius varies with changing NO concentrations is extrapolated from a small number of data points (25). In light of these issues, the model would benefit from experimental measurements of O2− levels in the medulla, as well as sodium transport in differing NO and O2− environments, and DVR radii in a range of NO concentrations.
Fluid dynamics in the vasa recta is represented as quasi steady-state Poiseuille flow, which assumes laminar flow through a long pipe with uniform radius. Because the RBC radius is comparable to that of DVR lumen, the assumption of laminar flow may not be appropriate, and the conditions for Poiseuille flow are at best approximately satisfied. A more realistic model would be based on fluid-structure interactions, with fluid dynamics described by the Navier-Stokes equations and with the RBCs modeled explicitly as deformable objects immersed in the fluid. However, the computations required for solving the Navier-Stokes equations and the fluid-structure interaction equations are very time-consuming and beyond the scope of this model.
Avoidance of medullary hypoxia requires the interplay of a variety of interrelated mechanisms, affecting oxygen delivery and consumption. In particular, the balance between the opposing solutes NO and O2− helps to maintain homeostatic levels of medullary oxygenation. Future modeling studies investigating the impairment of autoregulatory mechanisms may provide further insight into the causes of hypoxic conditions in disease states such as diabetes and hypertension.
GRANTS
This research was supported by National Institute of Diabetes and Digestive and Kidney Diseases Grant DK-089066.
DISCLOSURES
No conflicts of interest, financial or otherwise, are declared by the author(s).
AUTHOR CONTRIBUTIONS
Author contributions: B.C.F., A.E., and A.T.L. conception and design of research; B.C.F. performed experiments; B.C.F., A.E., and A.T.L. analyzed data; B.C.F., A.E., and A.T.L. interpreted results of experiments; B.C.F. prepared figures; B.C.F. and A.T.L. drafted manuscript; B.C.F., A.E., and A.T.L. edited and revised manuscript; B.C.F., A.E., and A.T.L. approved final version of manuscript.
REFERENCES
- 1.Arciero JC, Carlson BE, Secomb TW. Theoretical model of metabolic blood flow autoregulation: roles of ATP release by red blood cells and conducted responses. Am J Physiol Heart Circ Physiol 295: H1562–H1571, 2008. [DOI] [PMC free article] [PubMed] [Google Scholar]
- 2.Bagnasco S, Good D, Balaban R, Burg M. Lactate production in isolated segments of the rat nephron. Am J Physiol Renal Fluid Electrolyte Physiol 248: F522–F526, 1985. [DOI] [PubMed] [Google Scholar]
- 3.Bankir L, de Rouffignac C. Urinary concentrating ability: insights from comparative anatomy. Am J Physiol Regul Integr Comp Physiol 249: R643–R666, 1985. [DOI] [PubMed] [Google Scholar]
- 4.Bottcher W, Steinhausen M. Microcirculation of the renal papilla of rats under control conditions and after temporary ischemia. Kidney Int 10: S74–S80, 1976. [PubMed] [Google Scholar]
- 5.Brenner BM, Meyer TW, Hostetter TH. Dietary protein intake and the progressive nature of kidney disease: the role of hemodynamically mediated glomerular injury in the pathogenesis of progressive glomerular sclerosis in aging, renal ablation, and intrinsic renal disease. N Engl J Med 307: 652–659, 1982. [DOI] [PubMed] [Google Scholar]
- 6.Brezis M, Heyman SN, Dinour D, Epstein FH, Rosen S. Role of nitric oxide in renal medullary oxygenation: studies in isolated and intact rat kidneys. J Clin Invest 88: 390–395, 1991. [DOI] [PMC free article] [PubMed] [Google Scholar]
- 7.Brezis M, Rosen S. Hypoxia of the renal medulla: its implications for disease. N Engl J Med 332: 647–655, 1995. [DOI] [PubMed] [Google Scholar]
- 8.Burke TJ, Malhotra D, Shapiro JL. Factors maintaining a pH gradient within the kidney: role of the vascular architecture. Kidney Int 56, 1999. [DOI] [PubMed] [Google Scholar]
- 9.Chen J, Edwards A, Layton AT. A mathematical model of oxygen transport in the rat outer medulla. II. Impacts of outer medullary architecture. Am J Physiol Renal Physiol 297: F537–F548, 2009. [DOI] [PMC free article] [PubMed] [Google Scholar]
- 10.Chen J, Layton AT, Edwards A. A mathematical model of oxygen transport in the rat outer medulla. I. Model formulation and baseline results. Am J Physiol Renal Physiol 297: F517–F536, 2009. [DOI] [PMC free article] [PubMed] [Google Scholar]
- 11.Chen Y, Gill PS, Welch WJ. Oxygen availability limits renal NADPH-dependent superoxide production. Am J Physiol Renal Physiol 289: F749–F753, 2005. [DOI] [PubMed] [Google Scholar]
- 11a.Clark A Jr, Federspiel WJ, Clark PA, Cokelet GR. Oxygen delivery from red cells. Biophys J 47: 171–181, 1985. [DOI] [PMC free article] [PubMed] [Google Scholar]
- 12.Cowley AW., Jr Renal medullary oxidative stress, pressure-natriuresis, and hypertension. Hypertension 52: 777–786, 2008. [DOI] [PMC free article] [PubMed] [Google Scholar]
- 13.Dickman KG, Mandel LJ. Differential effects of respiratory inhibitors on glycolysis in proximal tubules. Am J Physiol Renal Fluid Electrolyte Physiol 258: F1608–F1615, 1990. [DOI] [PubMed] [Google Scholar]
- 14.Edwards A, Cao C, Pallone TL. Cellular mechanisms underlying nitric oxide-induced vasodilation of descending vasa recta. Am J Physiol Renal Physiol 300: F441–F456, 2011. [DOI] [PMC free article] [PubMed] [Google Scholar]
- 15.Edwards A, Layton AT. Nitric oxide and superoxide transport in a cross-section of the rat outer medulla. I. Effects of low medullary oxygen tension. Am J Physiol Renal Physiol 299: F616–F633, 2010. [DOI] [PMC free article] [PubMed] [Google Scholar]
- 16.Evans RG, Ince C, Joles JA, Smith DW, May CN, O'Connor PM, Gardiner BS. Haemodynamic influences on kidney oxygenation: the clinical implications of integrative physiology. Clin Exp Pharmacol Physiol 40: 106–122, 2013. [DOI] [PubMed] [Google Scholar]
- 17.Fry BC, Edwards A, Layton AT. Impacts of nitric oxide and superoxide on renal medullary oxygen transport and urine concentration. Am J Physiol Renal Physiol 308: F967–F980, 2015. [DOI] [PMC free article] [PubMed] [Google Scholar]
- 18.Fry BC, Edwards A, Sgouralis I, Layton AT. Impact of renal medullary three-dimensional architecture on oxygen transport. Am J Physiol Renal Physiol 307: F263–F272, 2014. [DOI] [PMC free article] [PubMed] [Google Scholar]
- 19.Fry BC, Layton AT. Oxygen transport in a cross section of the rat inner medulla: Impact of heterogeneous distribution of nephrons and vessels. Math Biosci 258: 68–76, 2014. [DOI] [PMC free article] [PubMed] [Google Scholar]
- 20.Greger R, Schlatter E, Lang F. Evidence for electroneutral sodium chloride co-transport in the cortical thick ascending limb of Henle's loop of rabbit kidney. Pflügers Arch 396: 308–314, 1983. [DOI] [PubMed] [Google Scholar]
- 21.Hellums JD, Nair PK, Huang NS, Ohshima N. Simulation of intraluminal gas transport processes in the microcirculation. Ann Biomed Eng 24: 1–24, 1996. [DOI] [PubMed] [Google Scholar]
- 22.Heyman SN, Goldfard M, Darmon D, Brezis M. Tissue oxygenation modified nitric oxide bioavailability. Microcirculation 6: 199–203, 1999. [PubMed] [Google Scholar]
- 22a.Heyman F, Karmeli SN, Rachmilewitz D, Haj-Yehia A, Brezis M. Intrarenal nitric oxide monitoring with a clark-type electrode: potential pitfalls. Kidney Int 51: 1619–1623, 1997. [DOI] [PubMed] [Google Scholar]
- 23.Hong NJ, Garvin JL. Flow increases superoxide production by NADPH oxidase via activation of Na-K-2Cl cotransport and mechanical stress in thick ascending limbs. Am J Physiol Renal Physiol 292: F993–F998, 2007. [DOI] [PubMed] [Google Scholar]
- 25.Kakoki M, Zou AP, Mattson DL. The influence of nitric oxide synthase 1 on blood flow and interstitial nitric oxide in the kidney. Am J Physiol Regul Integr Comp Physiol 281: R91–R97, 2001. [DOI] [PubMed] [Google Scholar]
- 27.Kriz W, Kaissling B. Structural organization of the mammalian kidney. In: The Kidney: Physiology and Pathophysiology (3rd ed). Philadelphia, PA: Lippincott, Williams & Wilkins, 2000, p. 587–654. [Google Scholar]
- 28.Kuramochi G, Kersting U, Silbernagl S, Dantzler WH. Changes in the counter-current system in the renal papilla: diuresis increases pH and HCO3− gradients between collecting duct and vasa recta. Pflügers Arch 432: 1062–1068, 1996. [DOI] [PubMed] [Google Scholar]
- 29.Layton AT. A mathematical model of the urine concentrating mechanism in the rat renal medulla. I. Formulation and base-case results. Am J Physiol Renal Physiol 300: F356–F371, 2011. [DOI] [PMC free article] [PubMed] [Google Scholar]
- 30.Layton AT, Layton HE. A region-based mathematical model of the urine concentrating mechanism in the rat outer medulla. I. Formulation and base-case results. Am J Physiol Renal Physiol 289: F1346–F1366, 2005. [DOI] [PubMed] [Google Scholar]
- 31.Layton HE, Pitman EB, Moore LC. Bifurcation analysis of TGF-mediated oscillations in SNGFR. Am J Physiol Renal Fluid Electrolyte Physiol 261: F904–F919, 1991. [DOI] [PubMed] [Google Scholar]
- 32.Lemley KV, Kriz W. Cycles and separations: the histotopography of the urinary concentrating process. Kidney Int 31: 538–548, 1987. [DOI] [PubMed] [Google Scholar]
- 33.Mattson DL, Lu SH, Cowley AW Jr. Role of nitric oxide in the control of the renal medullary circulation. Clin Exp Pharm Physiol 24: 587–590, 1997. [DOI] [PubMed] [Google Scholar]
- 34.Moss R, Thomas SR. Hormonal regulation of salt and water excretion: a mathematical model of whole kidney function and pressure natriuresis. Am J Physiol Renal Physiol 306: F224–F248, 2014. [DOI] [PubMed] [Google Scholar]
- 35.Nagababu E, Ramasamy S, Abernethy DR, Rifkind JM. Active nitric oxide produced in the red cell under hypoxic conditions by deoxyhemoglobin-mediated nitrite reduction. J Biol Chem 278: 46349–46356, 2003. [DOI] [PubMed] [Google Scholar]
- 36.Nangaku M. Chronic hypoxia and tubulointerstitial injury: a final common pathway to end-stage renal failure. J Am Soc Nephrol 17: 17–25, 2006. [DOI] [PubMed] [Google Scholar]
- 37.Nelimarkka O. Renal oxygen and lactate metabolism in hemorrhagic shock. An experimental study. Acta Chir Scand Suppl 518: 1–44, 1984. [PubMed] [Google Scholar]
- 38.Neuhofer W, Beck FX. Cell survival in the hostile environment of the renal medulla. Annu Rev Physiol 67: 531–555, 2005. [DOI] [PubMed] [Google Scholar]
- 39.Nieves-Gonzalez A, Clausen C, Layton AT, Layton HE, Moore LC. Transport efficiency and workload distribution in a mathematical model of the thick ascending limb. Am J Physiol Renal Physiol 304: F653–F664, 2013. [DOI] [PMC free article] [PubMed] [Google Scholar]
- 40.Ortiz PA, Garvin JL. Superoxide stimulates NaCl absorption by the thick ascending limb. Am J Physiol Renal Physiol 283: F957–F962, 2002. [DOI] [PubMed] [Google Scholar]
- 41.Ortiz PA, Hong NJ, Garvin JL. NO decreases thick ascending limb chloride absorption by reducing Na+-K+-2Cl− cotransporter activity. Am J Physiol Renal Physiol 281: F819–F825, 2001. [DOI] [PubMed] [Google Scholar]
- 42.Palacios-Callender M, Hollis V, Mitchison M, Frakich N, Unitt D, Moncada S. Cytochrome c oxidase regulates endogenous nitric oxide availability in respiring cells: a possible explanation for hypoxic vasodilation. Proc Natl Acad Sci USA 104: 18508–18513, 2007. [DOI] [PMC free article] [PubMed] [Google Scholar]
- 43.Pallone TL, Zhang Z, Rhinehart K. Physiology of the renal medullary microcirculation. Am J Physiol Renal Physiol 284: F253–F266, 2003. [DOI] [PubMed] [Google Scholar]
- 44.Palm F, Nordquist L. Renal oxidative stress, oxygenation, and hypertension. Am J Physiol Regul Integr Comp Physiol 301: R1229–R1241, 2011. [DOI] [PMC free article] [PubMed] [Google Scholar]
- 45.Pannabecker TL, Abbott DE, Dantzler WH. Three-dimensional functional reconstruction of inner medullary thin limbs of Henle's loop. Am J Physiol Renal Physiol 286: F38–F45, 2004. [DOI] [PubMed] [Google Scholar]
- 46.Pannabecker TL, Dantzler WH. Three-dimensional lateral and vertical relationship of inner medullary loops of Henle and collecting duct. Am J Physiol Renal Physiol 287: F767–F774, 2004. [DOI] [PubMed] [Google Scholar]
- 47.Pannabecker TL, Dantzler WH. Three-dimensional architecture of inner medullary vasa recta. Am J Physiol Renal Physiol 290: F1355–F1366, 2006. [DOI] [PubMed] [Google Scholar]
- 48.Pannabecker TL, Dantzler WH. Three-dimensional architecture of collecting ducts, loops of Henle, and blood vessels in the renal papilla. Am J Physiol Renal Physiol 293: F696–F704, 2007. [DOI] [PubMed] [Google Scholar]
- 49.Pawloski JR, Hess DT, Stamler JS. Impaired vasodilation by red blood cells in sickle cell disease. Proc Natl Acad Sci USA 102: 2531–2536, 2005. [DOI] [PMC free article] [PubMed] [Google Scholar]
- 50.Plato CF, Stoos BA, Wang D, Garvin JL. Endogenous nitric oxide inhibits chloride transport in the thick ascending limb. Am J Physiol Renal Physiol 276: F159–F163, 1999. [DOI] [PubMed] [Google Scholar]
- 51.Stokes JB, Grupp C, Kinne RK. Purification of rat papillary collecting duct cells: functional and metabolic assessment. Am J Physiol Renal Fluid Electrolyte Physiol 253: F251–F262, 1987. [DOI] [PubMed] [Google Scholar]
- 52.Uchida S, Endou H. Substrate specificity to maintain cellular ATP along the mouse nephron. Am J Physiol Renal Fluid Electrolyte Physiol 255: F977–F983, 1988. [DOI] [PubMed] [Google Scholar]
- 53.Welch WJ, Baumgartl H, Lubbers D, Wilcox CS. Nephron Po2 and renal oxygen usage in the hypertensive rat kidney. Kidney Int 59: 230–237, 2001. [DOI] [PubMed] [Google Scholar]
- 54.Whorton AR, Simonds DB, Piantadosi CA. Regulation of nitric oxide synthesis by oxygen in vascular endothelial cells. Am J Physiol Lung Cell Mol Physiol 272: L1161–L1166, 1997. [DOI] [PubMed] [Google Scholar]
- 55.Zeidel ML, Silva P, Seifter JL. Intracellular pH regulation and proton transport by rabbit renal medullary collecting duct cells: role of plasma membrane proton adenosine triphosphatase. J Clin Invest 77: 113–120, 1986. [DOI] [PMC free article] [PubMed] [Google Scholar]